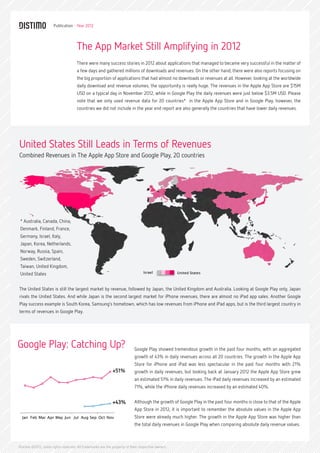
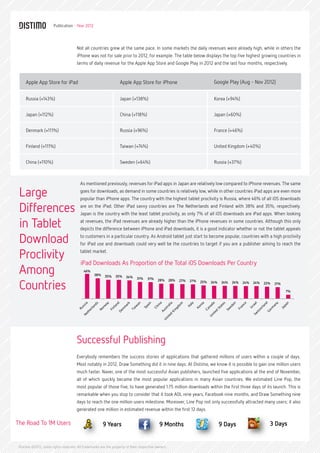
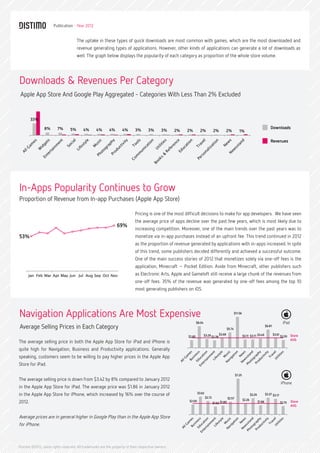
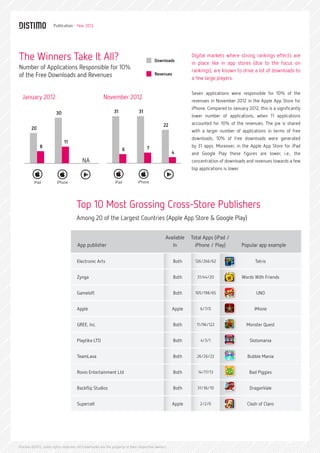
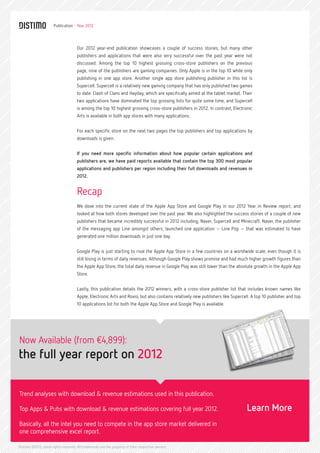
2012
                                   Year In Review

                                     By Gert Jan Spriensma, Analyst at Distimo

                                                            Publication - Year 2012


Distimo ©2012, some rights reserved. All trademarks are the property of their respective owners.
Publication - Year 2012


                                                                                  me is
                                                                             my na
                                                                      Hello,


                                     A brief introduction
                                     Distimo has a very clear objective: to make the app market transparent.
                                     The company was born out of the frustration of a lack of insights into
                                     the performance of apps and the manual work needed to track important
                                     metrics.

                                     Our goal is to provide the best and most actionable app intelligence for anyone who
                                     wants to compete in the app market. Our data-driven team seeks to help developers,
                                     brands and financial services companies gain actionable, timely and factual
                                     knowledge of what’s happening daily in the global app market.


                                     We offer three core services:

                                     •	App Analytics

                                        to track all of your important app data across all major app stores and ad networks.


                                     •	Conversion Tracking

                                        to measure your full app sales funnel from discovery and campaigns to app launch.


                                     •	Market Data

                                        to analyze the daily download and revenue volumes of any app in the market.


                                     Founded in 2009, Distimo is a privately held company based in The Netherlands.
                                     Follow us on Twitter, read our blog or learn more at www.distimo.com.


Distimo ©2012, some rights reserved. All trademarks are the property of their respective owners.
Publication - Year 2012


New and noteworthy
A couple of winners emerged, some late entrants showed promise and Microsoft launched a new app store in 2012. This year-end report focuses
on the clear winners in 2012: the Apple App Store and Google Play. Android has been long hailed as the winner in terms of device installs, however
until last year developers complained about Google Play and the lack of monetization on the platform. Apple, on the other hand, redefined the app
store model, and proved to be highly successful in terms of monetization for developers. The large amount of applications (700K) that are available
on both platforms decreased the ease of discovery, and thus made it more difficult for developers to become successful. Still, some new publishers
managed to become successful and did so extremely rapidly, like Draw Something. This report details how the stores compare, who the clear
publisher and application winners of 2012 were, and shows the trends and stats in play to become the success story of 2013.


                                     The major findings are:
                                       Google Play showed tremendous growth during the past four months, with an aggregated growth in daily revenue
                                       of 43% across 20 of the largest countries, while the Apple App Store for iPhone and iPad grew by 21% in daily
                                       revenue in the same period.


                                       Even though the growth in revenues in Google Play in the last four months is close to that of the Apple App Store
                                       in 2012, the growth in daily revenues in the Apple App Store was higher than the total daily revenues in Google
                                       Play when comparing absolute daily revenue values.


                                       Draw Something, one of the best known apps of 2012, reached 1M users in 9 days, however we’ve found it is
                                       possible to gain 1M users even faster. Naver, one of the most successful Asian publishers, launched five applications
                                       at the end of November 2012, and all five quickly became the most popular applications in many Asian countries.
                                       We estimated Line Pop, the most popular of the five, generated 1.75M downloads within 72 hours.


                                       Looking at the worldwide download volumes, the app store opportunity is large. On a typical day in November
                                       2012, the revenues in the Apple App Store exceeded $15M USD, while in Google Play the revenues are just below
                                       $3.5M USD in 20 of the largest countries in both app stores.


                                       Seven applications were responsible for 10% of the revenues in November 2012 in the Apple App Store for iPhone,
                                       which is significantly lower number of applications than in January 2012. Moreover, in the Apple App Store for iPad,
                                       six applications were responsible for 10% of the revenues, while in Google Play this figure was four.


                                       The country with the highest tablet download proclivity is Russia, where 46% of all iOS downloads are on the
                                       iPad. Other countries with a high proclivity of iPad downloads are The Netherlands and Finland with 38% and
                                       35%, respectively. Japan is the country with the least tablet download proclivity, as only 7% of all iOS downloads
                                       are iPad apps. The iPad revenues are already higher than the iPhone revenues in some countries when looking at
                                       revenues, e.g. Russia.


                                       The proportion of revenue that derived from in-apps increased from 53% to 69% in 2012. However, in 2012 there
                                       were still some publishers who were very successful with a paid-only strategy. Moreover, 35% of the revenue from
                                       the top 10 publishers was derived from one-off fees in 2012.


Distimo ©2012, some rights reserved. All trademarks are the property of their respective owners.
Publication - Year 2012


                                     The App Market Still Amplifying in 2012
                                     There were many success stories in 2012 about applications that managed to became very successful in the matter of
                                     a few days and gathered millions of downloads and revenues. On the other hand, there were also reports focusing on
                                     the big proportion of applications that had almost no downloads or revenues at all. However, looking at the worldwide
                                     daily download and revenue volumes, the opportunity is really huge. The revenues in the Apple App Store are $15M
                                     USD on a typical day in November 2012, while in Google Play the daily revenues were just below $3.5M USD. Please
                                     note that we only used revenue data for 20 countries* in the Apple App Store and in Google Play, however, the
                                     countries we did not include in the year end report are also generally the countries that have lower daily revenues.


United States Still Leads in Terms of Revenues
Combined Revenues in The Apple App Store and Google Play, 20 countries


 * Australia, Canada, China,
 Denmark, Finland, France,
 Germany, Israel, Italy,
 Japan, Korea, Netherlands,
 Norway, Russia, Spain,
 Sweden, Switzerland,
 Taiwan, United Kingdom,
 United States                                                                  Israel             United States


The United States is still the largest market by revenue, followed by Japan, the United Kingdom and Australia. Looking at Google Play only, Japan
rivals the United States. And while Japan is the second largest market for iPhone revenues, there are almost no iPad app sales. Another Google
Play success example is South Korea, Samsung’s hometown, which has low revenues from iPhone and iPad apps, but is the third largest country in
terms of revenues in Google Play.


Google Play: Catching Up?                                                  Google Play showed tremendous growth in the past four months, with an aggregated
                                                                           growth of 43% in daily revenues across all 20 countries. The growth in the Apple App
                                                                           Store for iPhone and iPad was less spectacular in the past four months with 21%
                                                            +51%           growth in daily revenues, but looking back at January 2012 the Apple App Store grew
                                                                           an estimated 51% in daily revenues. The iPad daily revenues increased by an estimated
                                                                           71%, while the iPhone daily revenues increased by an estimated 40%.


                                                            +43%           Although the growth of Google Play in the past four months is close to that of the Apple
                                                                           App Store in 2012, it is important to remember the absolute values in the Apple App
  Jan Feb Mar Apr May Jun Jul Aug Sep Oct Nov                              Store were already much higher. The growth in the Apple App Store was higher than
                                                                           the total daily revenues in Google Play when comparing absolute daily revenue values.


Distimo ©2012, some rights reserved. All trademarks are the property of their respective owners.
Publication - Year 2012


                                      Not all countries grew at the same pace. In some markets the daily revenues were already high, while in others the
                                      iPhone was not for sale prior to 2012, for example. The table below displays the top five highest growing countries in
                                      terms of daily revenue for the Apple App Store and Google Play in 2012 and the last four months, respectively.


     Apple App Store for iPad                                     Apple App Store for iPhone                                 Google Play (Aug - Nov 2012)


     Russia (+143%)                                               Japan (+138%)                                              Korea (+94%)


     Japan (+112%)                                                China (+118%)                                              Japan (+60%)


     Denmark (+111%)                                              Russia (+96%)                                              France (+46%)


     Finland (+111%)                                              Taiwan (+74%)                                              United Kingdom (+40%)


     China (+110%)                                                Sweden (+64%)                                              Russia (+37%)


                                        As mentioned previously, revenues for iPad apps in Japan are relatively low compared to iPhone revenues. The same

 Large                                  goes for downloads, as demand in some countries is relatively low, while in other countries iPad apps are even more
                                        popular than iPhone apps. The country with the highest tablet proclivity is Russia, where 46% of all iOS downloads

 Differences                            are on the iPad. Other iPad savvy countries are The Netherlands and Finland with 38% and 35%, respectively.
                                        Japan is the country with the least tablet proclivity, as only 7% of all iOS downloads are iPad apps. When looking

 in Tablet                              at revenues, the iPad revenues are already higher than the iPhone revenues in some countries. Although this only
                                        depicts the difference between iPhone and iPad downloads, it is a good indicator whether or not the tablet appeals

 Download                               to customers in a particular country. As Android tablet just start to become popular, countries with a high proclivity
                                        for iPad use and downloads could very well be the countries to target if you are a publisher aiming to reach the

 Proclivity                             tablet market.

                                         iPad Downloads As Proportion of the Total iOS Downloads Per Country
 Among                                     46%
                                                  38%   35%    35%    34%    31%    31%

 Countries
                                                                                           28%      28%   27%   27%   25%   24%   24%   24%   24%   24%   22%   21%

                                                                                                                                                                      7%


                                      Successful Publishing
                                      Everybody remembers the success stories of applications that gathered millions of users within a couple of days.
                                      Most notably in 2012, Draw Something did it in nine days. At Distimo, we know it is possible to gain one million users
                                      much faster. Naver, one of the most successful Asian publishers, launched five applications at the end of November,
                                      all of which quickly became the most popular applications in many Asian countries. We estimated Line Pop, the
                                      most popular of those five, to have generated 1.75 million downloads within the first three days of its launch. This is
                                      remarkable when you stop to consider that it took AOL nine years, Facebook nine months, and Draw Something nine
                                      days to reach the one million users milestone. Moreover, Line Pop not only successfully attracted many users; it also
                                      generated one million in estimated revenue within the first 12 days.

The Road To 1M Users                                    9 Years                             9 Months                              9 Days                    3 Days


 Distimo ©2012, some rights reserved. All trademarks are the property of their respective owners.
Publication - Year 2012


                                      The uptake in these types of quick downloads are most common with games, which are the most downloaded and
                                      revenue generating types of applications. However, other kinds of applications can generate a lot of downloads as
                                      well. The graph below displays the popularity of each category as proportion of the whole store volume.


Downloads & Revenues Per Category
 Apple App Store And Google Play Aggregated - Categories With Less Than 2% Excluded


        33%

                8%       7%      5%      4%       4%      4%       4%
                                                                                                                                                                                           Downloads
                                                                           3%       3%      3%     2%   2%        2%            2%        2%              1%

                                                                                                                                                                                           Revenues


In-Apps Popularity Continues to Grow
Proportion of Revenue from In-app Purchases (Apple App Store)

                                                                           Pricing is one of the most difficult decisions to make for app developers. We have seen
                                                                           the average price of apps decline over the past few years, which is most likely due to
                                                               69%
                                                                           increasing competition. Moreover, one of the main trends over the past years was to
53%                                                                        monetize via in-app purchases instead of an upfront fee. This trend continued in 2012
                                                                           as the proportion of revenue generated by applications with in-apps increased. In spite
                                                                           of this trend, some publishers decided differently and achieved a successful outcome.
                                                                           One of the main success stories of 2012 that monetizes solely via one-off fees is the
                                                                           application, Minecraft – Pocket Edition. Aside from Minecraft, other publishers such
      Jan Feb Mar Apr May Jun Jul Aug Sep Oct Nov                          as Electronic Arts, Apple and Gameloft still receive a large chunk of the revenues from
                                                                           one-off fees. 35% of the revenue was generated by one-off fees among the top 10
                                                                           most generating publishers on iOS.


Navigation Applications Are Most Expensive                                                                                                            $11.56


                                                                                                                $8.04
Average Selling Prices in Each Category                                                                                                       $5.74
                                                                                                                                                                                       $6.81


                                                                                                                        $3.29 $2.78   $3.68                    $3.11 $3.11 $3.49               $3.61           Store
                                                                                                        $2.85                                                                                          $2.93
                                                                                                                                                                                                               AVG
The average selling price in both the Apple App Store for iPad and iPhone is
quite high for Navigation, Business and Productivity applications. Generally
speaking, customers seem to be willing to pay higher prices in the Apple App
Store for iPad.

                                                                                                                                                      $7.25
The average selling price is down from $3.42 by 8% compared to January 2012
in the Apple App Store for iPad. The average price was $1.86 in January 2012
                                                                                                                $3.62
in the Apple App Store for iPhone, which increased by 16% over the course of                                                                                           $3.29           $3.37 $3.17
                                                                                                                        $2.72                 $2.57
                                                                                                                                                               $2.26
2012.                                                                                                   $2.00
                                                                                                                                $1.62 $1.80                                    $1.86                   $1.70   Store
                                                                                                                                                                                                               AVG


Average prices are in general higher in Google Play than in the Apple App Store
for iPhone.


Distimo ©2012, some rights reserved. All trademarks are the property of their respective owners.
Publication - Year 2012


The Winners Take It All?                                                                Downloads
                                                                                                           Digital markets where strong rankings effects are
                                                                                                           in place like in app stores (due to the focus on
Number of Applications Responsible for 10%                                                                 rankings), are known to drive a lot of downloads to
of the Free Downloads and Revenues                                                      Revenues
                                                                                                           a few large players.

                                                                                                           Seven applications were responsible for 10% of the
  January 2012                                         November 2012                                       revenues in November 2012 in the Apple App Store for
                                                                                                           iPhone. Compared to January 2012, this is a significantly
                        30                                   31               31
                                                                                                           lower number of applications, when 11 applications
                                                                                              22           accounted for 10% of the revenues. The pie is shared
        20
                                                                                                           with a larger number of applications in terms of free
                                                                                                           downloads, 10% of free downloads were generated
                             11
             8                                                                     7                       by 31 apps. Moreover, in the Apple App Store for iPad
                                                                   6
                                                                                                   4       and Google Play these figures are lower, i.e., the
                                         NA                                                                concentration of downloads and revenues towards a few
                                                                                                           top applications is lower.


                                     Top 10 Most Grossing Cross-Store Publishers
                                     Among 20 of the Largest Countries (Apple App Store & Google Play)

                                                                                               Available   Total Apps (iPad /
                                      App publisher                                               In         iPhone / Play)             Popular app example

                                     Electronic Arts                                               Both     126/266/62                        Tetris


                                     Zynga                                                         Both       31/44/20                  Words With Friends


                                     Gameloft                                                      Both      105/198/65                       UNO


                                     Apple                                                         Apple       6/7/0                          iMovie


                                     GREE, Inc.                                                    Both      11/96/122                    Monster Quest


                                     Playtika LTD                                                  Both        4/3/1                       Slotomania


                                     TeamLava                                                      Both      26/26/22                     Bubble Mania


                                     Rovio Entertainment Ltd                                       Both       14/17/13                     Bad Piggies


                                     Backflip Studios                                              Both       31/36/10                     DragonVale


                                     Supercell                                                     Apple       2/2/0                      Clash of Clans


Distimo ©2012, some rights reserved. All trademarks are the property of their respective owners.
Publication - Year 2012


                                     Our 2012 year-end publication showcases a couple of success stories, but many other
                                     publishers and applications that were also very successful over the past year were not
                                     discussed. Among the top 10 highest grossing cross-store publishers on the previous
                                     page, nine of the publishers are gaming companies. Only Apple is in the top 10 while only
                                     publishing in one app store. Another single app store publishing publisher in this list is
                                     Supercell. Supercell is a relatively new gaming company that has only published two games
                                     to date: Clash of Clans and Hayday, which are specifically aimed at the tablet market. Their
                                     two applications have dominated the top grossing lists for quite some time, and Supercell
                                     is among the top 10 highest grossing cross-store publishers in 2012. In contrast, Electronic
                                     Arts is available in both app stores with many applications.


                                     For each specific store on the next two pages the top publishers and top applications by
                                     downloads is given.


                                     If you need more specific information about how popular certain applications and
                                     publishers are, we have paid reports available that contain the top 300 most popular
                                     applications and publishers per region including their full downloads and revenues in
                                     2012.


                                     Recap
                                     We dove into the current state of the Apple App Store and Google Play in our 2012 Year in Review report, and
                                     looked at how both stores developed over the past year. We also highlighted the success stories of a couple of new
                                     publishers that became incredibly successful in 2012 including, Naver, Supercell and Minecraft. Naver, the publisher
                                     of the messaging app Line amongst others, launched one application – Line Pop – that was estimated to have
                                     generated one million downloads in just one day.


                                     Google Play is just starting to rival the Apple App Store in a few countries on a worldwide scale, even though it is
                                     still losing in terms of daily revenues. Although Google Play shows promise and had much higher growth figures than
                                     the Apple App Store, the total daily revenue in Google Play was still lower than the absolute growth in the Apple App
                                     Store.


                                     Lastly, this publication details the 2012 winners, with a cross-store publisher list that includes known names like
                                     Apple, Electronic Arts and Rovio, but also contains relatively new publishers like Supercell. A top 10 publisher and top
                                     10 applications list for both the Apple App Store and Google Play is available.


Now Available (from €4,899):
the full year report on 2012

Trend analyses with download & revenue estimations used in this publication.

Top Apps & Pubs with download & revenue estimations covering full year 2012.                                                    Learn More
Basically, all the intel you need to compete in the app store market delivered in
one comprehensive excel report.

Distimo ©2012, some rights reserved. All trademarks are the property of their respective owners.
Publication - Year 2012


                                     Top 10 Publishers
                                     By Downloads In Apple App Store In 2012

                                                                                               Total apps Avg. price
                                      App publisher                                         (iPad / iPhone) paid apps            Popular app example

                                     Apple                                                          6/7      $7.43                   GarageBand


                                     Gameloft                                                      105/198   $5.32                 Modern Combat 4


                                     Google, Inc.                                                   12/23      -                       YouTube


                                     Disney                                                        144/131   $3.18                     Cars 2


                                     Electronic Arts                                               126/266   $3.21                  The Simpsons


                                     Out Fit 7 Ltd.                                                 31/33    $1.75                 Talking Tom Cat


                                     Rovio Entertainment Ltd                                        14/17    $2.10              Angry Birds: Star Wars


                                     Tencent Technology                                             21/64      -                       WeChat


                                     Chillingo Ltd                                                 212/347   $1.84                  Parking Mania


                                     Zynga                                                          31/44    $2.75                  Respawnables


                                     Top 10 Applications
                                     By Downloads In Apple App Store In 2012


                                                      Instagram                                1             Draw Something Free                     6


                                                    Temple Run                                 2                     iTunes U                        7


                                                  Find My iPhone                               3                     YouTube                         8


                                                      Facebook                                 4                     Podcasts                        9


                                                        iBooks                                 5                     Twitter                         10


Distimo ©2012, some rights reserved. All trademarks are the property of their respective owners.
Publication - Year 2012


                                     Top 10 Publishers
                                     By Downloads* In Google Play In 2012

                                                                                                       Total   Avg. price
                                      App publisher                                                    apps    paid apps                Popular app example

                                     Google, Inc.                                                        60        -                        Google Translate


                                     Facebook                                                             2        -                   Facebook Messenger


                                     Rovio Mobile Ltd.                                                   13      $2.29                 Angry Birds Star Wars


                                     Go Dev Team                                                         135       -                          GO SMS Pro


                                     Adobe Systems                                                       31     $10.00                       Adobe Reader


                                     Kakoa                                                                4        -                          KakaoStory


                                     YouTube                                                              1        -                            YouTube


                                     Runner Games                                                        12        -                        Basketball Shoot


                                     NHN Corporation                                                     119     $1.28                      네이버 - Naver


                                     Skype                                                                4        -                             Skype


                                      Top 10 Applications
                                      By Downloads* In Google Play In 2012


                                                     Street View                                   1                        YouTube                            6


                                                      Facebook                                     2                   Adobe Flash Player                      7


                                                    Voice Search                                   3                         Skype                             8


                                                         Maps                                      4               Whatsapp Messenger                          9


                                                         Gmail                                     5                       KakoaTalk                           10


      * Downloads include pre-installs


Distimo ©2012, some rights reserved. All trademarks are the property of their respective owners.
Publication - Year 2012


                                                Visit our webinar on the publication

                                                 2012 Year In Review
                                                     on thursday the 3rd of January
                                                    @ 05.00PM CET (08.00AM PST)


                                                                   Register here!


Distimo ©2012, some rights reserved. All trademarks are the property of their respective owners.
Publication - Year 2012


Track daily
downloads and
revenues of
any app with
Distimo AppIQ
Distimo AppIQ allows users to:
•	 Track and compare app downloads and competitor app downloads: Analyze an app’s
   market share and compare download figures versus a competitor’s in one chart.
   The chart shows the daily downloads and can also be aggregated per week or month.
   Events such as price changes, featured listings and version updates are also included,
   and allow the user to analyze the influence of each event on downloads.

•	 Analyze competing app revenues including those from in-app purchases:
   View daily revenues from competing apps side-by-side with the their own app and
   get extensive insight into the revenue generation of different business models,
   revenue per country, and platform.

•	 Identify the most popular and upcoming new apps: The Leaderboard provides the
   daily rankings of all applications, and can be viewed by app store, country, category,
   device, and free/paid/gross. All of the major app stores are supported, and for iOS
   and Android, the daily volumes per individual app are also provided. AppIQ users
   see the daily downloads and revenue from in-app purchases and one-off fees.
   Developers can also use the Leaderboard to see how many downloads are needed to
   achieve a certain ranking on any given day.


  Learn more about AppIQ at www.distimo.com/app-analytics/appiq.


Distimo ©2012, some rights reserved. All trademarks are the property of their respective owners.
Publication - Year 2012


                                     Contact us
                                     For sales inquiries, please contact Remco van den Elzen, VP Business Development at remco@distimo.com
                                     or call +31 30 82 00 567.


                                     For press inquiries please contact Mindy M. Hull at mindy@mercuryglobalpartners.com
                                     or call +31 62 504 7680 (EU) or +1 415 889 9977 (USA).


                                     Disclaimer
                                     This work is licensed under Creative Commons License “Attribution Noncommercial-Share Alike 3.0 Netherlands”. This license is
                                     available for download at http://creativecommons.org/licenses/by-nc-sa/3.0/nl/. This license ables you to use, copy, spread,
                                     and build upon this work non-commercially, as long as you credit Distimo and license your new creations under the identical
                                     terms.


Distimo ©2012, some rights reserved. All trademarks are the property of their respective owners.

Distimo publication full year 2012

  • 1.
    2012 Year In Review By Gert Jan Spriensma, Analyst at Distimo Publication - Year 2012 Distimo ©2012, some rights reserved. All trademarks are the property of their respective owners.
  • 2.
    Publication - Year2012 me is my na Hello, A brief introduction Distimo has a very clear objective: to make the app market transparent. The company was born out of the frustration of a lack of insights into the performance of apps and the manual work needed to track important metrics. Our goal is to provide the best and most actionable app intelligence for anyone who wants to compete in the app market. Our data-driven team seeks to help developers, brands and financial services companies gain actionable, timely and factual knowledge of what’s happening daily in the global app market. We offer three core services: • App Analytics to track all of your important app data across all major app stores and ad networks. • Conversion Tracking to measure your full app sales funnel from discovery and campaigns to app launch. • Market Data to analyze the daily download and revenue volumes of any app in the market. Founded in 2009, Distimo is a privately held company based in The Netherlands. Follow us on Twitter, read our blog or learn more at www.distimo.com. Distimo ©2012, some rights reserved. All trademarks are the property of their respective owners.
  • 3.
    Publication - Year2012 New and noteworthy A couple of winners emerged, some late entrants showed promise and Microsoft launched a new app store in 2012. This year-end report focuses on the clear winners in 2012: the Apple App Store and Google Play. Android has been long hailed as the winner in terms of device installs, however until last year developers complained about Google Play and the lack of monetization on the platform. Apple, on the other hand, redefined the app store model, and proved to be highly successful in terms of monetization for developers. The large amount of applications (700K) that are available on both platforms decreased the ease of discovery, and thus made it more difficult for developers to become successful. Still, some new publishers managed to become successful and did so extremely rapidly, like Draw Something. This report details how the stores compare, who the clear publisher and application winners of 2012 were, and shows the trends and stats in play to become the success story of 2013. The major findings are: Google Play showed tremendous growth during the past four months, with an aggregated growth in daily revenue of 43% across 20 of the largest countries, while the Apple App Store for iPhone and iPad grew by 21% in daily revenue in the same period. Even though the growth in revenues in Google Play in the last four months is close to that of the Apple App Store in 2012, the growth in daily revenues in the Apple App Store was higher than the total daily revenues in Google Play when comparing absolute daily revenue values. Draw Something, one of the best known apps of 2012, reached 1M users in 9 days, however we’ve found it is possible to gain 1M users even faster. Naver, one of the most successful Asian publishers, launched five applications at the end of November 2012, and all five quickly became the most popular applications in many Asian countries. We estimated Line Pop, the most popular of the five, generated 1.75M downloads within 72 hours. Looking at the worldwide download volumes, the app store opportunity is large. On a typical day in November 2012, the revenues in the Apple App Store exceeded $15M USD, while in Google Play the revenues are just below $3.5M USD in 20 of the largest countries in both app stores. Seven applications were responsible for 10% of the revenues in November 2012 in the Apple App Store for iPhone, which is significantly lower number of applications than in January 2012. Moreover, in the Apple App Store for iPad, six applications were responsible for 10% of the revenues, while in Google Play this figure was four. The country with the highest tablet download proclivity is Russia, where 46% of all iOS downloads are on the iPad. Other countries with a high proclivity of iPad downloads are The Netherlands and Finland with 38% and 35%, respectively. Japan is the country with the least tablet download proclivity, as only 7% of all iOS downloads are iPad apps. The iPad revenues are already higher than the iPhone revenues in some countries when looking at revenues, e.g. Russia. The proportion of revenue that derived from in-apps increased from 53% to 69% in 2012. However, in 2012 there were still some publishers who were very successful with a paid-only strategy. Moreover, 35% of the revenue from the top 10 publishers was derived from one-off fees in 2012. Distimo ©2012, some rights reserved. All trademarks are the property of their respective owners.
  • 4.
    Publication - Year2012 The App Market Still Amplifying in 2012 There were many success stories in 2012 about applications that managed to became very successful in the matter of a few days and gathered millions of downloads and revenues. On the other hand, there were also reports focusing on the big proportion of applications that had almost no downloads or revenues at all. However, looking at the worldwide daily download and revenue volumes, the opportunity is really huge. The revenues in the Apple App Store are $15M USD on a typical day in November 2012, while in Google Play the daily revenues were just below $3.5M USD. Please note that we only used revenue data for 20 countries* in the Apple App Store and in Google Play, however, the countries we did not include in the year end report are also generally the countries that have lower daily revenues. United States Still Leads in Terms of Revenues Combined Revenues in The Apple App Store and Google Play, 20 countries * Australia, Canada, China, Denmark, Finland, France, Germany, Israel, Italy, Japan, Korea, Netherlands, Norway, Russia, Spain, Sweden, Switzerland, Taiwan, United Kingdom, United States Israel United States The United States is still the largest market by revenue, followed by Japan, the United Kingdom and Australia. Looking at Google Play only, Japan rivals the United States. And while Japan is the second largest market for iPhone revenues, there are almost no iPad app sales. Another Google Play success example is South Korea, Samsung’s hometown, which has low revenues from iPhone and iPad apps, but is the third largest country in terms of revenues in Google Play. Google Play: Catching Up? Google Play showed tremendous growth in the past four months, with an aggregated growth of 43% in daily revenues across all 20 countries. The growth in the Apple App Store for iPhone and iPad was less spectacular in the past four months with 21% +51% growth in daily revenues, but looking back at January 2012 the Apple App Store grew an estimated 51% in daily revenues. The iPad daily revenues increased by an estimated 71%, while the iPhone daily revenues increased by an estimated 40%. +43% Although the growth of Google Play in the past four months is close to that of the Apple App Store in 2012, it is important to remember the absolute values in the Apple App Jan Feb Mar Apr May Jun Jul Aug Sep Oct Nov Store were already much higher. The growth in the Apple App Store was higher than the total daily revenues in Google Play when comparing absolute daily revenue values. Distimo ©2012, some rights reserved. All trademarks are the property of their respective owners.
  • 5.
    Publication - Year2012 Not all countries grew at the same pace. In some markets the daily revenues were already high, while in others the iPhone was not for sale prior to 2012, for example. The table below displays the top five highest growing countries in terms of daily revenue for the Apple App Store and Google Play in 2012 and the last four months, respectively. Apple App Store for iPad Apple App Store for iPhone Google Play (Aug - Nov 2012) Russia (+143%) Japan (+138%) Korea (+94%) Japan (+112%) China (+118%) Japan (+60%) Denmark (+111%) Russia (+96%) France (+46%) Finland (+111%) Taiwan (+74%) United Kingdom (+40%) China (+110%) Sweden (+64%) Russia (+37%) As mentioned previously, revenues for iPad apps in Japan are relatively low compared to iPhone revenues. The same Large goes for downloads, as demand in some countries is relatively low, while in other countries iPad apps are even more popular than iPhone apps. The country with the highest tablet proclivity is Russia, where 46% of all iOS downloads Differences are on the iPad. Other iPad savvy countries are The Netherlands and Finland with 38% and 35%, respectively. Japan is the country with the least tablet proclivity, as only 7% of all iOS downloads are iPad apps. When looking in Tablet at revenues, the iPad revenues are already higher than the iPhone revenues in some countries. Although this only depicts the difference between iPhone and iPad downloads, it is a good indicator whether or not the tablet appeals Download to customers in a particular country. As Android tablet just start to become popular, countries with a high proclivity for iPad use and downloads could very well be the countries to target if you are a publisher aiming to reach the Proclivity tablet market. iPad Downloads As Proportion of the Total iOS Downloads Per Country Among 46% 38% 35% 35% 34% 31% 31% Countries 28% 28% 27% 27% 25% 24% 24% 24% 24% 24% 22% 21% 7% Successful Publishing Everybody remembers the success stories of applications that gathered millions of users within a couple of days. Most notably in 2012, Draw Something did it in nine days. At Distimo, we know it is possible to gain one million users much faster. Naver, one of the most successful Asian publishers, launched five applications at the end of November, all of which quickly became the most popular applications in many Asian countries. We estimated Line Pop, the most popular of those five, to have generated 1.75 million downloads within the first three days of its launch. This is remarkable when you stop to consider that it took AOL nine years, Facebook nine months, and Draw Something nine days to reach the one million users milestone. Moreover, Line Pop not only successfully attracted many users; it also generated one million in estimated revenue within the first 12 days. The Road To 1M Users 9 Years 9 Months 9 Days 3 Days Distimo ©2012, some rights reserved. All trademarks are the property of their respective owners.
  • 6.
    Publication - Year2012 The uptake in these types of quick downloads are most common with games, which are the most downloaded and revenue generating types of applications. However, other kinds of applications can generate a lot of downloads as well. The graph below displays the popularity of each category as proportion of the whole store volume. Downloads & Revenues Per Category Apple App Store And Google Play Aggregated - Categories With Less Than 2% Excluded 33% 8% 7% 5% 4% 4% 4% 4% Downloads 3% 3% 3% 2% 2% 2% 2% 2% 1% Revenues In-Apps Popularity Continues to Grow Proportion of Revenue from In-app Purchases (Apple App Store) Pricing is one of the most difficult decisions to make for app developers. We have seen the average price of apps decline over the past few years, which is most likely due to 69% increasing competition. Moreover, one of the main trends over the past years was to 53% monetize via in-app purchases instead of an upfront fee. This trend continued in 2012 as the proportion of revenue generated by applications with in-apps increased. In spite of this trend, some publishers decided differently and achieved a successful outcome. One of the main success stories of 2012 that monetizes solely via one-off fees is the application, Minecraft – Pocket Edition. Aside from Minecraft, other publishers such Jan Feb Mar Apr May Jun Jul Aug Sep Oct Nov as Electronic Arts, Apple and Gameloft still receive a large chunk of the revenues from one-off fees. 35% of the revenue was generated by one-off fees among the top 10 most generating publishers on iOS. Navigation Applications Are Most Expensive $11.56 $8.04 Average Selling Prices in Each Category $5.74 $6.81 $3.29 $2.78 $3.68 $3.11 $3.11 $3.49 $3.61 Store $2.85 $2.93 AVG The average selling price in both the Apple App Store for iPad and iPhone is quite high for Navigation, Business and Productivity applications. Generally speaking, customers seem to be willing to pay higher prices in the Apple App Store for iPad. $7.25 The average selling price is down from $3.42 by 8% compared to January 2012 in the Apple App Store for iPad. The average price was $1.86 in January 2012 $3.62 in the Apple App Store for iPhone, which increased by 16% over the course of $3.29 $3.37 $3.17 $2.72 $2.57 $2.26 2012. $2.00 $1.62 $1.80 $1.86 $1.70 Store AVG Average prices are in general higher in Google Play than in the Apple App Store for iPhone. Distimo ©2012, some rights reserved. All trademarks are the property of their respective owners.
  • 7.
    Publication - Year2012 The Winners Take It All? Downloads Digital markets where strong rankings effects are in place like in app stores (due to the focus on Number of Applications Responsible for 10% rankings), are known to drive a lot of downloads to of the Free Downloads and Revenues Revenues a few large players. Seven applications were responsible for 10% of the January 2012 November 2012 revenues in November 2012 in the Apple App Store for iPhone. Compared to January 2012, this is a significantly 30 31 31 lower number of applications, when 11 applications 22 accounted for 10% of the revenues. The pie is shared 20 with a larger number of applications in terms of free downloads, 10% of free downloads were generated 11 8 7 by 31 apps. Moreover, in the Apple App Store for iPad 6 4 and Google Play these figures are lower, i.e., the NA concentration of downloads and revenues towards a few top applications is lower. Top 10 Most Grossing Cross-Store Publishers Among 20 of the Largest Countries (Apple App Store & Google Play) Available Total Apps (iPad / App publisher In iPhone / Play) Popular app example Electronic Arts Both 126/266/62 Tetris Zynga Both 31/44/20 Words With Friends Gameloft Both 105/198/65 UNO Apple Apple 6/7/0 iMovie GREE, Inc. Both 11/96/122 Monster Quest Playtika LTD Both 4/3/1 Slotomania TeamLava Both 26/26/22 Bubble Mania Rovio Entertainment Ltd Both 14/17/13 Bad Piggies Backflip Studios Both 31/36/10 DragonVale Supercell Apple 2/2/0 Clash of Clans Distimo ©2012, some rights reserved. All trademarks are the property of their respective owners.
  • 8.
    Publication - Year2012 Our 2012 year-end publication showcases a couple of success stories, but many other publishers and applications that were also very successful over the past year were not discussed. Among the top 10 highest grossing cross-store publishers on the previous page, nine of the publishers are gaming companies. Only Apple is in the top 10 while only publishing in one app store. Another single app store publishing publisher in this list is Supercell. Supercell is a relatively new gaming company that has only published two games to date: Clash of Clans and Hayday, which are specifically aimed at the tablet market. Their two applications have dominated the top grossing lists for quite some time, and Supercell is among the top 10 highest grossing cross-store publishers in 2012. In contrast, Electronic Arts is available in both app stores with many applications. For each specific store on the next two pages the top publishers and top applications by downloads is given. If you need more specific information about how popular certain applications and publishers are, we have paid reports available that contain the top 300 most popular applications and publishers per region including their full downloads and revenues in 2012. Recap We dove into the current state of the Apple App Store and Google Play in our 2012 Year in Review report, and looked at how both stores developed over the past year. We also highlighted the success stories of a couple of new publishers that became incredibly successful in 2012 including, Naver, Supercell and Minecraft. Naver, the publisher of the messaging app Line amongst others, launched one application – Line Pop – that was estimated to have generated one million downloads in just one day. Google Play is just starting to rival the Apple App Store in a few countries on a worldwide scale, even though it is still losing in terms of daily revenues. Although Google Play shows promise and had much higher growth figures than the Apple App Store, the total daily revenue in Google Play was still lower than the absolute growth in the Apple App Store. Lastly, this publication details the 2012 winners, with a cross-store publisher list that includes known names like Apple, Electronic Arts and Rovio, but also contains relatively new publishers like Supercell. A top 10 publisher and top 10 applications list for both the Apple App Store and Google Play is available. Now Available (from €4,899): the full year report on 2012 Trend analyses with download & revenue estimations used in this publication. Top Apps & Pubs with download & revenue estimations covering full year 2012. Learn More Basically, all the intel you need to compete in the app store market delivered in one comprehensive excel report. Distimo ©2012, some rights reserved. All trademarks are the property of their respective owners.
  • 9.
    Publication - Year2012 Top 10 Publishers By Downloads In Apple App Store In 2012 Total apps Avg. price App publisher (iPad / iPhone) paid apps Popular app example Apple 6/7 $7.43 GarageBand Gameloft 105/198 $5.32 Modern Combat 4 Google, Inc. 12/23 - YouTube Disney 144/131 $3.18 Cars 2 Electronic Arts 126/266 $3.21 The Simpsons Out Fit 7 Ltd. 31/33 $1.75 Talking Tom Cat Rovio Entertainment Ltd 14/17 $2.10 Angry Birds: Star Wars Tencent Technology 21/64 - WeChat Chillingo Ltd 212/347 $1.84 Parking Mania Zynga 31/44 $2.75 Respawnables Top 10 Applications By Downloads In Apple App Store In 2012 Instagram 1 Draw Something Free 6 Temple Run 2 iTunes U 7 Find My iPhone 3 YouTube 8 Facebook 4 Podcasts 9 iBooks 5 Twitter 10 Distimo ©2012, some rights reserved. All trademarks are the property of their respective owners.
  • 10.
    Publication - Year2012 Top 10 Publishers By Downloads* In Google Play In 2012 Total Avg. price App publisher apps paid apps Popular app example Google, Inc. 60 - Google Translate Facebook 2 - Facebook Messenger Rovio Mobile Ltd. 13 $2.29 Angry Birds Star Wars Go Dev Team 135 - GO SMS Pro Adobe Systems 31 $10.00 Adobe Reader Kakoa 4 - KakaoStory YouTube 1 - YouTube Runner Games 12 - Basketball Shoot NHN Corporation 119 $1.28 네이버 - Naver Skype 4 - Skype Top 10 Applications By Downloads* In Google Play In 2012 Street View 1 YouTube 6 Facebook 2 Adobe Flash Player 7 Voice Search 3 Skype 8 Maps 4 Whatsapp Messenger 9 Gmail 5 KakoaTalk 10 * Downloads include pre-installs Distimo ©2012, some rights reserved. All trademarks are the property of their respective owners.
  • 11.
    Publication - Year2012 Visit our webinar on the publication 2012 Year In Review on thursday the 3rd of January @ 05.00PM CET (08.00AM PST) Register here! Distimo ©2012, some rights reserved. All trademarks are the property of their respective owners.
  • 12.
    Publication - Year2012 Track daily downloads and revenues of any app with Distimo AppIQ Distimo AppIQ allows users to: • Track and compare app downloads and competitor app downloads: Analyze an app’s market share and compare download figures versus a competitor’s in one chart. The chart shows the daily downloads and can also be aggregated per week or month. Events such as price changes, featured listings and version updates are also included, and allow the user to analyze the influence of each event on downloads. • Analyze competing app revenues including those from in-app purchases: View daily revenues from competing apps side-by-side with the their own app and get extensive insight into the revenue generation of different business models, revenue per country, and platform. • Identify the most popular and upcoming new apps: The Leaderboard provides the daily rankings of all applications, and can be viewed by app store, country, category, device, and free/paid/gross. All of the major app stores are supported, and for iOS and Android, the daily volumes per individual app are also provided. AppIQ users see the daily downloads and revenue from in-app purchases and one-off fees. Developers can also use the Leaderboard to see how many downloads are needed to achieve a certain ranking on any given day. Learn more about AppIQ at www.distimo.com/app-analytics/appiq. Distimo ©2012, some rights reserved. All trademarks are the property of their respective owners.
  • 13.
    Publication - Year2012 Contact us For sales inquiries, please contact Remco van den Elzen, VP Business Development at remco@distimo.com or call +31 30 82 00 567. For press inquiries please contact Mindy M. Hull at mindy@mercuryglobalpartners.com or call +31 62 504 7680 (EU) or +1 415 889 9977 (USA). Disclaimer This work is licensed under Creative Commons License “Attribution Noncommercial-Share Alike 3.0 Netherlands”. This license is available for download at http://creativecommons.org/licenses/by-nc-sa/3.0/nl/. This license ables you to use, copy, spread, and build upon this work non-commercially, as long as you credit Distimo and license your new creations under the identical terms. Distimo ©2012, some rights reserved. All trademarks are the property of their respective owners.