This dissertation examines third-party public reporting on healthcare quality in Ontario, Canada. Through a mixed-methods study, the researcher assessed current public reporting and identified opportunities to improve its effectiveness for quality improvement. The quantitative analysis found performance improved for one-third of publicly reported measures. Where reporting was combined with other accountability mechanisms, greater improvement was seen. However, there is insufficient evidence public reporting alone improves quality. Qualitative interviews with key informants identified ways to strengthen reporting's impact, such as bundling it with incentives. In conclusion, public reporting can be effective when combined with other improvement strategies.


![2
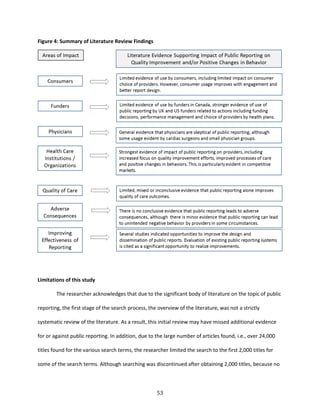
(Marshall et al., 2004). In recent years, voices of opposition have faded, replaced with more thoughtful
dialogue on how best to publish information in a way that engages the various audiences, maximizes the
benefits of public disclosure, and minimizes the potential for adverse consequences (Marshall and
Romano, 2005). In other words, now the most important question to ask about public reporting is not
whether it should be done but, rather, how it can be done more effectively (Wallace et al., 2007).
For the purposes of this paper, the definition used for public reporting comes from Totten et al.
(2012), “Public reporting is data, publicly available or available to a broad audience free of charge or at a
nominal cost, about a health care structure, process, or outcome at any provider level (individual
clinician, group, or organizations [e.g., hospitals, nursing facilities]) or at the health plan level” (Totten et
al., 2012). Additional definitions used in this dissertation are included in Appendix A.
Public reports are standardized ways within a reporting organization or at an aggregated health
system-level to present measures of the quality of health care and facilitate comparison of performance
over time, among providers, and against defined standards of good practice (Marshall et al., 2000).
Public reports are often produced in the form of “report cards,” “performance reports”, “consumer
reports”, “dashboards”, or “quality reports”, among other titles, and generally include a combination of
structural quality measures, such as number of specialists or number of beds; process measures, such as
preventative screening rates; and outcome measures, such as in-patient mortality or patient satisfaction
(Marshall et al., 2000).
Public reporting of health information for this level of assessment is not a new concept. Early
forays into public reporting in the U.S. began in the 1980s and report cards (also known as ‘league
tables’) have been available in the U.K. for several decades (Marshall et al., 2003). The rationale for
public reporting, like the process of public reporting itself, has evolved. Originally, stimulus for the
publication of performance information primarily came from government and from the ideological belief
that this would make public services more accountable for the outcome(s) they deliver, as well as to](https://image.slidesharecdn.com/7d82d755-0c46-4139-9fe9-377594c67784-160325185628/85/dissertation-0316-final-AW-15-320.jpg)
![32
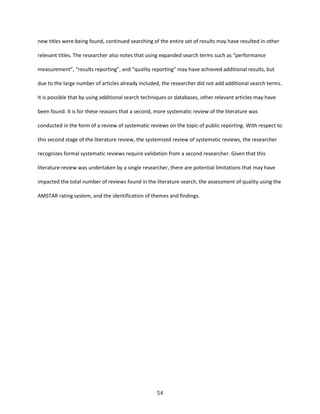
search to two databases i) the Cochrane Database of Systematic Reviews and ii) PubMed, which was the
primary search database for the researcher’s earlier review of individual studies.
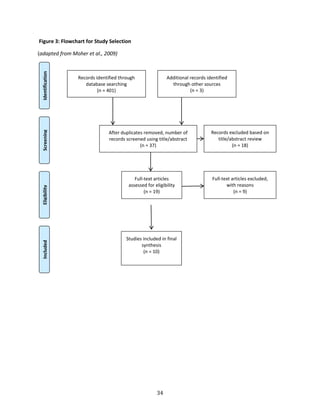
In order to provide a comprehensive search of articles related to this topic, the author identified
fourteen related terms for public reporting from MeSH [mh] terms used in the articles obtained from
the first search. With the assistance of a librarian at the University of North Carolina Health Sciences
Library, the researcher created a search string for a title and abstract [tiab] search, including all of the
fourteen related terms for public reporting as shown below:
"systematic review"[tiab] OR “systematic reviews”[tiab] OR "literature review"[tiab] OR “review
of the literature”[tiab]) AND "truth disclosure"[mh] OR "public release"[tiab] OR "public
disclosure"[tiab] OR "public reporting"[tiab] OR "publicly reported"[tiab] OR “performance
report”[tiab] OR “performance reports” [tiab] OR “performance reporting”[tiab] OR
“performance indicator”[tiab] OR “performance indicators”[tiab] OR “performance
measure”[tiab] OR “performance data”[tiab] OR “report cards”[tiab] OR “medical
registries”[tiab]
Inclusion criteria
The following criteria were used to identify articles for inclusion in the review:
English language and,
systematic reviews that:
o focus on public reporting as opposed to performance reporting that is not made public, as
well as that provide comparisons of public reporting with other types of reporting, and,
o (building on the preliminary overview of the literature) include articles with empirical
evidence on the value, non-value, or negative impact of public reporting on consumer
choice, physician behavior, provider behavior, purchaser/funder behavior, adverse
consequences, or quality of care/outcomes, as well as that identify ways to improve the
effectiveness of public reporting and,](https://image.slidesharecdn.com/7d82d755-0c46-4139-9fe9-377594c67784-160325185628/85/dissertation-0316-final-AW-45-320.jpg)


![166
term care homes, and home care agencies that are responsible for the provision of direct care to a
group of patients. Physicians are excluded from this definition and are defined separately above.
Public Reporting/Reports – “Public reporting is data, publicly available or available to a broad audience
free of charge or at a nominal cost, about a health care structure, process, or outcome at any provider
level (individual clinician, group, or organizations [e.g., hospitals, nursing facilities]) or at the health plan
level” (Totten et al., 2012). Public reports are standardized ways to present measures of quality of care
and facilitate comparison of performance over time, among providers, and against defined standards of
good practice (Marshall et al., 2000). Public reports are often produced in the form of “report cards,”
“provider profiles”, “consumer reports”, “league tables”, “dashboards”, or “quality reports” (among
other titles) and generally include a combination of structural quality measures (such as number of
specialists, qualifications), process measures (such as preventative screening rates), and outcome
measures (such as in-patient mortality, patient satisfaction) (Marshall et al., 2000). For the purposes of
this paper, other types of measures, such as financial, are excluded from this research on public
reporting. Public reporting can be either in the form of reports that are made publicly available or
reporting specifically designed with the public in mind; however, for the purposes of this research, the
researcher has focused on reports that are made publicly available.
Purchasers/funders – The bodies that purchase health care services on behalf of patients and generally
drive public reporting efforts. In jurisdictions with private health care funding, these bodies may be
employer health plans or insurance companies. In jurisdictions with publicly-funded or universal health
coverage, these bodies are generally associated with government.
Quality – Throughout this paper the term quality, as used in the phrase “public reporting on quality”,
references measures that are used to assess or quantify health care outcomes, access to care, patient
safety, patient experience, and other processes or systems associated with the capacity or ability to
provide quality health care. Quality measures generally include a combination of structural quality](https://image.slidesharecdn.com/7d82d755-0c46-4139-9fe9-377594c67784-160325185628/85/dissertation-0316-final-AW-179-320.jpg)


![209
APPENDIX H: RECRUITMENT LETTER FOR KEY INFORMANTS
[Date]
Dear [insert name],
I am writing to request your participation in a study I am undertaking on evaluating the effectiveness of
Ontario’s public reporting strategy for health performance measures. In addition to my role at the
Toronto Central CCAC, I am also a doctoral candidate at the University of North Carolina in the Gillings
School of Global Public Health. I will be interviewing key informants with expertise in public reporting as
part of my doctoral research. Your participation in the study would involve discussing your opinions on
the goals, effectiveness, challenges and opportunities to improve Ontario’s public reporting efforts. The
interview would take place at a time and location convenient for you and will last about 45-60 minutes.
Background
Over the last few years in Ontario, there has been a significant increase in public reporting of health
information, including a growing body of reports on health system performance and a range of report
cards for hospitals and other providers. The capacity to evaluate and report on quality is widely
regarded as a critical foundation for system-wide improvement of health care delivery and patient
outcomes.
Given that there is every indication that expectations for greater transparency and reporting of health
information will continue to increase, it is important for us to understand how to make public reporting
more effective. Evidence from the literature shows that evaluation of public reporting systems is
insufficient and evaluation of the impact of public reports has not kept pace with the development of
reporting systems.
The purpose of this study is to learn more about the objectives and impact of Ontario’s third-party
public reporting on health performance and to identify factors that will assist in evaluating its
effectiveness. The goal is to produce information on improving the effectiveness of public reporting that
will be helpful to policy-makers and organizations responsible for public reporting of health information.
Disclosure and Protection of Your Privacy
The interview will be completely confidential, and your name will not be connected to your responses in
any way. Any information that you provide will be aggregated with that of other participants.
Information from the interview will be stored in a secure location and destroyed upon completion of
this study. In order to establish credibility of the study I would like to list the names of participants in
the final report, however your decision to be listed is voluntary.](https://image.slidesharecdn.com/7d82d755-0c46-4139-9fe9-377594c67784-160325185628/85/dissertation-0316-final-AW-222-320.jpg)


![224
Schauffler HH, Mordavsky JK. Consumer reports in health care: do they make a difference? Annu Rev
Public Health. 2001;22(1):69-89.
Schlesinger M, Kanouse DE, Martino SC, Shaller D, Rybowski L. Complexity, public reporting, and choice
of doctors: a look inside the blackest box of consumer behavior. Med Care Res Rev. 2013.
Schneider E, Lieberman T. Publicly disclosed information about the quality of health care: response of
the US public. Qual Health Care. 2001;10(2):96-103.
Shaller D, Kanouse DE, M, Schlesinger M. Context-based strategies for engaging consumers with public
reports about health care providers. Med Care Res Rev. 2014;71(5 Suppl):17S-37S.
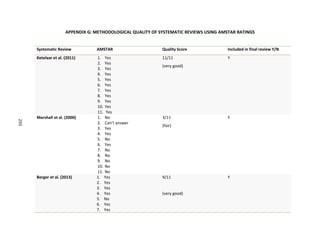
Shea BJ, Hamel C, Wells GA, Bouter LM, Kristjansson E, Grimshaw J, Henry DA, Boers M. AMSTAR is a
reliable and valid measurement tool to assess the methodological quality of systematic reviews. J Clin
Epidemiol. 2009 Oct; 62(10):1013-20.
Shekelle PG, Lim YW, Mattke S, Damberg C: Does public release of performance results improve quality
of care? A systematic review. London. [http:/www.health.org.uk/publications/does-public-release-of-
performance-results-improve-quality-of-care] The Health Foundation 2008
Sherman KL, Gordon EJ, Mahvi DM, et al. Surgeons' perceptions of public reporting of hospital and
individual surgeon quality. Med Care. 2013;51(12):1069-1075.
Smith R. Is the NHS getting better or worse? We need better data to answer the question. BMJ.
2003;327(7426):1239.
Smith V, Devane D, Begley CM, Clarke M. Methodology in conducting a systematic review of systematic
reviews of healthcare interventions. BMC Med Res Methodol. 2011;11(1):15.
Specchia ML, Veneziano MA, Cadeddu C, Ferriero AM, Capizzi S, Ricciardi W. Peer pressure and public
reporting within healthcare setting: improving accountability and health care quality in hospitals. Ig
Sanita Pubbl. 2012;68(6):771-780.
Suchy K. A lack of standardization: the basis for the ethical issues surrounding quality and performance
reports. J Healthc Manag. 2010 Jul-Aug;55(4):241-51.
State of New South Wales. Special Commission of Inquiry. Final Report of the Special Commission of
Inquiry: Acute Care in NSW Public Hospitals – Volume 2. New South Wales; 2008.
Tehrani DM, Russell D, Brown J, et al. Discord among performance measures for central line–associated
bloodstream infection. Infect Control Hosp Epidemiol. 2013;34(2):176-183.
The Change Foundation. Healthcare reform in the NHS England: More lessons for Ontario. March 2013.
Totten AM, Miake-Lye IM, Vaiana ME, Beroes JM, Shekelle PG. Public presentation of health system or
facility data about Quality and Safety: A systematic review. VA-ESP Project #05-226; 2011](https://image.slidesharecdn.com/7d82d755-0c46-4139-9fe9-377594c67784-160325185628/85/dissertation-0316-final-AW-237-320.jpg)