SlideShare a Scribd company logo
1 of 74
Is your question a question of:
Difference? Relationship?
Goodness of Fit?Independence?
Is your question a question of: Difference?
Difference
How do two or more groups compare with one another in
terms of some outcome?
Difference
How do two or more groups (younger/older drivers) compare
with one another in terms of some outcome (average driving
speed)?
Difference
How do two or more groups (younger/older drivers) compare
with one another in terms of some outcome (average driving
speed)?
vs.
average MPHolder driver younger driver
in terms of
Difference
How do two or more groups (those with migraines / those
without migraines) compare with one another in terms of
some outcome (average sugar intake)?
vs.
migraine no migraine
average sugar
intake
in terms of
Difference
How do two or more groups (sophomores/juniors/seniors)
compare with one another in terms of some outcome
(average amount of homework)?
sophomore
vs.
average amount
of homework
in terms of
junior senior
vs.
In summary
Difference
How do two or more groups compare with one another in
terms of some outcome?
vs.
vs.
migraine no migraine
average MPHolder driver younger driver
average sugar
intake
in terms of
in terms of
sophomore
vs.
average amount
Of homework
in terms of
junior senior
vs.
Is your question a question of: Relationship?
Relationship
Is a change in one characteristic accompanied by a change in
another characteristic?
Relationship
Is a change in one characteristic (age) accompanied by a
change in another characteristic (flexibility)?
Relationship
Is a change in one characteristic (age) accompanied by a
change in another characteristic (flexibility)?
Is an increase in accompanied by a decrease in
Relationship
Is a change in one characteristic (height) accompanied by a
change in another characteristic (weight)?
Is an increase in accompanied by a increase in
Relationship
Is a change in one characteristic (speed) accompanied by a
change in another characteristic (road rage incidents)?
Is an decrease in accompanied by a decrease in
In summary
Relationship
Is a change in one characteristic accompanied by a change in
another characteristic?
Is an increase in accompanied by a decrease in
Is an increase in accompanied by a increase in
Is an decrease in accompanied by a decrease in
Is your question a question of: Independence?
Independence
Is one variable with two or more levels independent of
another variable with two or more levels?
Independence
Is one variable (university enrollment) with two or more levels
(enrolled or not enrolled) independent of another variable
(state residence) with two or more levels (resident or not)?
Example 1 – Independent
Independence
Is one variable (university enrollment) with two or more levels
(enrolled or not enrolled) independent of another variable
(state residence) with two or more levels (resident or not)?
enrolled not enrolled
resident 20 students 20 students
not a resident 20 students 20 students
Example 1 – Independent
Enrollment and state residence are
independent, because being a
resident or non resident doesn’t
make it more likely you are enrolled.
Independence
Is one variable (university enrollment) with two or more levels
(enrolled or not enrolled) independent of another variable
(state residence) with two or more levels (resident or not)?
enrolled not enrolled
resident 20 students 20 students
not a resident 20 students 20 students
enrolled not enrolled
resident 10 students 30 students
not a resident 30 students 10 students
Example 1 – Independent
Enrollment and state residence are
dependent, because being a non-
resident makes it more likely you are
enrolled.
Enrollment and state residence are
independent, because being a
resident or non resident doesn’t
make it more likely you are enrolled.
Example 2 - Dependent
Independence
Is one variable (university enrollment) with two or more levels
(enrolled or not enrolled) independent of another variable
(state residence) with two or more levels (resident or not)?
Independence
Is one variable (year in school) with two or more levels (9th,
10th, 11th, 12th) independent of another variable (foreign
language ability) of two or more levels (fluent or not)?
Independence
Is one variable (year in school) with two or more levels (9th,
10th, 11th, 12th) independent of another variable (foreign
language ability) of two or more levels (fluent or not)?
9th 10th 11th 12th
fluent 200 300 200 250
not fluent 200 300 200 250
Example 1 – Independent
Independence
Is one variable (year in school) with two or more levels (9th,
10th, 11th, 12th) independent of another variable (foreign
language ability) of two or more levels (fluent or not)?
9th 10th 11th 12th
fluent 200 300 200 250
not fluent 200 300 200 250
Example 1 – Independent
Fluency is independent of year in
school because being in a lower or
upper class doesn’t make it more
likely that you are fluent.
9th 10th 11th 12th
fluent 100 100 200 400
not fluent 300 400 100 100
Example 2 – Independent
Fluency is dependent on year in
school because being in an upper
class makes it more likely that you
are fluent.
In summary
Independence
Is one variable with two or more levels independent of
another variable with two or more levels?
Independence
Is one variable with two or more levels independent of
another variable with two or more levels?
enrolled not enrolled
resident 20 students 20 students
not a resident 20 students 20 students
Is university enrollment
independent of state residency?
Independence
Is one variable with two or more levels independent of
another variable with two or more levels?
9th 10th 11th 12th
fluent 200 300 200 250
not fluent 200 300 200 250
enrolled not enrolled
resident 20 students 20 students
not a resident 20 students 20 students
Is university enrollment
independent of state residency?
Is year in school independent
foreign language fluency?
Is your question a question of: Goodness of Fit?
Goodness of Fit
Does your claim fit reality?
(4 out of 5 dentist recommend flavored floss) (3 out of 5 of
your dentist friends recommend flavored floss)
Goodness of Fit
Does your claim (4 out of 5 dentist recommend flavored floss)
fit reality (3 out of 5 of your dentist friends recommend
flavored floss)?
Goodness of Fit
Does your claim (4 out of 5 dentist recommend flavored floss)
fit reality (3 out of 5 of your dentist friends recommend
flavored floss)?
Does the CLAIM . . . FIT REALITY?
4 out of 5
recommend
3 out of 5
recommend
Goodness of Fit
Does your claim (72% of the county will vote democrat) fit
reality (65% of the county actually voted democrat)?
Does the CLAIM . . . FIT REALITY?
65% 72%
18%35%
In summary
Goodness of Fit
Does your claim fit reality?
(4 out of 5 dentist recommend flavored floss) (3 out of 5 of
your dentist friends recommend flavored floss)
Goodness of Fit
Does your claim fit reality?
(4 out of 5 dentist recommend flavored floss) (3 out of 5 of
your dentist friends recommend flavored floss)
4 out of 5
recommend
3 out of 5
recommend
65% 72%
18%35%
The Claim The Reality
Final Summary
Final Summary
Difference – (average) between groups. vs.
Relationship – increase or decrease in two variables
Independence – two+ levels by two+ levels.
Does the CLAIM . . . FIT REALITY?
Goodness of Fit – claim versus reality
Let’s Practice!
Does employee moral increase significantly the
longer employees work at Company X? You
sample a group of 45 and generalize the results.
Difference? Relationship?
Independence? Goodness of Fit?
Does employee moral increase significantly the
longer employees work at Company X? You
sample a group of 45 and generalize the results.
Difference? Relationship?
Independence? Goodness of Fit?
Does employee moral increase significantly the
longer employees work at Company X? You
sample a group of 45 and generalize the results.
Difference? Relationship?
Independence? Goodness of Fit?
Does employee moral increase significantly the
longer employees work at Company X? You
sample a group of 45 and generalize the results.
Is a change in one characteristic (moral) accompanied by a
change in another characteristic (time worked)?
Difference? Relationship?
Independence? Goodness of Fit?
Next Example
How do management and staff compare in
terms of average work satisfaction? You sample
both groups and generalize the results.
Difference? Relationship?
Independence? Goodness of Fit?
How do management and staff compare in
terms of average work satisfaction? You sample
both groups and generalize the results.
Difference? Relationship?
Independence? Goodness of Fit?
How do management and staff compare in
terms of average work satisfaction? You sample
both groups and generalize the results.
Difference? Relationship?
Independence? Goodness of Fit?
How do management and staff compare in
terms of average work satisfaction? You sample
both groups and generalize the results.
Difference? Relationship?
Independence? Goodness of Fit?
How do two or more groups (management/staff) compare
with one another in terms of some outcome (average work
satisfaction)?
Next Example
A salesman claims that 95% of employees
increase their work productivity using his
software. You test that claim with a sample of 26
employees and find that 86% increase their
productivity.
Difference? Relationship?
Independence? Goodness of Fit?
A salesman claims that 95% of employees
increase their work productivity using his
software. You test that claim with a sample of 26
employees and find that 86% increase their
productivity.
Difference? Relationship?
Independence? Goodness of Fit?
A salesman claims that 95% of employees
increase their work productivity using his
software. You test that claim with a sample of
26 employees and find that 86% increase their
productivity.
Difference? Relationship?
Independence? Goodness of Fit?
A salesman claims that 95% of employees
increase their work productivity using his
software. You test that claim with a sample of
26 employees and find that 86% increase their
productivity.
Difference? Relationship?
Independence? Goodness of Fit?
Does your claim (95% increase work productivity) fit reality
(86% increase work productivity)?
Is religious affiliation independent of age levels
(young, prime, mature, and seasoned)?
Difference? Relationship?
Independence? Goodness of Fit?
Is religious affiliation independent of age levels
(young, prime, mature, and seasoned)?
Difference? Relationship?
Independence? Goodness of Fit?
Is religious affiliation independent of age levels
(young, prime, mature, and seasoned)?
Difference? Relationship?
Independence? Goodness of Fit?
Is religious affiliation independent of age levels
(young, prime, mature, and seasoned)?
Difference? Relationship?
Independence? Goodness of Fit?
Is one variable with two or more levels (religious affiliation)
independent of another variable with two or more levels
(age levels)?
Important Note
Of the 24 statistical methods you will learn in
this course, 6 are descriptive and 18 are
inferential.
Of the 24 statistical methods you will learn in
this course, 6 are descriptive and 18 are
inferential.
Mean Median Mode Range Stdev IQR Single t Ind t
Paired t ANOVA ANCOVA F-ANOV RM Split Pearson Partial
Point-B Phi Spearmn Kendall S-Linear M-Linear Chi-Ind Chi-Fit
Of the 24 statistical methods you will learn in
this course, 6 are descriptive and 18 are
inferential.
Mean Median Mode Range Stdev IQR Single t Ind t
Paired t ANOVA ANCOVA F-ANOV RM Split Pearson Partial
Point-B Phi Spearmn Kendall S-Linear M-Linear Chi-Ind Chi-Fit
Of the 24 statistical methods you will learn in
this course, 6 are descriptive and 18 are
inferential.
Mean Median Mode Range Stdev IQR Single t Ind t
Paired t ANOVA ANCOVA F-ANOV RM Split Pearson Partial
Point-B Phi Spearmn Kendall S-Linear M-Linear Chi-Ind Chi-Fit
Of the 24 statistical methods you will learn in
this course, 6 are descriptive and 18 are
inferential. Those 18 under inferential break
down further as follows:
Mean Median Mode Range Stdev IQR Single t Ind t
Paired t ANOVA ANCOVA F-ANOV RM Split Pearson Partial
Point-B Phi Spearmn Kendall S-Linear M-Linear Chi-Ind Chi-Fit
Difference? Relationship? Goodness of Fit?Independence?
Is your question a question of:
Difference? Relationship?
Goodness of Fit?Independence?

More Related Content

Similar to Diff rel-ind-fit practice

Rocky Mountain Prep Message Training
Rocky Mountain Prep Message TrainingRocky Mountain Prep Message Training
Rocky Mountain Prep Message Training
Megaphone Man
 
For each of the research questions below, identify the variables a.docx
For each of the research questions below, identify the variables a.docxFor each of the research questions below, identify the variables a.docx
For each of the research questions below, identify the variables a.docx
budbarber38650
 
12th Grade Senior Parent Night 2014
12th Grade Senior Parent Night 201412th Grade Senior Parent Night 2014
12th Grade Senior Parent Night 2014
Jenny Gildon
 

Similar to Diff rel-ind-fit practice (17)

How many independent variables (practice)
How many independent variables (practice)How many independent variables (practice)
How many independent variables (practice)
 
What Makes Charter Schools Effective?
What Makes Charter Schools Effective?What Makes Charter Schools Effective?
What Makes Charter Schools Effective?
 
How many dependent variables (practice)
How many dependent variables (practice)How many dependent variables (practice)
How many dependent variables (practice)
 
Nature of the data (Practice Problems)
Nature of the data (Practice Problems)Nature of the data (Practice Problems)
Nature of the data (Practice Problems)
 
The Achievement Gap
The Achievement GapThe Achievement Gap
The Achievement Gap
 
Rocky Mountain Prep Message Training
Rocky Mountain Prep Message TrainingRocky Mountain Prep Message Training
Rocky Mountain Prep Message Training
 
03_Variables.pptx
03_Variables.pptx03_Variables.pptx
03_Variables.pptx
 
$320,000 Kindergarten Teachers
$320,000 Kindergarten Teachers$320,000 Kindergarten Teachers
$320,000 Kindergarten Teachers
 
For each of the research questions below, identify the variables a.docx
For each of the research questions below, identify the variables a.docxFor each of the research questions below, identify the variables a.docx
For each of the research questions below, identify the variables a.docx
 
Inferring or describing - practice problems
Inferring or describing -  practice problemsInferring or describing -  practice problems
Inferring or describing - practice problems
 
Private Schools in India: More Learning, More Inequality
Private Schools in India: More Learning, More InequalityPrivate Schools in India: More Learning, More Inequality
Private Schools in India: More Learning, More Inequality
 
The High Cost of Low Educational Performance
The High Cost of Low Educational PerformanceThe High Cost of Low Educational Performance
The High Cost of Low Educational Performance
 
Difference relationship independence goodness of fit (practice)
Difference relationship independence goodness of fit (practice)Difference relationship independence goodness of fit (practice)
Difference relationship independence goodness of fit (practice)
 
Higher Education Attitudes Survey
Higher Education Attitudes SurveyHigher Education Attitudes Survey
Higher Education Attitudes Survey
 
INTERPRETING MEASURE OF POSITION.pptx
INTERPRETING MEASURE OF POSITION.pptxINTERPRETING MEASURE OF POSITION.pptx
INTERPRETING MEASURE OF POSITION.pptx
 
Geneticschapter1 140126121555-phpapp02
Geneticschapter1 140126121555-phpapp02Geneticschapter1 140126121555-phpapp02
Geneticschapter1 140126121555-phpapp02
 
12th Grade Senior Parent Night 2014
12th Grade Senior Parent Night 201412th Grade Senior Parent Night 2014
12th Grade Senior Parent Night 2014
 

More from Ken Plummer

More from Ken Plummer (20)

Diff rel gof-fit - jejit - practice (5)
Diff rel gof-fit - jejit - practice (5)Diff rel gof-fit - jejit - practice (5)
Diff rel gof-fit - jejit - practice (5)
 
Learn About Range - Copyright updated
Learn About Range - Copyright updatedLearn About Range - Copyright updated
Learn About Range - Copyright updated
 
Inferential vs descriptive tutorial of when to use - Copyright Updated
Inferential vs descriptive tutorial of when to use - Copyright UpdatedInferential vs descriptive tutorial of when to use - Copyright Updated
Inferential vs descriptive tutorial of when to use - Copyright Updated
 
Normal or skewed distributions (inferential) - Copyright updated
Normal or skewed distributions (inferential) - Copyright updatedNormal or skewed distributions (inferential) - Copyright updated
Normal or skewed distributions (inferential) - Copyright updated
 
Normal or skewed distributions (descriptive both2) - Copyright updated
Normal or skewed distributions (descriptive both2) - Copyright updatedNormal or skewed distributions (descriptive both2) - Copyright updated
Normal or skewed distributions (descriptive both2) - Copyright updated
 
Nature of the data practice - Copyright updated
Nature of the data practice - Copyright updatedNature of the data practice - Copyright updated
Nature of the data practice - Copyright updated
 
Mode practice 1 - Copyright updated
Mode practice 1 - Copyright updatedMode practice 1 - Copyright updated
Mode practice 1 - Copyright updated
 
Nature of the data (descriptive) - Copyright updated
Nature of the data (descriptive) - Copyright updatedNature of the data (descriptive) - Copyright updated
Nature of the data (descriptive) - Copyright updated
 
Skewed less than 30 (ties)
Skewed less than 30 (ties)Skewed less than 30 (ties)
Skewed less than 30 (ties)
 
Skewed sample size less than 30
Skewed sample size less than 30Skewed sample size less than 30
Skewed sample size less than 30
 
Ordinal (ties)
Ordinal (ties)Ordinal (ties)
Ordinal (ties)
 
Relationship covariates
Relationship   covariatesRelationship   covariates
Relationship covariates
 
Number of variables (predictive)
Number of variables (predictive)Number of variables (predictive)
Number of variables (predictive)
 
Levels of the iv
Levels of the ivLevels of the iv
Levels of the iv
 
Dependent variable je jit - practice
Dependent variable   je jit - practiceDependent variable   je jit - practice
Dependent variable je jit - practice
 
Predictive or arbitrary
Predictive or arbitraryPredictive or arbitrary
Predictive or arbitrary
 
Nature of the data (descriptive)
Nature of the data (descriptive)Nature of the data (descriptive)
Nature of the data (descriptive)
 
Independent samples t test - run, select, interpret
Independent samples t test - run, select, interpretIndependent samples t test - run, select, interpret
Independent samples t test - run, select, interpret
 
Iq range select - run - interpret
Iq range   select - run - interpretIq range   select - run - interpret
Iq range select - run - interpret
 
Range select - run - interpret
Range   select - run - interpretRange   select - run - interpret
Range select - run - interpret
 

Recently uploaded

Making and Justifying Mathematical Decisions.pdf
Making and Justifying Mathematical Decisions.pdfMaking and Justifying Mathematical Decisions.pdf
Making and Justifying Mathematical Decisions.pdf
Chris Hunter
 
An Overview of Mutual Funds Bcom Project.pdf
An Overview of Mutual Funds Bcom Project.pdfAn Overview of Mutual Funds Bcom Project.pdf
An Overview of Mutual Funds Bcom Project.pdf
SanaAli374401
 
Russian Escort Service in Delhi 11k Hotel Foreigner Russian Call Girls in Delhi
Russian Escort Service in Delhi 11k Hotel Foreigner Russian Call Girls in DelhiRussian Escort Service in Delhi 11k Hotel Foreigner Russian Call Girls in Delhi
Russian Escort Service in Delhi 11k Hotel Foreigner Russian Call Girls in Delhi
kauryashika82
 

Recently uploaded (20)

SOCIAL AND HISTORICAL CONTEXT - LFTVD.pptx
SOCIAL AND HISTORICAL CONTEXT - LFTVD.pptxSOCIAL AND HISTORICAL CONTEXT - LFTVD.pptx
SOCIAL AND HISTORICAL CONTEXT - LFTVD.pptx
 
Class 11th Physics NEET formula sheet pdf
Class 11th Physics NEET formula sheet pdfClass 11th Physics NEET formula sheet pdf
Class 11th Physics NEET formula sheet pdf
 
This PowerPoint helps students to consider the concept of infinity.
This PowerPoint helps students to consider the concept of infinity.This PowerPoint helps students to consider the concept of infinity.
This PowerPoint helps students to consider the concept of infinity.
 
Presentation by Andreas Schleicher Tackling the School Absenteeism Crisis 30 ...
Presentation by Andreas Schleicher Tackling the School Absenteeism Crisis 30 ...Presentation by Andreas Schleicher Tackling the School Absenteeism Crisis 30 ...
Presentation by Andreas Schleicher Tackling the School Absenteeism Crisis 30 ...
 
Making and Justifying Mathematical Decisions.pdf
Making and Justifying Mathematical Decisions.pdfMaking and Justifying Mathematical Decisions.pdf
Making and Justifying Mathematical Decisions.pdf
 
Web & Social Media Analytics Previous Year Question Paper.pdf
Web & Social Media Analytics Previous Year Question Paper.pdfWeb & Social Media Analytics Previous Year Question Paper.pdf
Web & Social Media Analytics Previous Year Question Paper.pdf
 
An Overview of Mutual Funds Bcom Project.pdf
An Overview of Mutual Funds Bcom Project.pdfAn Overview of Mutual Funds Bcom Project.pdf
An Overview of Mutual Funds Bcom Project.pdf
 
microwave assisted reaction. General introduction
microwave assisted reaction. General introductionmicrowave assisted reaction. General introduction
microwave assisted reaction. General introduction
 
Measures of Dispersion and Variability: Range, QD, AD and SD
Measures of Dispersion and Variability: Range, QD, AD and SDMeasures of Dispersion and Variability: Range, QD, AD and SD
Measures of Dispersion and Variability: Range, QD, AD and SD
 
Código Creativo y Arte de Software | Unidad 1
Código Creativo y Arte de Software | Unidad 1Código Creativo y Arte de Software | Unidad 1
Código Creativo y Arte de Software | Unidad 1
 
Sports & Fitness Value Added Course FY..
Sports & Fitness Value Added Course FY..Sports & Fitness Value Added Course FY..
Sports & Fitness Value Added Course FY..
 
Russian Escort Service in Delhi 11k Hotel Foreigner Russian Call Girls in Delhi
Russian Escort Service in Delhi 11k Hotel Foreigner Russian Call Girls in DelhiRussian Escort Service in Delhi 11k Hotel Foreigner Russian Call Girls in Delhi
Russian Escort Service in Delhi 11k Hotel Foreigner Russian Call Girls in Delhi
 
Ecological Succession. ( ECOSYSTEM, B. Pharmacy, 1st Year, Sem-II, Environmen...
Ecological Succession. ( ECOSYSTEM, B. Pharmacy, 1st Year, Sem-II, Environmen...Ecological Succession. ( ECOSYSTEM, B. Pharmacy, 1st Year, Sem-II, Environmen...
Ecological Succession. ( ECOSYSTEM, B. Pharmacy, 1st Year, Sem-II, Environmen...
 
Application orientated numerical on hev.ppt
Application orientated numerical on hev.pptApplication orientated numerical on hev.ppt
Application orientated numerical on hev.ppt
 
Paris 2024 Olympic Geographies - an activity
Paris 2024 Olympic Geographies - an activityParis 2024 Olympic Geographies - an activity
Paris 2024 Olympic Geographies - an activity
 
ICT Role in 21st Century Education & its Challenges.pptx
ICT Role in 21st Century Education & its Challenges.pptxICT Role in 21st Century Education & its Challenges.pptx
ICT Role in 21st Century Education & its Challenges.pptx
 
Key note speaker Neum_Admir Softic_ENG.pdf
Key note speaker Neum_Admir Softic_ENG.pdfKey note speaker Neum_Admir Softic_ENG.pdf
Key note speaker Neum_Admir Softic_ENG.pdf
 
PROCESS RECORDING FORMAT.docx
PROCESS      RECORDING        FORMAT.docxPROCESS      RECORDING        FORMAT.docx
PROCESS RECORDING FORMAT.docx
 
How to Give a Domain for a Field in Odoo 17
How to Give a Domain for a Field in Odoo 17How to Give a Domain for a Field in Odoo 17
How to Give a Domain for a Field in Odoo 17
 
fourth grading exam for kindergarten in writing
fourth grading exam for kindergarten in writingfourth grading exam for kindergarten in writing
fourth grading exam for kindergarten in writing
 

Diff rel-ind-fit practice

  • 1. Is your question a question of: Difference? Relationship? Goodness of Fit?Independence?
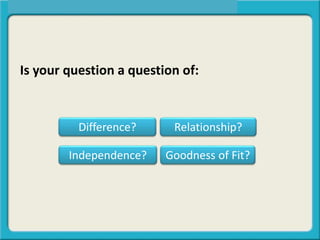
  • 2. Is your question a question of: Difference?
  • 3. Difference How do two or more groups compare with one another in terms of some outcome?
  • 4. Difference How do two or more groups (younger/older drivers) compare with one another in terms of some outcome (average driving speed)?
  • 5. Difference How do two or more groups (younger/older drivers) compare with one another in terms of some outcome (average driving speed)? vs. average MPHolder driver younger driver in terms of
  • 6. Difference How do two or more groups (those with migraines / those without migraines) compare with one another in terms of some outcome (average sugar intake)? vs. migraine no migraine average sugar intake in terms of
  • 7. Difference How do two or more groups (sophomores/juniors/seniors) compare with one another in terms of some outcome (average amount of homework)? sophomore vs. average amount of homework in terms of junior senior vs.
  • 9. Difference How do two or more groups compare with one another in terms of some outcome? vs. vs. migraine no migraine average MPHolder driver younger driver average sugar intake in terms of in terms of sophomore vs. average amount Of homework in terms of junior senior vs.
  • 10. Is your question a question of: Relationship?
  • 11. Relationship Is a change in one characteristic accompanied by a change in another characteristic?
  • 12. Relationship Is a change in one characteristic (age) accompanied by a change in another characteristic (flexibility)?
  • 13. Relationship Is a change in one characteristic (age) accompanied by a change in another characteristic (flexibility)? Is an increase in accompanied by a decrease in
  • 14. Relationship Is a change in one characteristic (height) accompanied by a change in another characteristic (weight)? Is an increase in accompanied by a increase in
  • 15. Relationship Is a change in one characteristic (speed) accompanied by a change in another characteristic (road rage incidents)? Is an decrease in accompanied by a decrease in
  • 17. Relationship Is a change in one characteristic accompanied by a change in another characteristic? Is an increase in accompanied by a decrease in Is an increase in accompanied by a increase in Is an decrease in accompanied by a decrease in
  • 18. Is your question a question of: Independence?
  • 19. Independence Is one variable with two or more levels independent of another variable with two or more levels?
  • 20. Independence Is one variable (university enrollment) with two or more levels (enrolled or not enrolled) independent of another variable (state residence) with two or more levels (resident or not)?
  • 21. Example 1 – Independent Independence Is one variable (university enrollment) with two or more levels (enrolled or not enrolled) independent of another variable (state residence) with two or more levels (resident or not)?
  • 22. enrolled not enrolled resident 20 students 20 students not a resident 20 students 20 students Example 1 – Independent Independence Is one variable (university enrollment) with two or more levels (enrolled or not enrolled) independent of another variable (state residence) with two or more levels (resident or not)?
  • 23. enrolled not enrolled resident 20 students 20 students not a resident 20 students 20 students Example 1 – Independent Enrollment and state residence are independent, because being a resident or non resident doesn’t make it more likely you are enrolled. Independence Is one variable (university enrollment) with two or more levels (enrolled or not enrolled) independent of another variable (state residence) with two or more levels (resident or not)?
  • 24. enrolled not enrolled resident 20 students 20 students not a resident 20 students 20 students enrolled not enrolled resident 10 students 30 students not a resident 30 students 10 students Example 1 – Independent Enrollment and state residence are dependent, because being a non- resident makes it more likely you are enrolled. Enrollment and state residence are independent, because being a resident or non resident doesn’t make it more likely you are enrolled. Example 2 - Dependent Independence Is one variable (university enrollment) with two or more levels (enrolled or not enrolled) independent of another variable (state residence) with two or more levels (resident or not)?
  • 25. Independence Is one variable (year in school) with two or more levels (9th, 10th, 11th, 12th) independent of another variable (foreign language ability) of two or more levels (fluent or not)?
  • 26. Independence Is one variable (year in school) with two or more levels (9th, 10th, 11th, 12th) independent of another variable (foreign language ability) of two or more levels (fluent or not)? 9th 10th 11th 12th fluent 200 300 200 250 not fluent 200 300 200 250 Example 1 – Independent
  • 27. Independence Is one variable (year in school) with two or more levels (9th, 10th, 11th, 12th) independent of another variable (foreign language ability) of two or more levels (fluent or not)? 9th 10th 11th 12th fluent 200 300 200 250 not fluent 200 300 200 250 Example 1 – Independent Fluency is independent of year in school because being in a lower or upper class doesn’t make it more likely that you are fluent.
  • 28. Independence Is one variable (year in school) with two or more levels (9th, 10th, 11th, 12th) independent of another variable (foreign language ability) of two or more levels (fluent or not)? 9th 10th 11th 12th fluent 200 300 200 250 not fluent 200 300 200 250 Example 1 – Independent Fluency is independent of year in school because being in a lower or upper class doesn’t make it more likely that you are fluent. 9th 10th 11th 12th fluent 100 100 200 400 not fluent 300 400 100 100 Example 2 – Independent
  • 29. Independence Is one variable (year in school) with two or more levels (9th, 10th, 11th, 12th) independent of another variable (foreign language ability) of two or more levels (fluent or not)? 9th 10th 11th 12th fluent 200 300 200 250 not fluent 200 300 200 250 Example 1 – Independent Fluency is independent of year in school because being in a lower or upper class doesn’t make it more likely that you are fluent. 9th 10th 11th 12th fluent 100 100 200 400 not fluent 300 400 100 100 Example 2 – Independent Fluency is dependent on year in school because being in an upper class makes it more likely that you are fluent.
  • 31. Independence Is one variable with two or more levels independent of another variable with two or more levels?
  • 32. Independence Is one variable with two or more levels independent of another variable with two or more levels? enrolled not enrolled resident 20 students 20 students not a resident 20 students 20 students Is university enrollment independent of state residency?
  • 33. Independence Is one variable with two or more levels independent of another variable with two or more levels? 9th 10th 11th 12th fluent 200 300 200 250 not fluent 200 300 200 250 enrolled not enrolled resident 20 students 20 students not a resident 20 students 20 students Is university enrollment independent of state residency? Is year in school independent foreign language fluency?
  • 34. Is your question a question of: Goodness of Fit?
  • 35. Goodness of Fit Does your claim fit reality? (4 out of 5 dentist recommend flavored floss) (3 out of 5 of your dentist friends recommend flavored floss)
  • 36. Goodness of Fit Does your claim (4 out of 5 dentist recommend flavored floss) fit reality (3 out of 5 of your dentist friends recommend flavored floss)?
  • 37. Goodness of Fit Does your claim (4 out of 5 dentist recommend flavored floss) fit reality (3 out of 5 of your dentist friends recommend flavored floss)? Does the CLAIM . . . FIT REALITY? 4 out of 5 recommend 3 out of 5 recommend
  • 38. Goodness of Fit Does your claim (72% of the county will vote democrat) fit reality (65% of the county actually voted democrat)? Does the CLAIM . . . FIT REALITY? 65% 72% 18%35%
  • 40. Goodness of Fit Does your claim fit reality? (4 out of 5 dentist recommend flavored floss) (3 out of 5 of your dentist friends recommend flavored floss)
  • 41. Goodness of Fit Does your claim fit reality? (4 out of 5 dentist recommend flavored floss) (3 out of 5 of your dentist friends recommend flavored floss) 4 out of 5 recommend 3 out of 5 recommend 65% 72% 18%35% The Claim The Reality The Claim The Reality
  • 43. Final Summary Difference – (average) between groups. vs. Relationship – increase or decrease in two variables Independence – two+ levels by two+ levels. Does the CLAIM . . . FIT REALITY? Goodness of Fit – claim versus reality
  • 45. Does employee moral increase significantly the longer employees work at Company X? You sample a group of 45 and generalize the results. Difference? Relationship? Independence? Goodness of Fit?
  • 46. Does employee moral increase significantly the longer employees work at Company X? You sample a group of 45 and generalize the results. Difference? Relationship? Independence? Goodness of Fit?
  • 47. Does employee moral increase significantly the longer employees work at Company X? You sample a group of 45 and generalize the results. Difference? Relationship? Independence? Goodness of Fit?
  • 48. Does employee moral increase significantly the longer employees work at Company X? You sample a group of 45 and generalize the results. Is a change in one characteristic (moral) accompanied by a change in another characteristic (time worked)? Difference? Relationship? Independence? Goodness of Fit?
  • 50. How do management and staff compare in terms of average work satisfaction? You sample both groups and generalize the results. Difference? Relationship? Independence? Goodness of Fit?
  • 51. How do management and staff compare in terms of average work satisfaction? You sample both groups and generalize the results. Difference? Relationship? Independence? Goodness of Fit?
  • 52. How do management and staff compare in terms of average work satisfaction? You sample both groups and generalize the results. Difference? Relationship? Independence? Goodness of Fit?
  • 53. How do management and staff compare in terms of average work satisfaction? You sample both groups and generalize the results. Difference? Relationship? Independence? Goodness of Fit? How do two or more groups (management/staff) compare with one another in terms of some outcome (average work satisfaction)?
  • 55. A salesman claims that 95% of employees increase their work productivity using his software. You test that claim with a sample of 26 employees and find that 86% increase their productivity. Difference? Relationship? Independence? Goodness of Fit?
  • 56. A salesman claims that 95% of employees increase their work productivity using his software. You test that claim with a sample of 26 employees and find that 86% increase their productivity. Difference? Relationship? Independence? Goodness of Fit?
  • 57. A salesman claims that 95% of employees increase their work productivity using his software. You test that claim with a sample of 26 employees and find that 86% increase their productivity. Difference? Relationship? Independence? Goodness of Fit?
  • 58. A salesman claims that 95% of employees increase their work productivity using his software. You test that claim with a sample of 26 employees and find that 86% increase their productivity. Difference? Relationship? Independence? Goodness of Fit? Does your claim (95% increase work productivity) fit reality (86% increase work productivity)?
  • 59. Is religious affiliation independent of age levels (young, prime, mature, and seasoned)? Difference? Relationship? Independence? Goodness of Fit?
  • 60. Is religious affiliation independent of age levels (young, prime, mature, and seasoned)? Difference? Relationship? Independence? Goodness of Fit?
  • 61. Is religious affiliation independent of age levels (young, prime, mature, and seasoned)? Difference? Relationship? Independence? Goodness of Fit?
  • 62. Is religious affiliation independent of age levels (young, prime, mature, and seasoned)? Difference? Relationship? Independence? Goodness of Fit? Is one variable with two or more levels (religious affiliation) independent of another variable with two or more levels (age levels)?
  • 64. Of the 24 statistical methods you will learn in this course, 6 are descriptive and 18 are inferential.
  • 65. Of the 24 statistical methods you will learn in this course, 6 are descriptive and 18 are inferential. Mean Median Mode Range Stdev IQR Single t Ind t Paired t ANOVA ANCOVA F-ANOV RM Split Pearson Partial Point-B Phi Spearmn Kendall S-Linear M-Linear Chi-Ind Chi-Fit
  • 66. Of the 24 statistical methods you will learn in this course, 6 are descriptive and 18 are inferential. Mean Median Mode Range Stdev IQR Single t Ind t Paired t ANOVA ANCOVA F-ANOV RM Split Pearson Partial Point-B Phi Spearmn Kendall S-Linear M-Linear Chi-Ind Chi-Fit
  • 67. Of the 24 statistical methods you will learn in this course, 6 are descriptive and 18 are inferential. Mean Median Mode Range Stdev IQR Single t Ind t Paired t ANOVA ANCOVA F-ANOV RM Split Pearson Partial Point-B Phi Spearmn Kendall S-Linear M-Linear Chi-Ind Chi-Fit
  • 68. Of the 24 statistical methods you will learn in this course, 6 are descriptive and 18 are inferential. Those 18 under inferential break down further as follows: Mean Median Mode Range Stdev IQR Single t Ind t Paired t ANOVA ANCOVA F-ANOV RM Split Pearson Partial Point-B Phi Spearmn Kendall S-Linear M-Linear Chi-Ind Chi-Fit
  • 69. Of the 24 statistical methods you will learn in this course, 6 are descriptive and 18 are inferential. Those 18 under inferential break down further as follows: Mean Median Mode Range Stdev IQR Single t Ind t Paired t ANOVA ANCOVA F-ANOV RM Split Pearson Partial Point-B Phi Spearmn Kendall S-Linear M-Linear Chi-Ind Chi-Fit Difference? Relationship? Goodness of Fit?Independence?
  • 70. Of the 24 statistical methods you will learn in this course, 6 are descriptive and 18 are inferential. Those 18 under inferential break down further as follows: Mean Median Mode Range Stdev IQR Single t Ind t Paired t ANOVA ANCOVA F-ANOV RM Split Pearson Partial Point-B Phi Spearmn Kendall S-Linear M-Linear Chi-Ind Chi-Fit Difference? Relationship? Goodness of Fit?Independence?
  • 71. Of the 24 statistical methods you will learn in this course, 6 are descriptive and 18 are inferential. Those 18 under inferential break down further as follows: Mean Median Mode Range Stdev IQR Single t Ind t Paired t ANOVA ANCOVA F-ANOV RM Split Pearson Partial Point-B Phi Spearmn Kendall S-Linear M-Linear Chi-Ind Chi-Fit Difference? Relationship? Goodness of Fit?Independence?
  • 72. Of the 24 statistical methods you will learn in this course, 6 are descriptive and 18 are inferential. Those 18 under inferential break down further as follows: Mean Median Mode Range Stdev IQR Single t Ind t Paired t ANOVA ANCOVA F-ANOV RM Split Pearson Partial Point-B Phi Spearmn Kendall S-Linear M-Linear Chi-Ind Chi-Fit Difference? Relationship? Goodness of Fit?Independence?
  • 73. Of the 24 statistical methods you will learn in this course, 6 are descriptive and 18 are inferential. Those 18 under inferential break down further as follows: Mean Median Mode Range Stdev IQR Single t Ind t Paired t ANOVA ANCOVA F-ANOV RM Split Pearson Partial Point-B Phi Spearmn Kendall S-Linear M-Linear Chi-Ind Chi-Fit Difference? Relationship? Goodness of Fit?Independence?
  • 74. Is your question a question of: Difference? Relationship? Goodness of Fit?Independence?

Editor's Notes

  1. . . . FIT REALITY?
  2. . . . FIT REALITY?