Download to read offline
![Introduction
Method definition
Experimental results
Conclusions
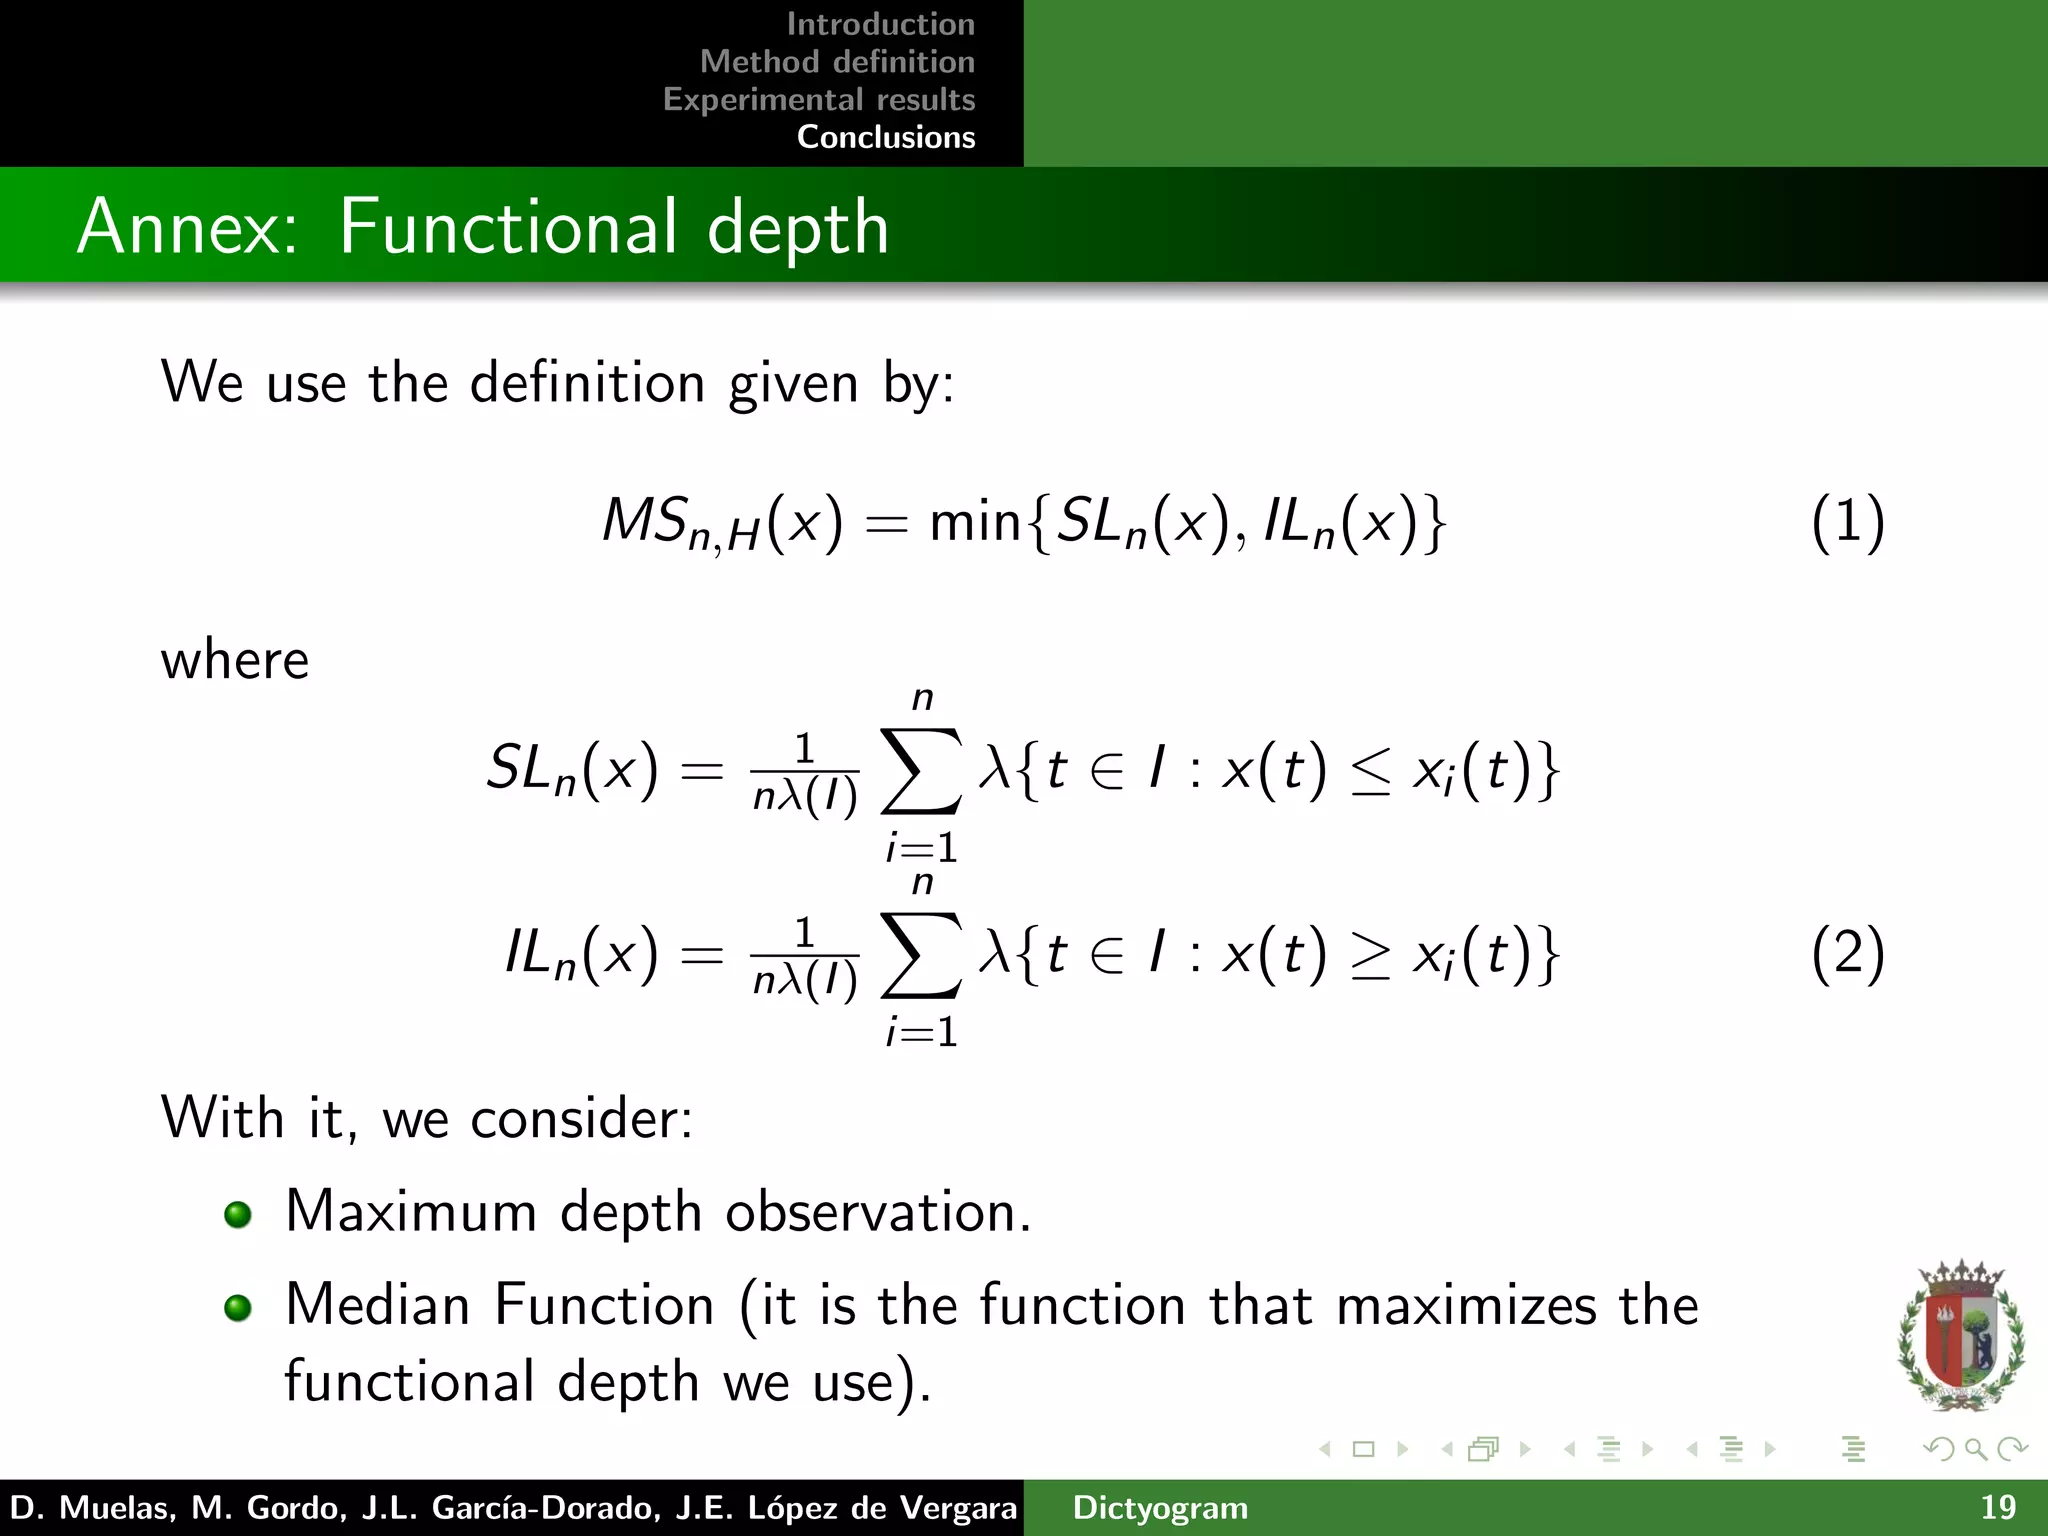
Probability integral transform
Modeling CDFs
Method description
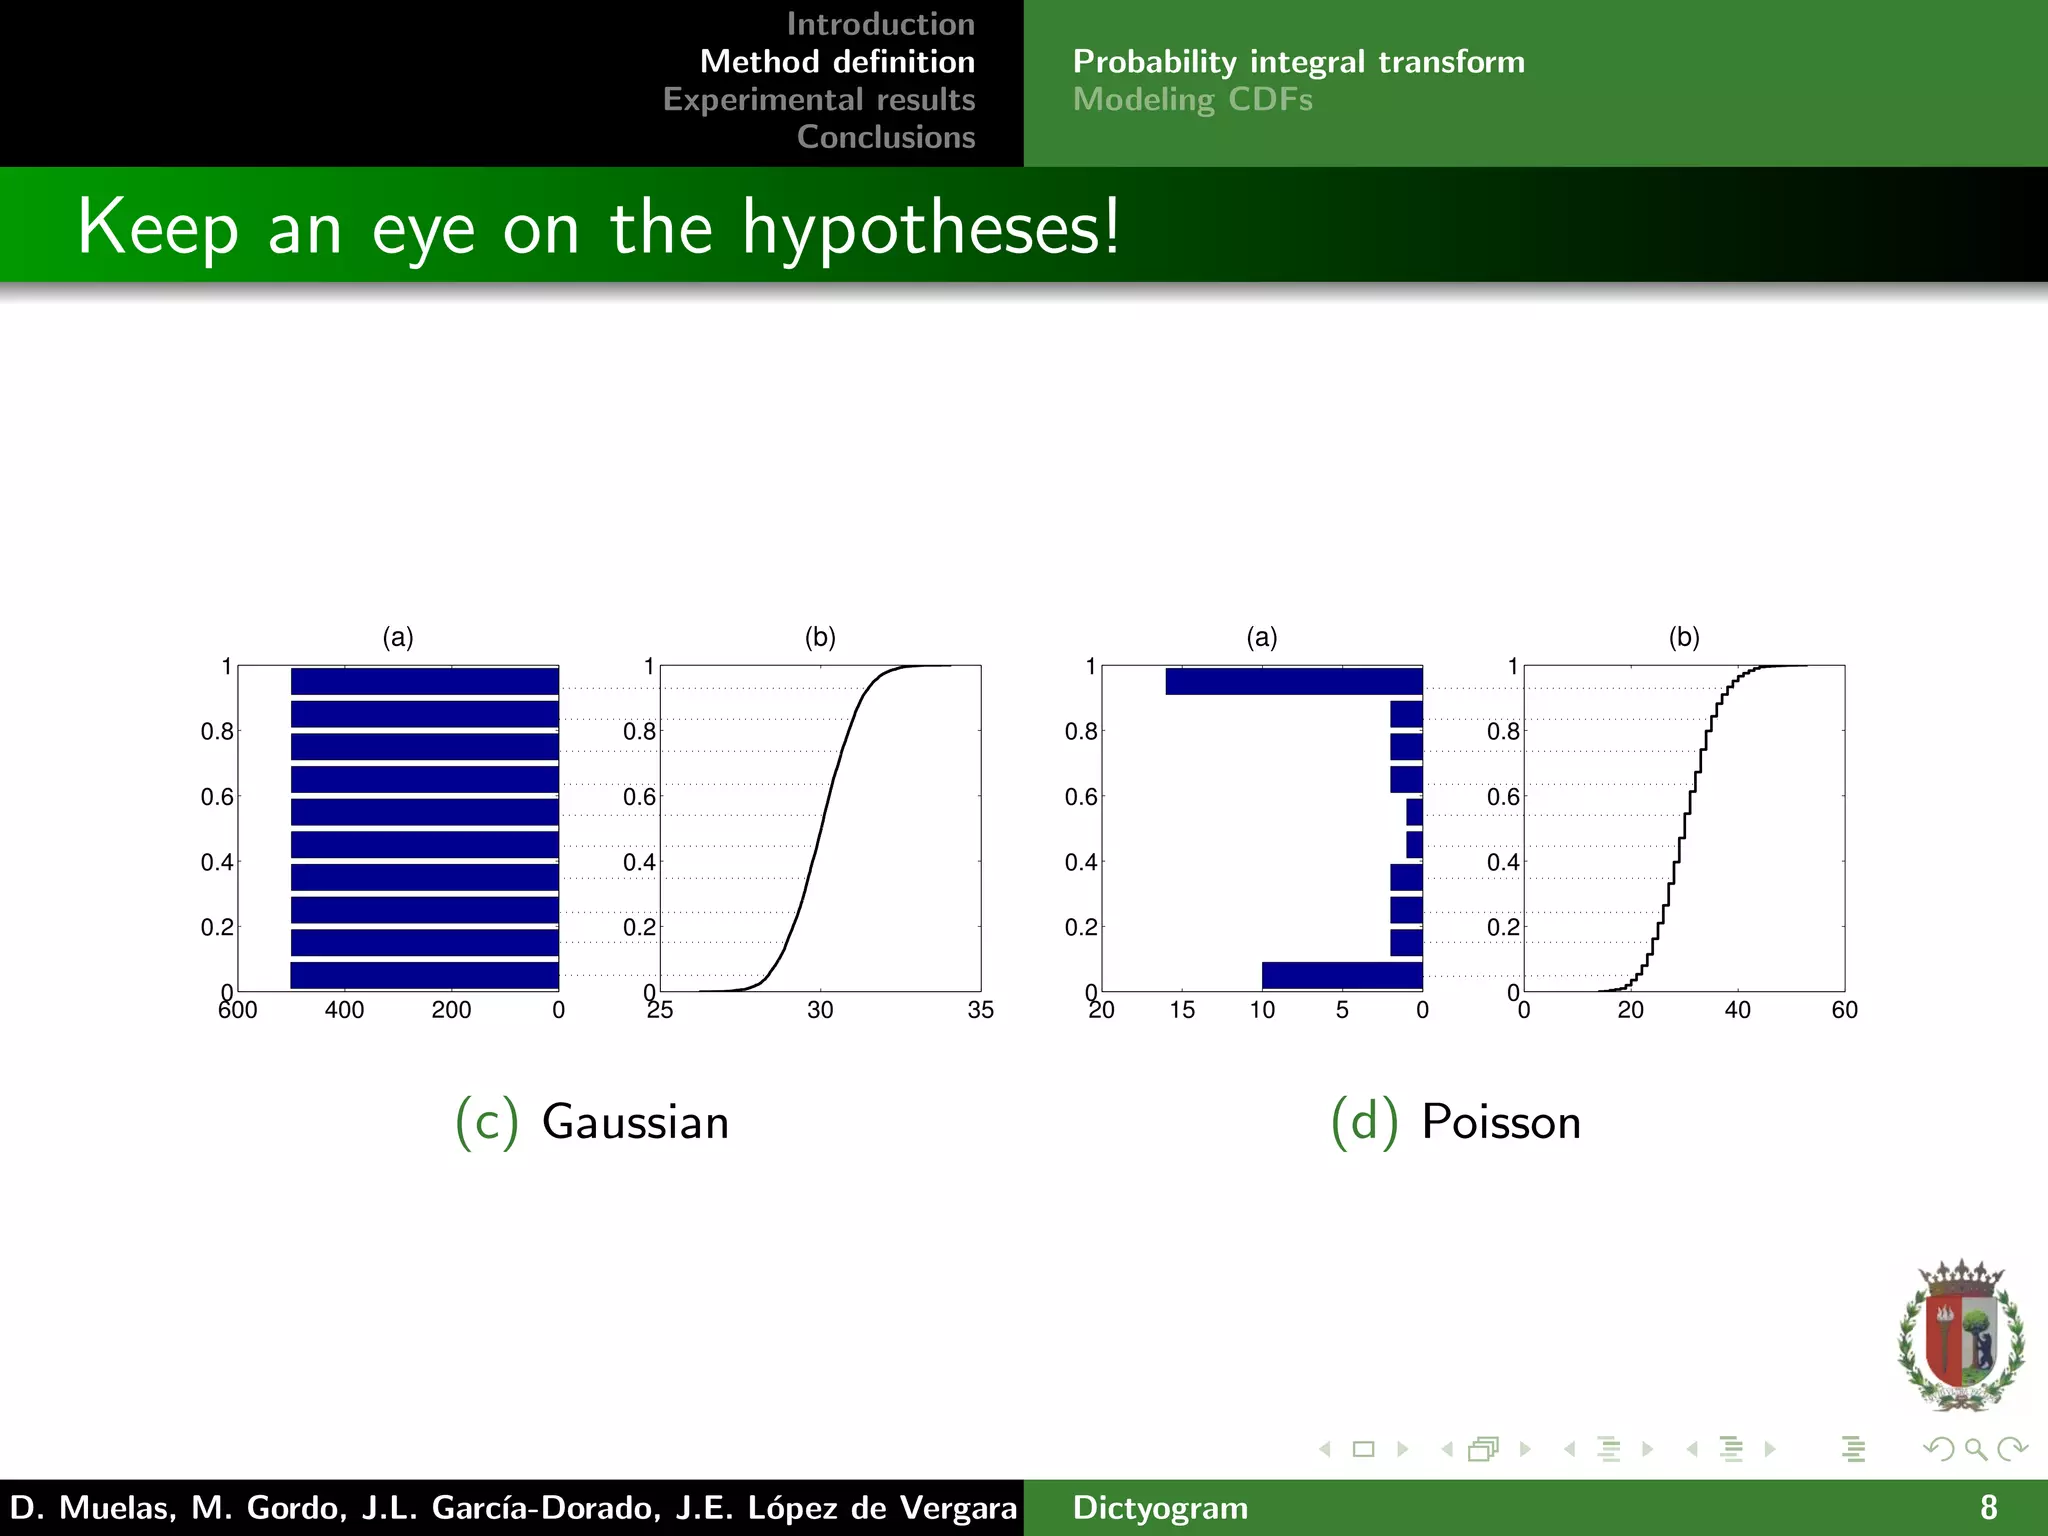
Probability integral transform:
Let X be a continuous random variable with cumulative
distribution function FX . Then FX (X) follows a uniform
distribution on [0, 1].
(b)
0
0.5
1
(a)
C
i
= F
X
−1
(P
i
)
P
i
And them, we define flow categories using a set of probability
levels using the CDF of certain flow characteristics.
D. Muelas, M. Gordo, J.L. Garc´ıa-Dorado, J.E. L´opez de Vergara Dictyogram 7](https://image.slidesharecdn.com/slidescnsm15dictyogram-151116092839-lva1-app6892/75/Dictyogram-a-Statistical-Approach-for-the-Definition-and-Visualization-of-Network-Flow-Categories-7-2048.jpg)
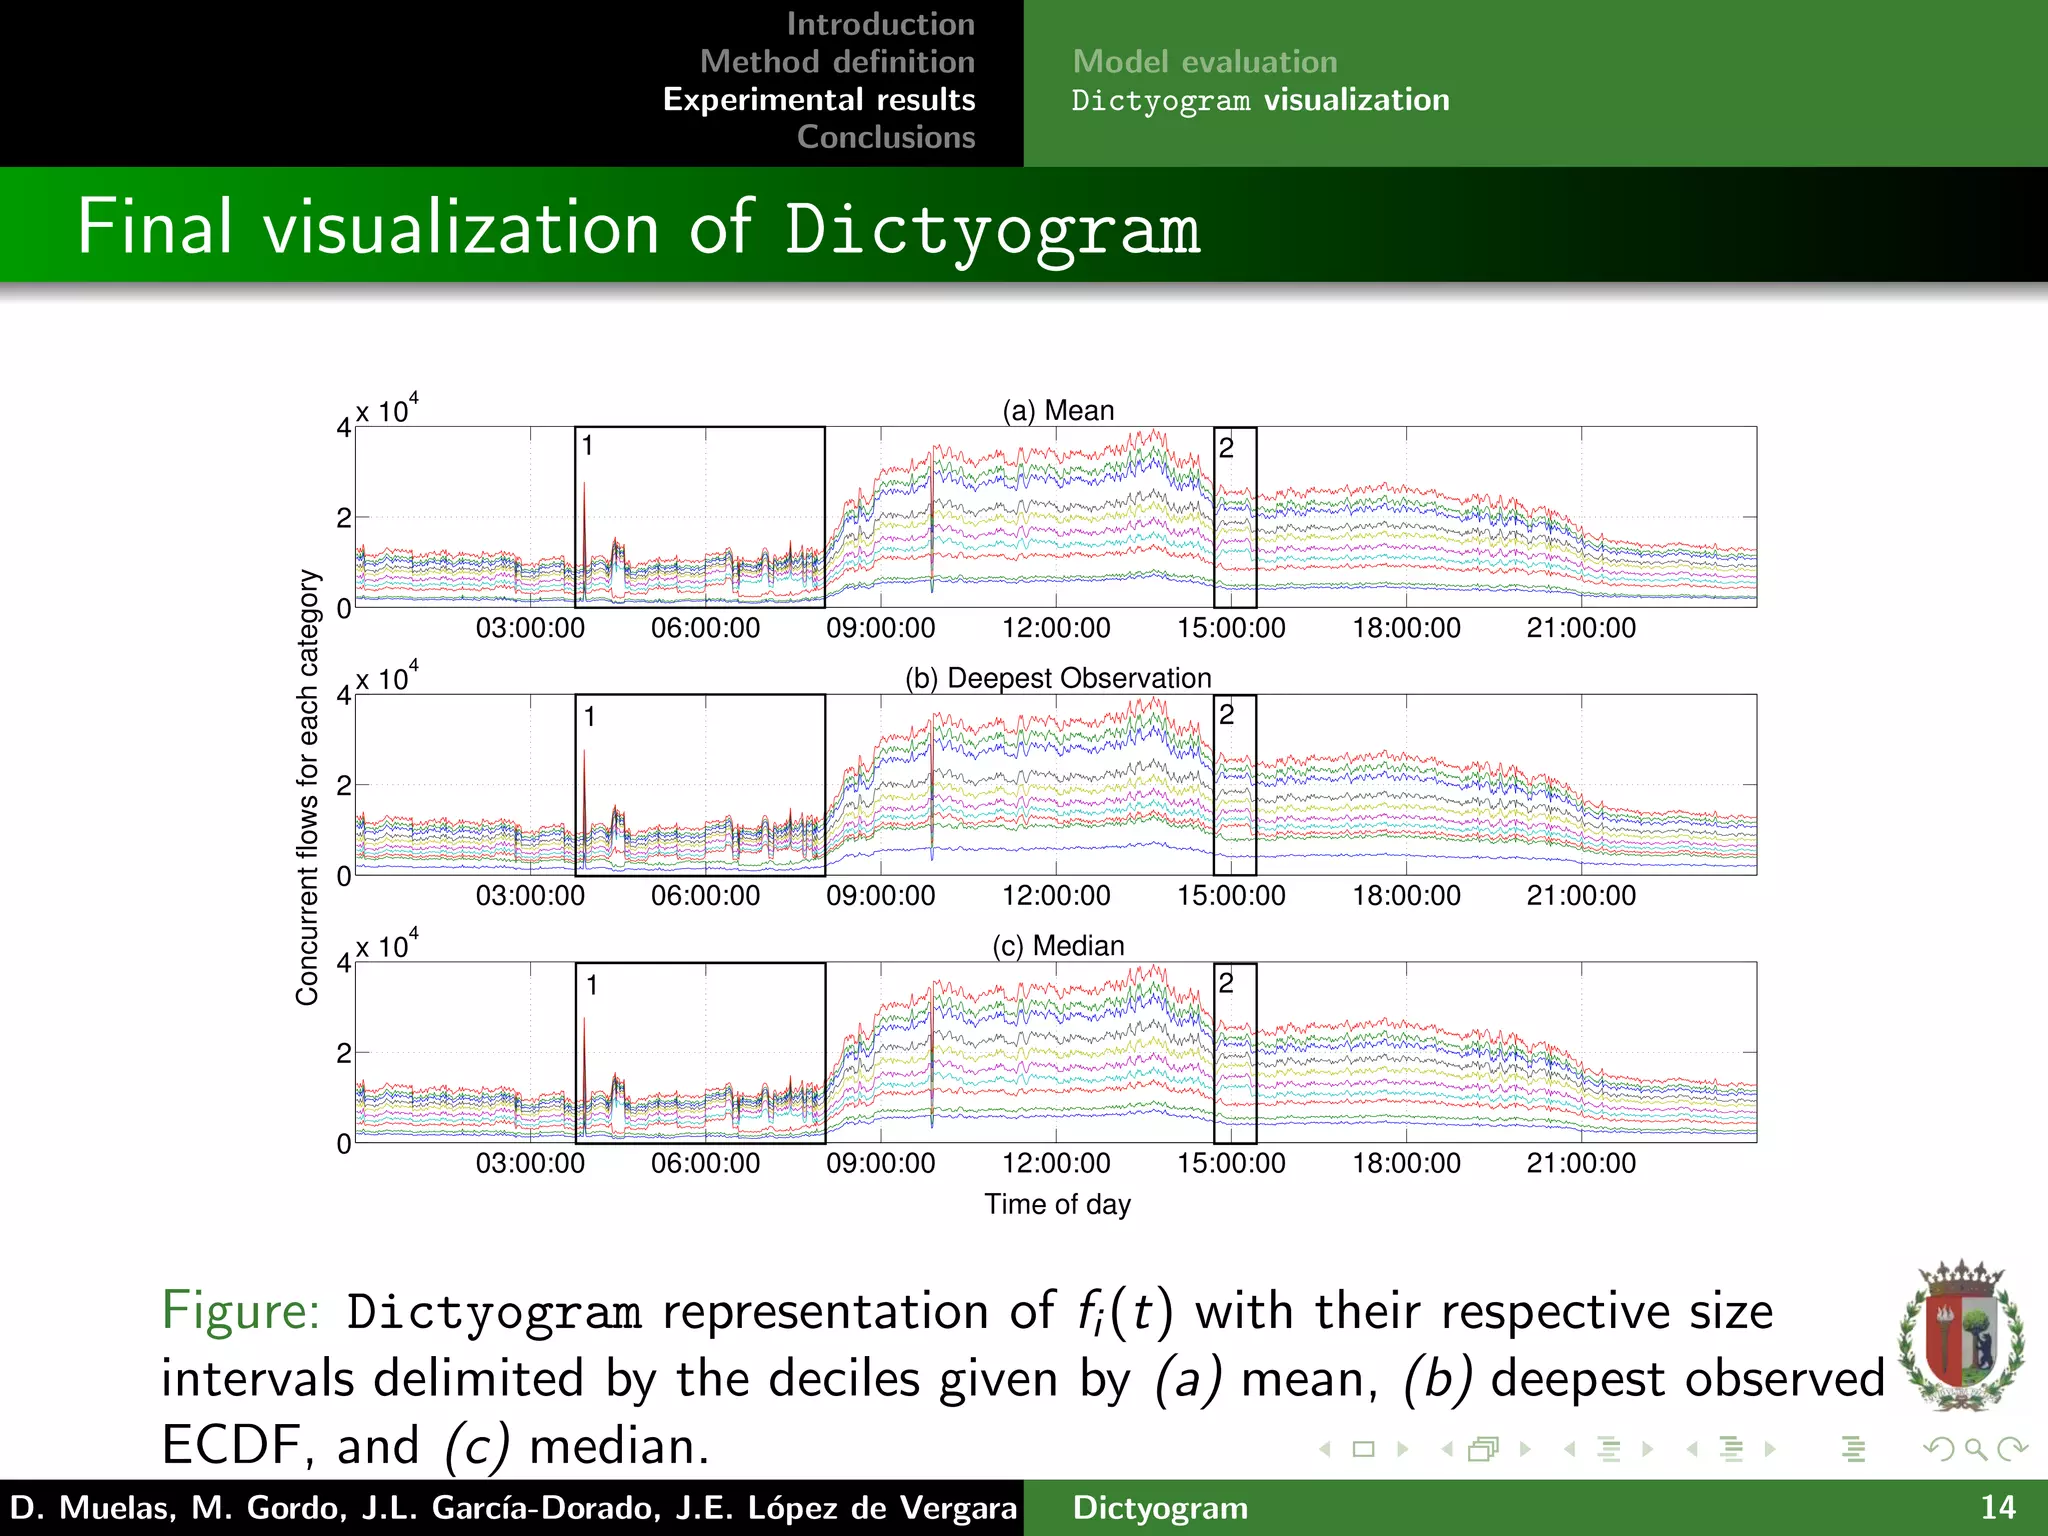
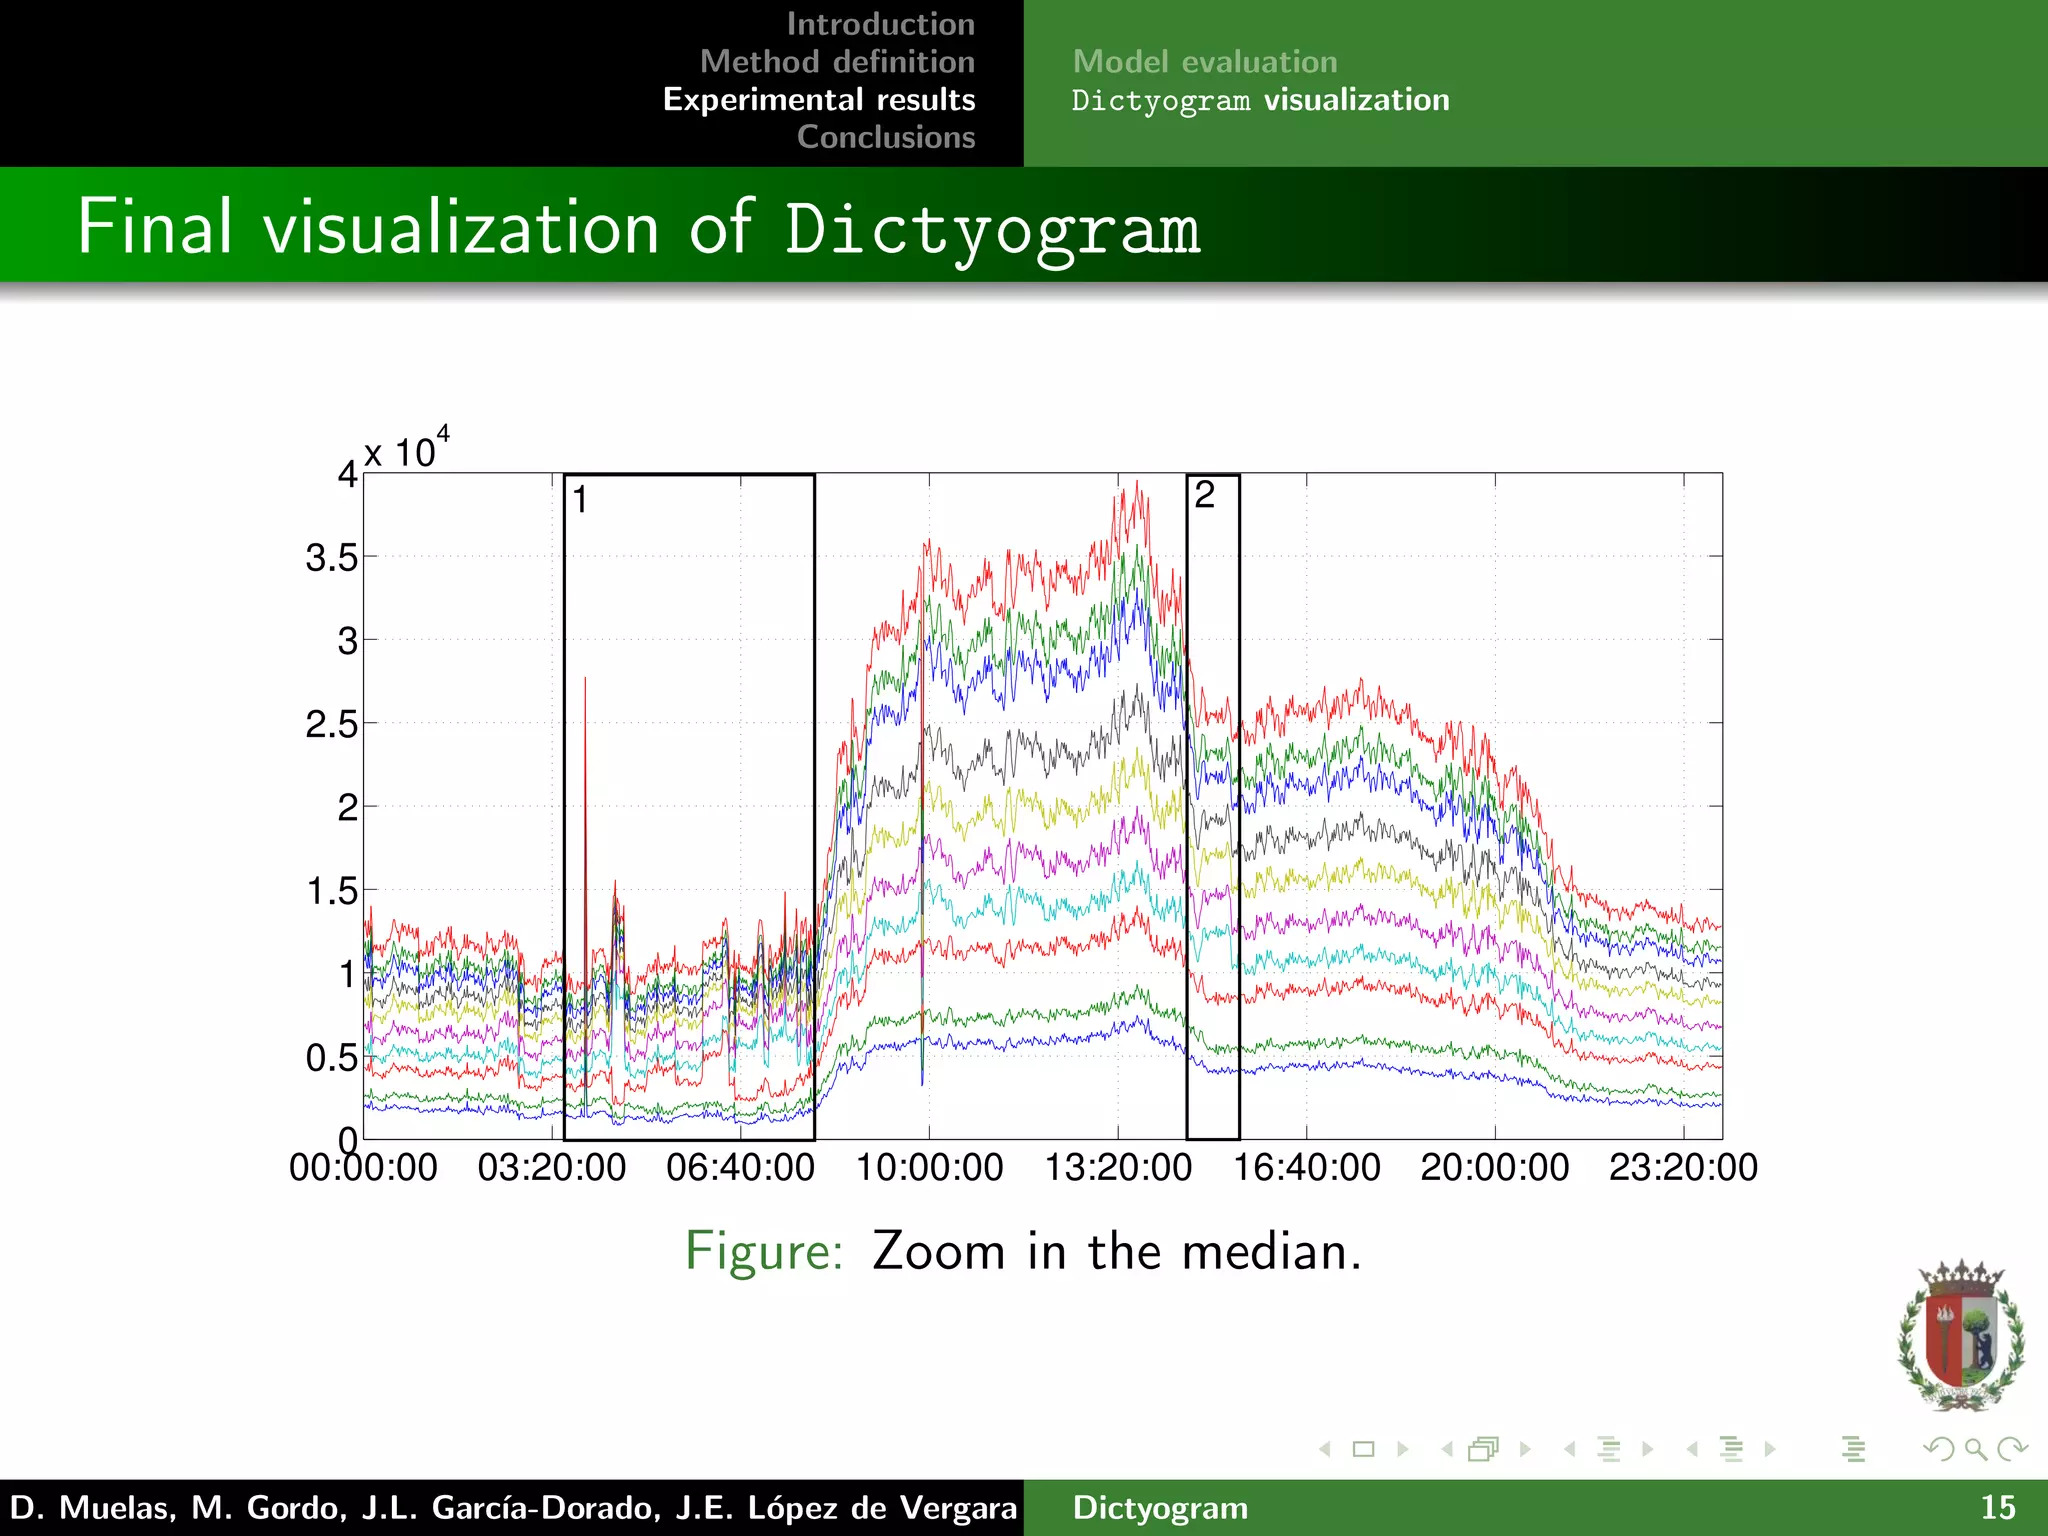


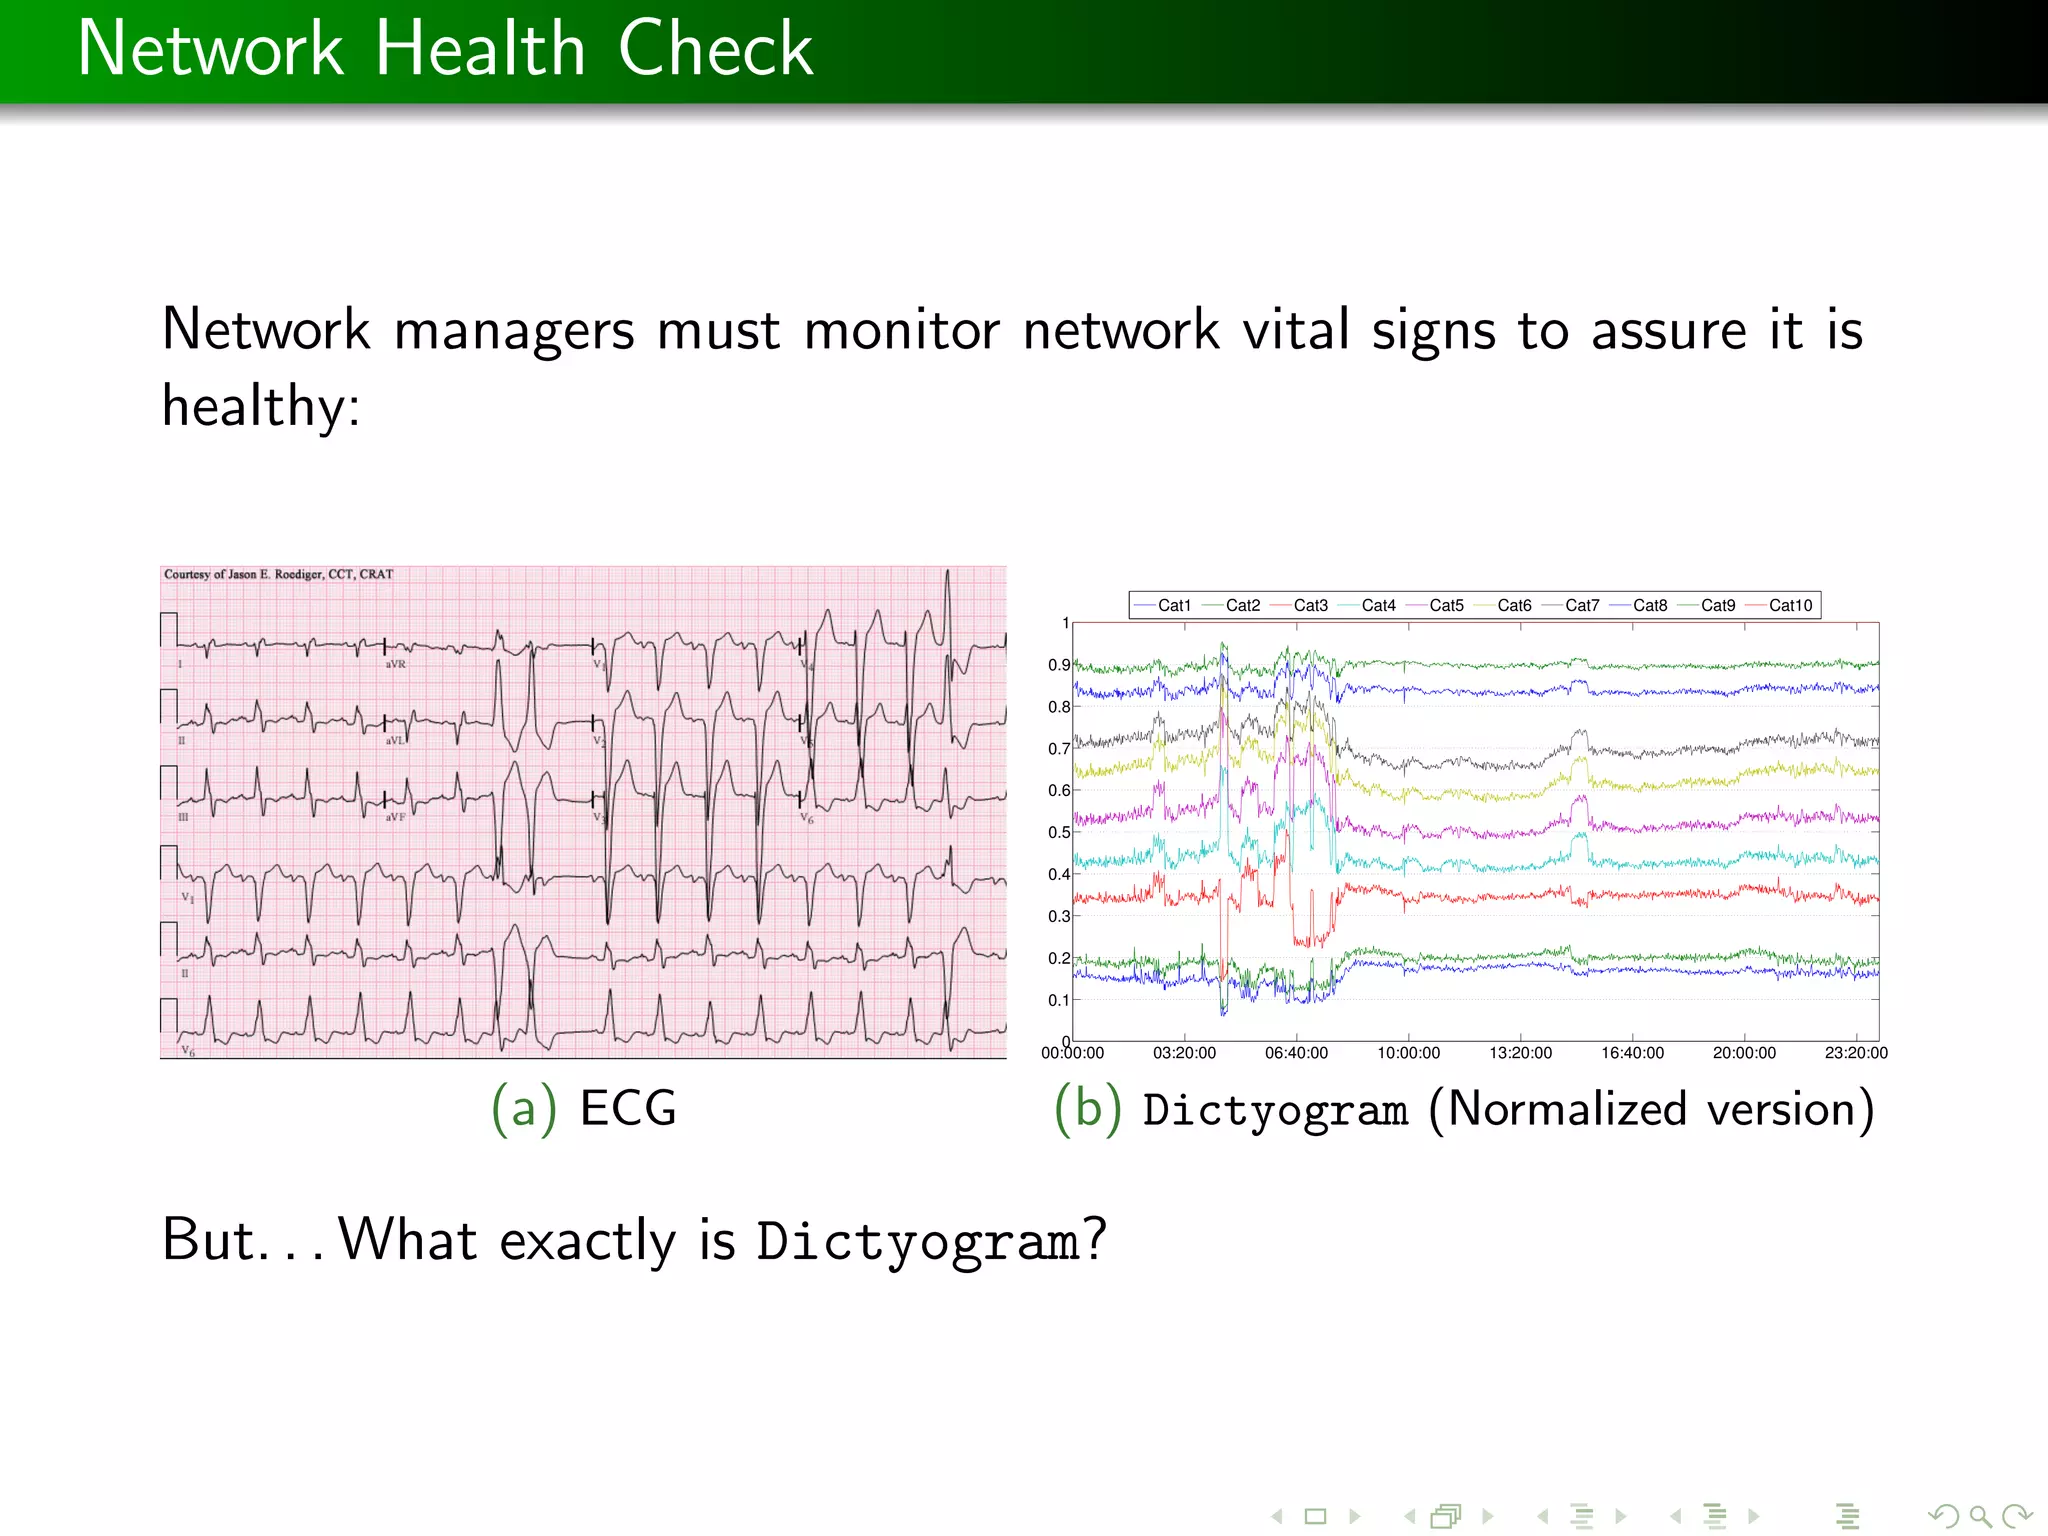
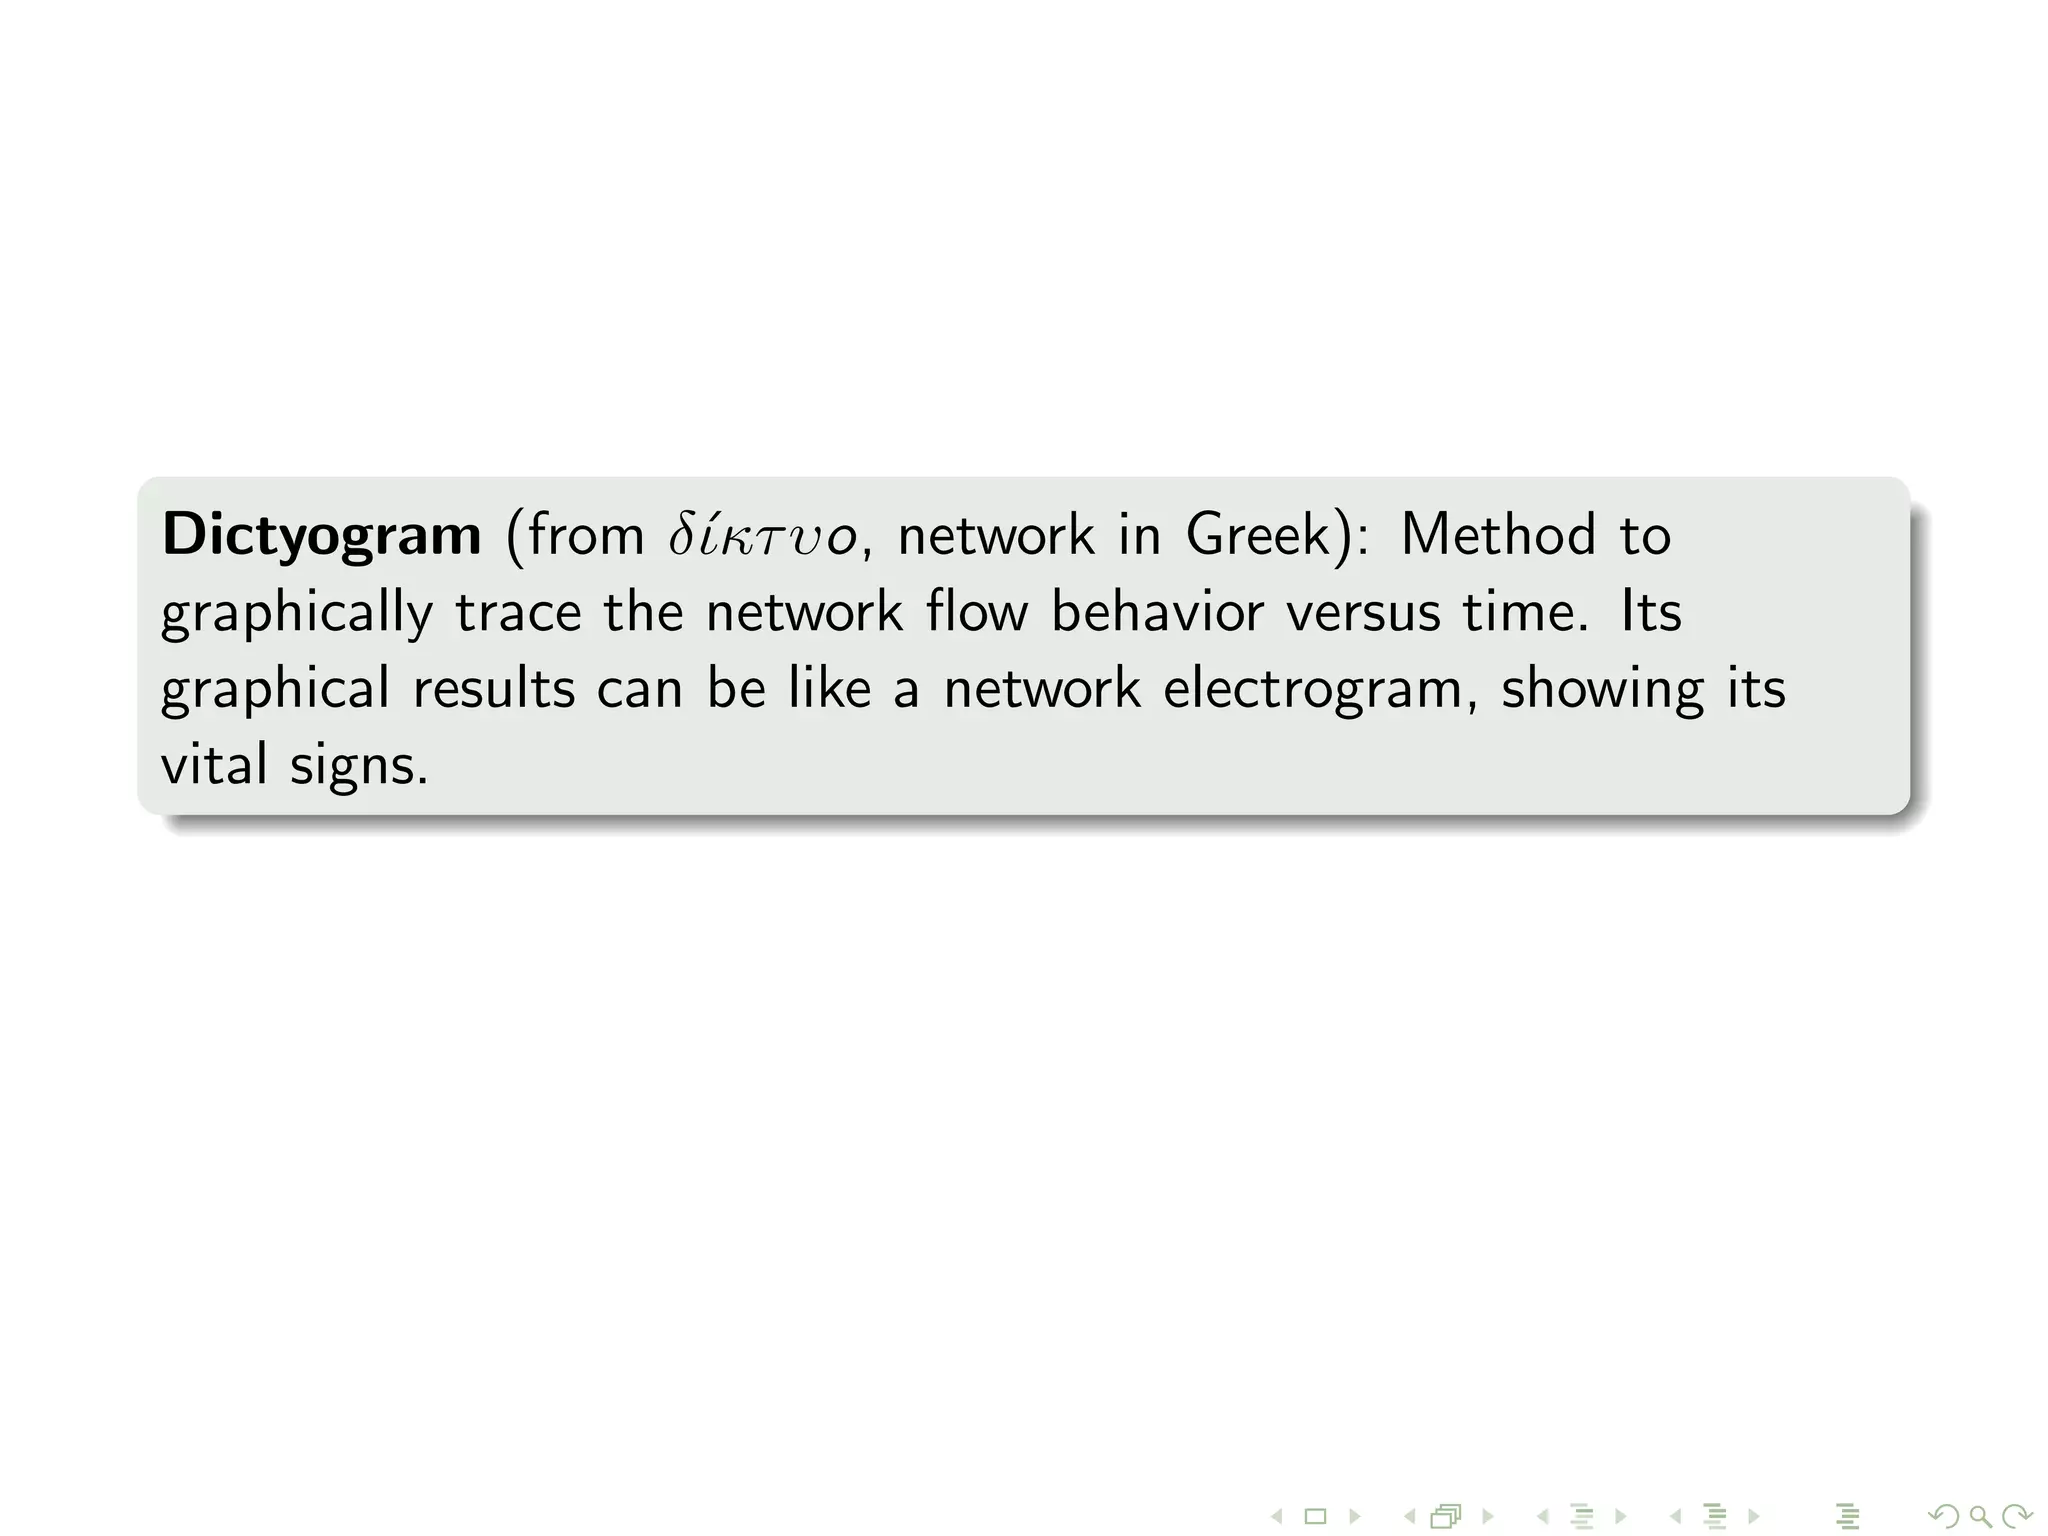
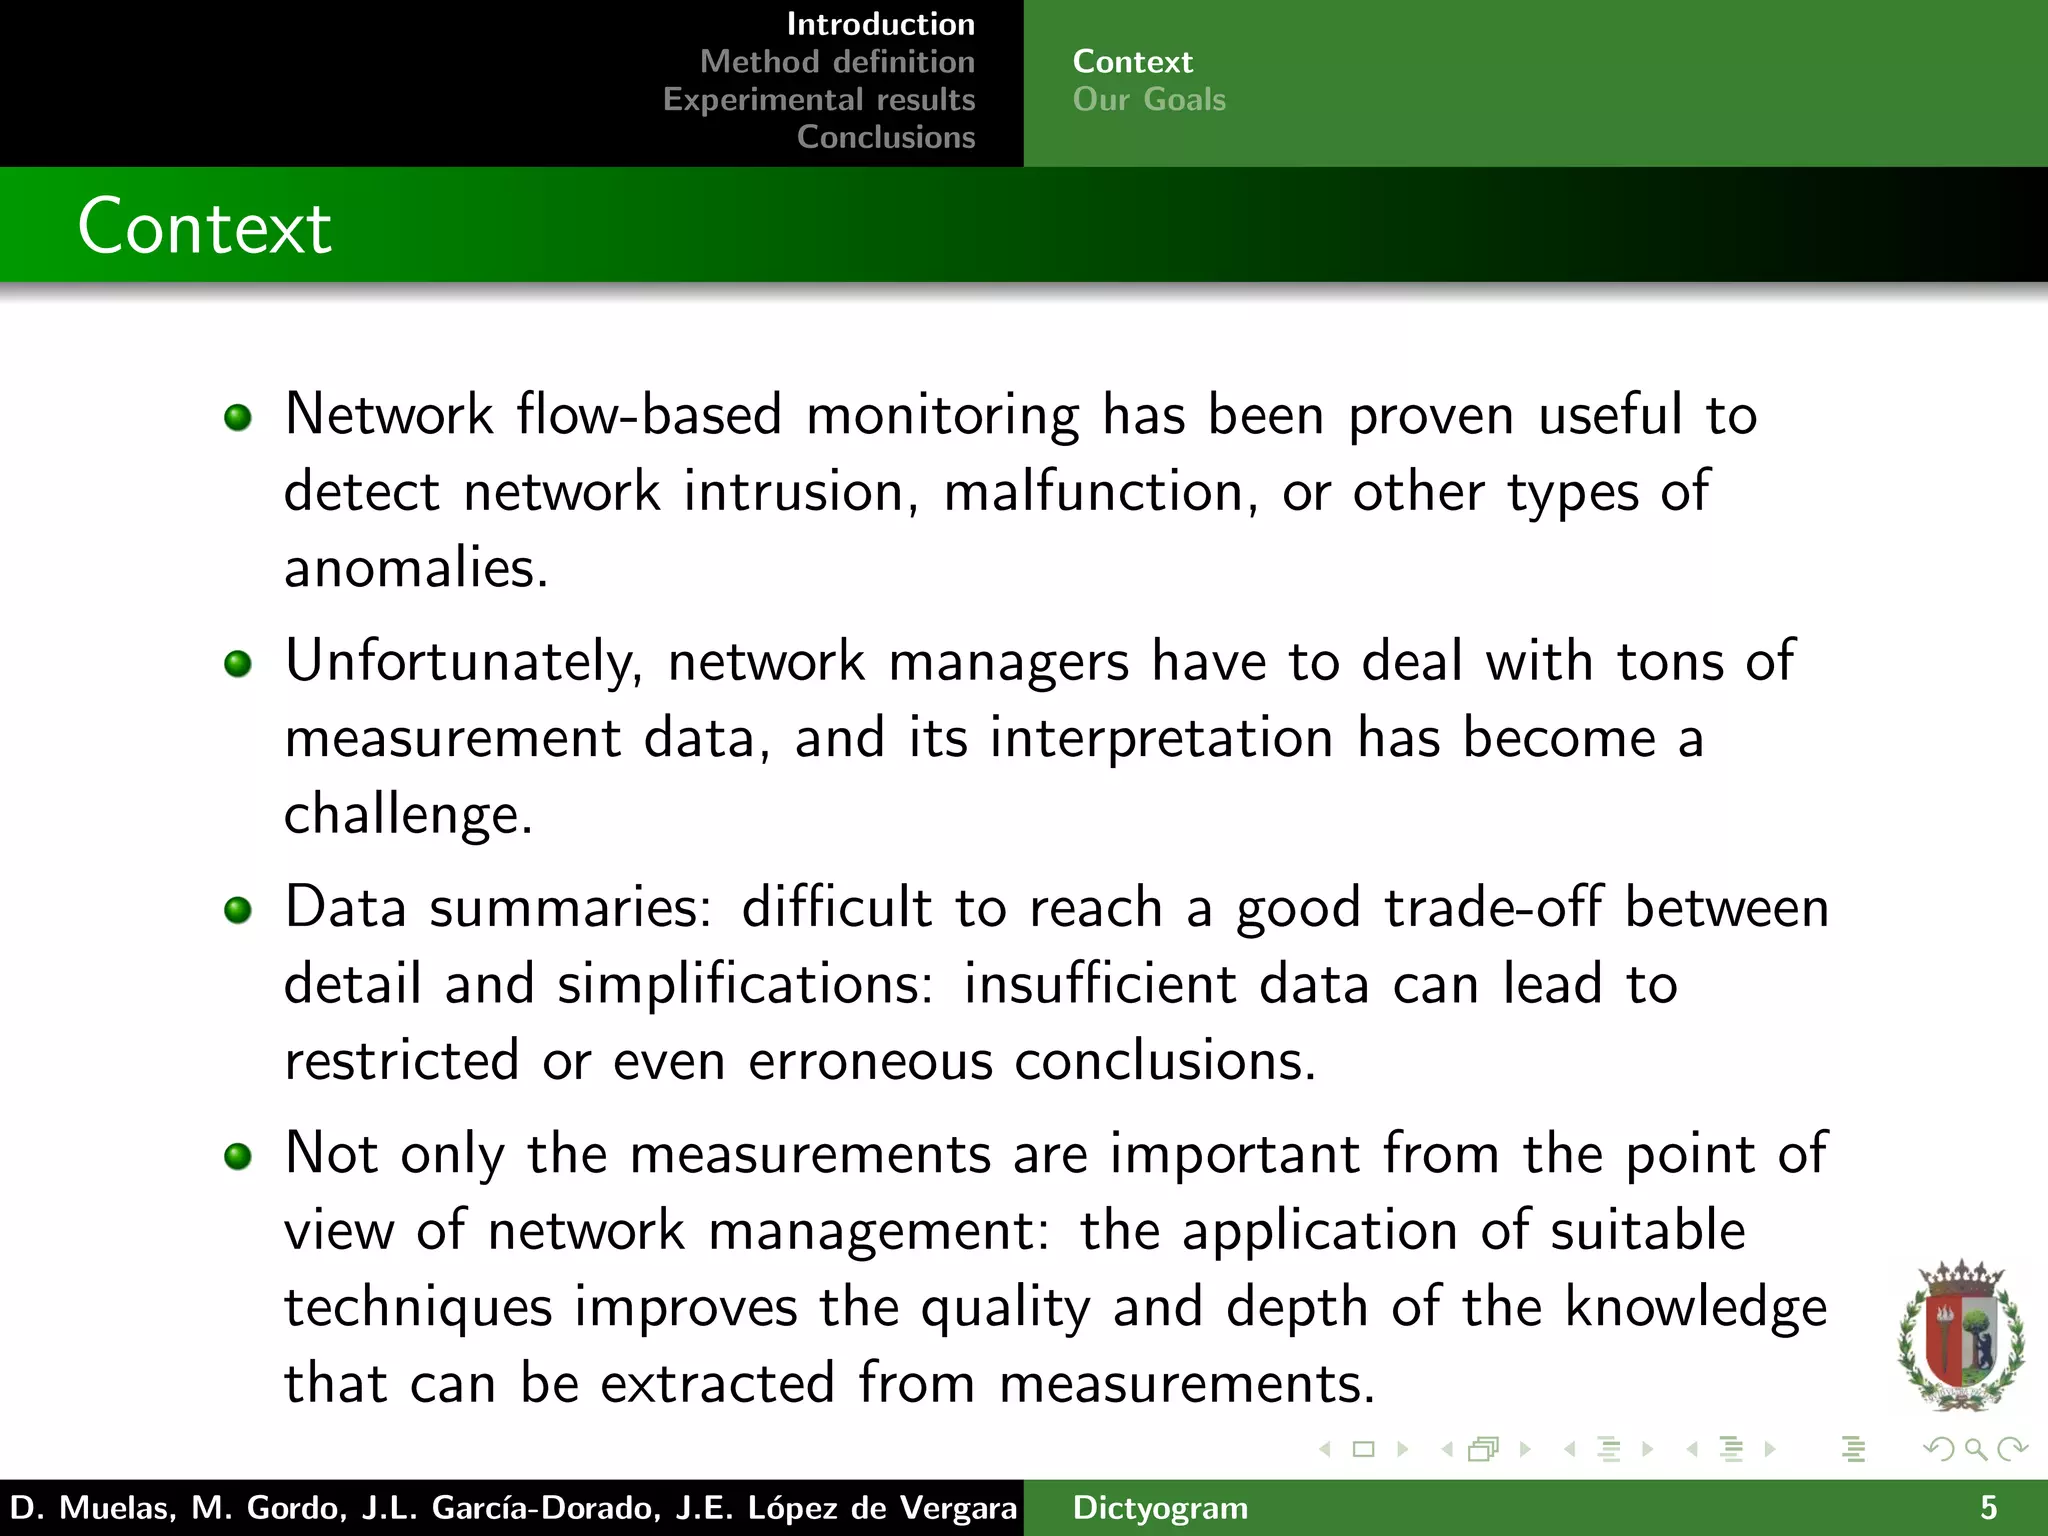
The document presents 'dictyogram', a statistical method for defining and visualizing network flow behavior over time, aimed at assisting network managers in monitoring and detecting anomalies. It introduces a novel approach to summarize network flow data using empirical cumulative distribution functions (ecdfs) and probability integral transforms to categorize flows. The study demonstrates the effectiveness of this method through real data analysis from the Spanish academic network, highlighting improvements in network monitoring and visualization.


![[DSC Europe 25] Petar Zivanov - AI meets documents From chatbots to AI-powere...](https://cdn.slidesharecdn.com/ss_thumbnails/xer2bb6nrdc8pdpev0pc-8-251204082258-7c2fa4a1-thumbnail.jpg?width=640&height=640&fit=bounds)
![[DSC Europe 25] Jim Sterne - Adopting Generative AI Capabilities Into the Ent...](https://cdn.slidesharecdn.com/ss_thumbnails/sxhpofuorcagxsaulkmt-3-251204082258-7e66bc48-thumbnail.jpg?width=640&height=640&fit=bounds)


![[DSC Europe 25] Boris Perkovic - Lost in performance.pptx](https://cdn.slidesharecdn.com/ss_thumbnails/uq5hrp7vsuahqkxzifux-1-251204082258-fd2ee09d-thumbnail.jpg?width=640&height=640&fit=bounds)


![[DSC Europe 25] Dusan Jovicic - AI Story: From on-prem to cloud and back agai...](https://cdn.slidesharecdn.com/ss_thumbnails/8kp49m6uq22ifnbwhfnk-2-251205085715-964d11a6-thumbnail.jpg?width=640&height=640&fit=bounds)


