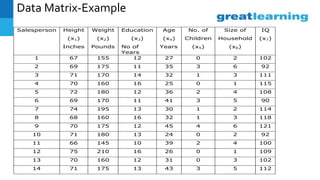
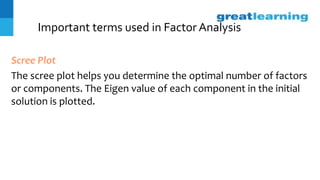
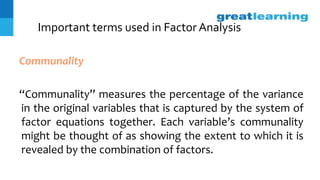
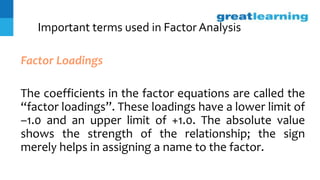
2. Introduction
This presentation is an earnest attempt to provide
the readers with the basic principles and role of
Factor Analysis in the context of Analytics.
3. Topics of Discussion
First, the conceptual framework of
factor analysis is covered in proper
sequence.
Then follows the interpretation based
on the Computer output.
4. What is Factor Analysis?
Factor analysis seeks to identify one or more underling
dimensions, given a set of variables.
The basic approach relies on the following argument:
“Variables that are highly correlated will converge to a
common concept”.
Factor analysis combines correlated variables into new
dimensions or factors. It proceeds, sequentially
identifying the first factor and then proceeding to the
next factor and so on.
7. Important terms used in Factor Analysis
Scree Plot
The scree plot helps you determine the optimal number of factors
or components. The Eigen value of each component in the initial
solution is plotted.
8. Important terms used in Factor Analysis
Communality
“Communality” measures the percentage of the variance
in the original variables that is captured by the system of
factor equations together. Each variable’s communality
might be thought of as showing the extent to which it is
revealed by the combination of factors.
9. Important terms used in Factor Analysis
Factor Loadings
The coefficients in the factor equations are called the
“factor loadings”. These loadings have a lower limit of
–1.0 and an upper limit of +1.0. The absolute value
shows the strength of the relationship; the sign
merely helps in assigning a name to the factor.
10. Important terms used in Factor Analysis
Variance Summarized
Factor analysis employs the criterion of maximum
reduction of variance – variance found in the initial set
of variables. Each factor contributes to the reduction.
The percentage of the initial variance associated with
(or moved by) each factor is shown under the label
“variance summarized”.
11. Important terms used in Factor Analysis
Factor Scores
Numerical values can be computed on each factor for the
individual units by substituting the values of the original
variables or better the standard scores on the original
variables in the factor equations. The calculated values will
show the extent to which each unit possesses each factor.
These factor scores, rather than the original variables, can
then serve as the appropriate input data for subsequent
analyses.
13. Results for the Example Problem
Unrotated Factor Loadings
Variables PC1 PC2 PC3 Communality
Height -0.5904 0.7217 -0.3033 0.9614
Weight -0.4526 0.7593 -0.4427 0.9774
Education -0.8025 0.1851 0.4263 0.8601
Age 0.8669 0.4112 0.1873 0.9556
NoChildren 0.8495 0.4925 0.0588 0.9676
HouseholdSize 0.9258 0.3001 -0.0195 0.9476
IQScore -0.2876 0.4670 0.8052 0.9492
Eigen Value 3.6104 1.8514 1.1571
% Variance 0.5158 0.2645 0.1653
Cummulative 0.5158 0.7803 0.9456
14. Results for the Example Problem
Rotation of Axes
Component (Factor)
1 2 3
Height -.590 .722 -.303
Weight -.453 .759 -.443
Education -.803 .185 .426
Age .867 .411 .187
Children .849 .492 5.883E-02
Family Size .926 .300 -1.953E-02
IQ Score -.288 .467 .805
15. Results for the Example Problem
Rotated Factor Loadings
Variables RC1 RC2 RC3 Communality
Height -0.1635 0.9460 0.1992 0.9614
Weight -0.0393 0.9867 0.0483 0.9774
Education -0.5520 0.2631 0.6972 0.8601
Age 0.9682 -0.1287 0.0410 0.9556
NoChildren 0.9831 0.0038 -0.0342 0.9676
HouseholdSize 0.9428 -0.1376 -0.1996 0.9476
IQScore 0.0669 0.0852 0.9682 0.9492
Eigen Value 3.1301 1.9805 1.5083
% Variance 0.4472 0.2829 0.2155
Cummulative 0.4472 0.7301 0.9456
16. Results for the Example Problem
Variance Summarized
Extraction Sums of Squared
Loadings
Rotation Sums of Squared
Loadings
Factor Eigen
Value
% of
Variance
Cumulative
%
Eigen
Value
% of
Variance
Cumulative
%
1 3.610 51.577 51.577 3.129 44.702 44.702
2 1.851 26.448 78.025 1.981 28.306 73.009
3 1.157 16.530 94.555 1.508 21.546 94.555
17. Application of Factor Analysis
• When questionnaires are designed to measure
Customer Satisfaction or Service Quality with
multiple-item scale, the question items can be
collapsed into distinct factors or dimensions that
will help the marketer discern patterns, identify
factors and draw perceptual maps on the
important dimensions.
18. Application of Factor Analysis
• A good exercise in Customer Profiling in terms
of demographic, and psycho-graphic
dimensions could be done through factor
analysis using consumer panel data maintained
by the research agencies and organizations.
19. Application of Factor Analysis
• A good factor analysis will help take appropriate
decisions on market segmentation and marketing
mix.
• Prediction in terms of good, moderate, average and
poor performance could be made by using factor
scores effectively.
20. Subjective Issues In Factor Analysis
• How many factors should be extracted for reducing the
variables?
• What method should be used to extract factors?
• Should factor rotation be employed? If the answer is
yes, which type of rotation?
• Naming/labeling the factors is purely intuitive and
subjective.
• What are the proper input data? Should we use original
units or standardized scores of the original units?