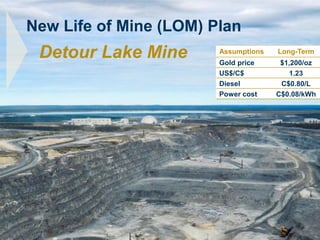
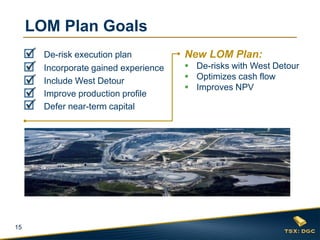
This document provides an overview and summary of Detour Gold Corporation's updated life of mine plan for the Detour Lake gold mine in Ontario, Canada. Key highlights include:
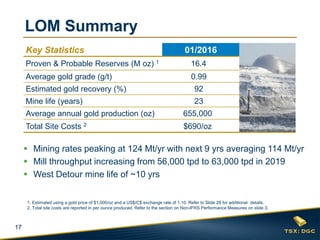
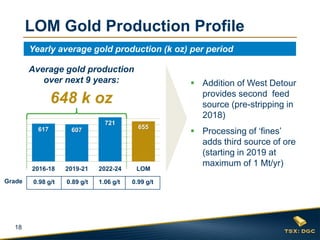
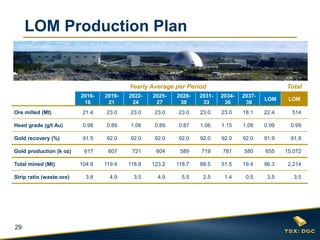
- The mine life is extended to 23 years, producing an average of 655,000 ounces of gold annually.
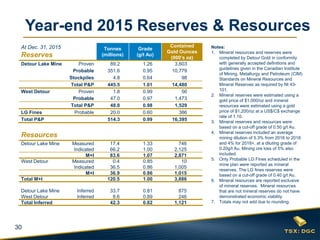
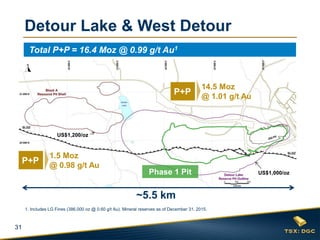
- Total proven and probable reserves are estimated at 16.4 million ounces of gold.
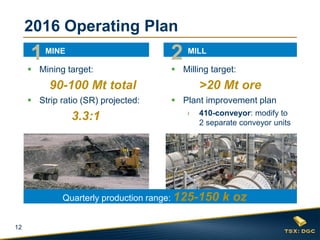
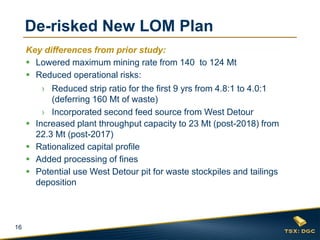
- Production is expected to increase over the next several years as the second West Detour pit comes online in 2018 and mill throughput expands.
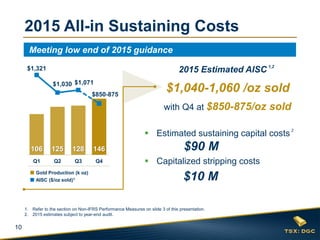
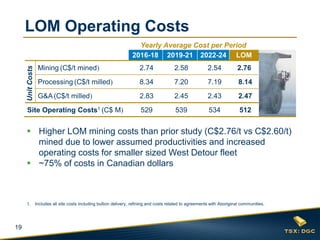
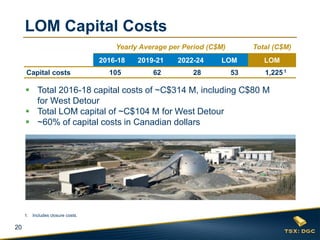
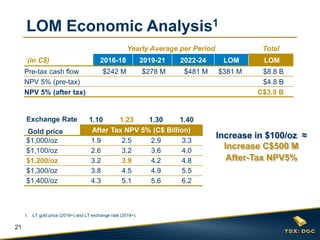
- Operating costs are estimated to average $690 per ounce over the life of mine, with capital costs totaling approximately $1.225 billion.