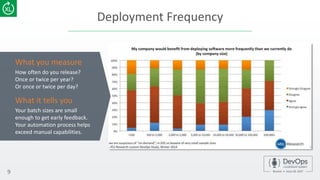
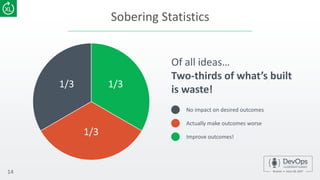
DevOps by the Numbers
Sunil Mavadia
Director of Customer Success, XebiaLabs
Why Numbers
Metrics are everything.
Only when something is measured can it be improved upon.
Often, deciding what to measure is the most critical piece.
2
5 Characteristics of a good metric
• Easily measurable
• Directly correlated to business performance
• Predictive of future business performance
• Isolated
• Comparable to competition
3
4
Focus on bringing down cycle time;
the rest will naturally follow of its
own accord.
2 Phases
5
Automation &
Optimization
The Digital
Enterprise
2 Phases
6
Automation & Optimization The Digital Enterprise
The DevOps Dashboard The Digital Enterprise Dashboard
The DevOps Dashboard
• Time
• Frequency
• Change Volume
• Success Rate
• MTTR
The DevOps Dashboard
• Time
• Frequency
• Change Volume
• Success Rate
• MTTR
Time to Delivery
8
How long it takes on an average to
get the code from development
through to 100% deployed and
upgraded in production
What you measure
Is the dev/deploy process
inefficient? At what stage(s)?
What it tells you
Deployment Frequency
9
How often do you release?
Once or twice per year?
Or once or twice per day?
What you measure
Your batch sizes are small
enough to get early feedback.
Your automation process helps
exceed manual capabilities.
What it tells you
Change Volume
10
How many user stories are being
deployed in a release? How
complex are the changes? Lines of
code maybe…(eek!)
What you measure
Is there meat in the releases?
What it tells you
Time to Recovery
11
What % of deployments failed
resulting in an outage? BUT publish
it as an increasing positive instead
of a shrinking negative.
What you measure
Is there quality in both your code
and your DevOps process? Do you
have configuration drift?
What it tells you
Change Volume
12
How long do you take to recover
from a failed change? Days? Hours?
Minutes! Break some stuff.
What you measure
Can you respond rapidly? How well
does your team respond to
unfamiliar problems?
What it tells you
Michael Müller-Hillebrand
FAILURES AREN’T BAD;
NOT RESPONDING TO FAILURES IS BAD.
The DevOps Dashboard
• Time
• Frequency
• Change Volume
• Success Rate
• MTTR
The Digital Enterprise Dashboard
• Adoption
• Happiness
• Business Impact
• Cultural Impact
Sobering Statistics
14
1/3 1/3
1/3
Of all ideas…
Two-thirds of what’s built
is waste!
No impact on desired outcomes
Improve outcomes!
Actually make outcomes worse
Adoption & Use
15
• Traffic
• Calls to APIs
• New user sign-ups
• Performance (e.g., response time)
What you measure
Is the feature or functionality being
used? Is it improving users’ outcomes?
What it tells you
www.dailymail.co.uk/
Happiness
16
• Support ticket volume
• Public feedback (twitter, etc.)
• Quantitative (NPS)
• Personal input (Intercom.io, ASK!)
What you measure
Are they being successful? Is the
change delivering value?
What it tells you
Business Impact
17
• Trial conversions
• Churn
• Press/Analysts response
• KPIs
What you measure
Software is your business (even when
your business isn’t software)
What it tells you
Cultural Impact
18
• Staff turnover
• Morale (internal surveys)
What you measure
Quality software and quality
processes impact quality of life.
What it tells you
The DevOps Dashboard
• Time
• Frequency
• Change Volume
• Success Rate
• MTTR
Questions?... Opinions?
The DevOps Dashboard
• Time
• Frequency
• Change Volume
• Success Rate
• MTTR
THANK YOU

DevOps By The Numbers

  • 1.
    DevOps by theNumbers Sunil Mavadia Director of Customer Success, XebiaLabs
  • 2.
    Why Numbers Metrics areeverything. Only when something is measured can it be improved upon. Often, deciding what to measure is the most critical piece. 2
  • 3.
    5 Characteristics ofa good metric • Easily measurable • Directly correlated to business performance • Predictive of future business performance • Isolated • Comparable to competition 3
  • 4.
    4 Focus on bringingdown cycle time; the rest will naturally follow of its own accord.
  • 5.
  • 6.
    2 Phases 6 Automation &Optimization The Digital Enterprise The DevOps Dashboard The Digital Enterprise Dashboard
  • 7.
    The DevOps Dashboard •Time • Frequency • Change Volume • Success Rate • MTTR The DevOps Dashboard • Time • Frequency • Change Volume • Success Rate • MTTR
  • 8.
    Time to Delivery 8 Howlong it takes on an average to get the code from development through to 100% deployed and upgraded in production What you measure Is the dev/deploy process inefficient? At what stage(s)? What it tells you
  • 9.
    Deployment Frequency 9 How oftendo you release? Once or twice per year? Or once or twice per day? What you measure Your batch sizes are small enough to get early feedback. Your automation process helps exceed manual capabilities. What it tells you
  • 10.
    Change Volume 10 How manyuser stories are being deployed in a release? How complex are the changes? Lines of code maybe…(eek!) What you measure Is there meat in the releases? What it tells you
  • 11.
    Time to Recovery 11 What% of deployments failed resulting in an outage? BUT publish it as an increasing positive instead of a shrinking negative. What you measure Is there quality in both your code and your DevOps process? Do you have configuration drift? What it tells you
  • 12.
    Change Volume 12 How longdo you take to recover from a failed change? Days? Hours? Minutes! Break some stuff. What you measure Can you respond rapidly? How well does your team respond to unfamiliar problems? What it tells you Michael Müller-Hillebrand FAILURES AREN’T BAD; NOT RESPONDING TO FAILURES IS BAD.
  • 13.
    The DevOps Dashboard •Time • Frequency • Change Volume • Success Rate • MTTR The Digital Enterprise Dashboard • Adoption • Happiness • Business Impact • Cultural Impact
  • 14.
    Sobering Statistics 14 1/3 1/3 1/3 Ofall ideas… Two-thirds of what’s built is waste! No impact on desired outcomes Improve outcomes! Actually make outcomes worse
  • 15.
    Adoption & Use 15 •Traffic • Calls to APIs • New user sign-ups • Performance (e.g., response time) What you measure Is the feature or functionality being used? Is it improving users’ outcomes? What it tells you www.dailymail.co.uk/
  • 16.
    Happiness 16 • Support ticketvolume • Public feedback (twitter, etc.) • Quantitative (NPS) • Personal input (Intercom.io, ASK!) What you measure Are they being successful? Is the change delivering value? What it tells you
  • 17.
    Business Impact 17 • Trialconversions • Churn • Press/Analysts response • KPIs What you measure Software is your business (even when your business isn’t software) What it tells you
  • 18.
    Cultural Impact 18 • Staffturnover • Morale (internal surveys) What you measure Quality software and quality processes impact quality of life. What it tells you
  • 19.
    The DevOps Dashboard •Time • Frequency • Change Volume • Success Rate • MTTR Questions?... Opinions?
  • 20.
    The DevOps Dashboard •Time • Frequency • Change Volume • Success Rate • MTTR THANK YOU

Editor's Notes

  • #2 INTRO : Who am I? Former customer. Led large DevOps Transformation projects for a large satellite imagery company. Now I manage customers in the role of of Director of Customer Success. DevOps Coach, Influencer, Speaker and Killer Ninja.
  • #3 Metrics are everything. Only when something is measured can it be improved upon. Often, deciding what to measure is the most critical piece, and it's not a job for copy and paste. How would you describe your organization’s DevOps program today?  In the planning phase A work-in-progress Well established Expert
  • #4 The 5 Characteristics of a Good Metric Easily measurable: A good metric should be relatively simple to measure. If you have to build a new system or implement a complicated process just to measure the metric, it's probably not worth measuring in the first place. Directly correlated to business performance: The metric should be tied to business-oriented goals you establish for the department, group, or company. The right metric will tell you if you are successfully executing the fundamentals. Predictive of future business performance: The best metrics do not tell you just how well you've done (your financials tell you that); they tell you how well you're going to do - in the next month, quarter, or year. Isolated to factors controlled by the group it is measuring: It's difficult to do, but identifying those fundamentals pertaining to a particular team will tell you much more about their strengths and performance. Comparable to competitors' metrics: It's helpful to track your progress against competitors. This will help you judge how well you're building or maintaining an operational advantage, holding on to top talent, and retaining top customers
  • #5 Dave Farley speaking at one of our Summits in Amsterdam He has a tight focus for DevOps…reduce cycle time. So is it that simple? Just measure that one thing?
  • #6 We see 2 major phases in a DevOps journey: Phase 1 – being good at the process of software delivery. Basic automation AND process optimization is core to any devOps project Phase 2 – Once Automation is done, are you done? NO the idea of the digital enterprise is that software is central to your business even if software isn’t your business. Bank example – when was the last time you went into a bank? Software makes the business, but it’s only successful if the software has an impact. Cycle time reduction is unimportant if nobody cares about the product.
  • #8 Lots written about what to measure for DevOps. Finding the right balance of too few (sorry Dave Farley) and too many (dozens) is key. I’ll suggest these 5…
  • #9 James Wickett, creator of Gauntlet (GAUNTLT) for security testing in devops Illumination – what do I need to improve? Not just “am I getting faster?” Change Lead Time The time from the start of a development cycle (the first new code) to deployment is the change lead time.  It’s a measure of the efficiency of the development process, of the complexity of the code and the development systems, and also (like deployment frequency) of team and developer capabilities.  If the change lead time is too long, it may be an indication that the development/deployment process is inefficient in certain stages, or that it includes performance bottlenecks.
  • #10 Everyone ( Deployment (or Change) Frequency DevOps practices make frequent or continuous deployment possible; large, high-traffic web sites and cloud-based services make it a necessity.  With fast feedback and small-batch development, updated software can be deployed every few days, or even several times per day.  In a DevOps environment, deployment frequency can be a direct or indirect measure of response time, team cohesiveness, developer capabilities, development tool effectiveness, and overall DevOps team efficiency.nearly) agrees that more frequent is better. Why? It means less waste, feedback on value sooner. Don’t wait 6 months to discover whether appropriate benefit came from the work.
  • #11 Frequently releasing is Change Volume Frequently releasing is only important if what you’re releasing is valuable. Dark launches can be a way to release small increments of larger features. only important if what you’re releasing is valuable. Dark launches can be a way to release small increments of larger features.
  • #12 Often described as “failure rate” Payal suggests that this metric should be reviewed together with change volume. “If the change volume is low or remained the same but the percent of failed deployments increased, then there may be a dysfunction somewher Success Rate (or Failure Rate) One of the main goals of DevOps is to turn rapid, frequent deployments into an everyday affair.  Needless to say, in order for such deployments to have value, the failure rate must be low.  It should, in fact, decrease over time, as the experience and capabilities of the DevOps teams increase.  An increasing failure rate, or one that is high and does not go down over time, is a good indication of problems in the overall DevOps process. e.”
  • #13 Don’t wait to measure real failure events! Use Chaos Monkey/Simian Army or other tools that simulate problems to measure your recovery capabilities. Why not MTBF? faster delivery means more opportunity for failures. They’re not inherently bad: what really counts is how you can react to them. I’d rather have 10 releases go with one failure but a quick recovery time than 2 releases with no failures Mean Time To Recover (MTTR) This is the time from a failure to recovery from that failure.  It’s generally a good measure of team capabilities, and like the failure rate, it should show an overall decrease over time (allowing for occasional longer recovery times when the team encounters a technically unfamiliar problem).  MTTR can also be affected by such things as code (or platform) complexity, the number of new features being implemented, and changes in the operating environment (such as migration to a new cloud server). Based on these metrics, the ideal DevOps team would produce frequent, rapid deployments with a low (and declining) failure rate and a short (and shrinking) recovery time.  In practice, of course, there may be factors which run counter to these trends  —  less need or opportunity for frequent deployments, for example, or frequent changes in operating conditions or requirements.  In general, however, these metrics do cover some of the most important performance issues in DevOps.
  • #15 From our webinar with Kurt Bittner, Forrester Research 1 Ron Kohavi and his collaborators have conducted long-term large-scale studies that show how poor people are at evaluating the value of ideas. For more information, see http://www.exp-platform.com/documents/exp_dmcasestudies.pdf, and http://www.exp-platform.com/Pages/ControlledExperimentsAtLargeScale.aspx.
  • #16 http://www.dailymail.co.uk/news/article-2126052/The-answer-rising-fuel-prices-Indian-family-fits-motorbike-s-space-dogs.html Combine Google Analytics results with your CD dashboard release history!
  • #17 PayPal suggests that this metric should be reviewed together with change volume. “If the change volume is low or remained the same but the percent of failed deployments increased, then there may be a dysfunction somewhere.” Isn’t this the realm of Product Managers? Sure! But remember, DevOps involves everyone. So a PM can be a driver of meaningful metrics for the rest of the DevOps oriented team.
  • #19 Morale – anonymous employee surveys. Do you have a NPS for your team?
  • #20 XebiaLabs – is focused on Enterprise DevOps. We are not yet a household name, but we have hundreds of Global 2000 clients - like American Express, Apple, Nike and KLM Airlines. We’re recognized as a #1 ranked technology by both Gartner and Forrester Research. Enterprises are now starting to embrace Continuous Deliver with about 8-10% transforming their businesses. What makes us unique is our laser focus on DevOps and Continuous delivery. We’ve been in the space for 5 years – well before the terms were widely recognized. We not only have the products to delivery at any scale, but we also have a staff FULL of industry experts ready to help coach our clients.
  • #21 Lots written about what to measure for DevOps. Finding the right balance of too few (sorry Dave Farley) and too many (dozens) is key. I’ll suggest these 5…