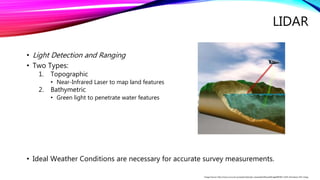
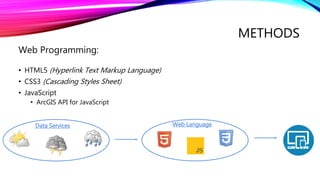
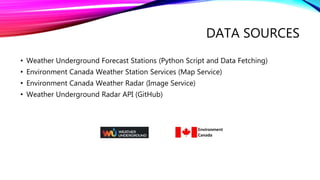
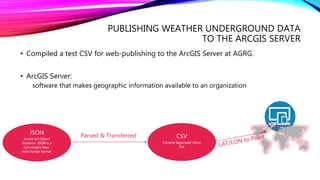
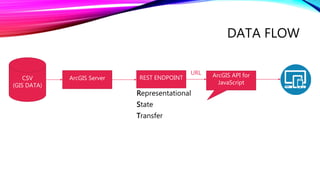
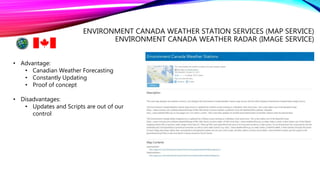
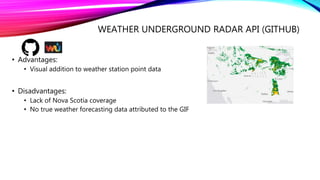
DEVELOPING A WEATHER FORECASTING
WEB-SERVICE USING ARCGIS FOR SERVER
AND ARCGIS API FOR JAVASCRIPT
By: Alexa Guertin
OUTLINE
• Who are The Applied Geomatics Research Group (AGRG)
• LiDAR Acquisition and Uses
• Project Purpose
• Methods:
• Web Programming
• Weather Forecasting Data
• Demo
• Goals Accomplished
• Future Possibilities
• Acknowledgements
APPLIED GEOMATICS RESEARCH GROUP
• Collaborative team of Research Scientists and Associates, and Graduate Students
• Research Specialization Include:
• Flood risk mapping
• Microclimate and agriculture
• Vegetation canopy
• Air quality monitoring
• Hydrology and river flooding
• Atlantic coastal plain flora
• Wetlands mapping and forest practices
• Health GIS applications
• Atlas of sustainable development
• Modeling coastal processes
LIDAR
• Light Detection and Ranging
• Two Types:
1. Topographic
• Near-Infrared Laser to map land features
2. Bathymetric
• Green light to penetrate water features
• Ideal Weather Conditions are necessary for accurate survey measurements.
Image Source: http://www.crcsi.com.au/assets/Uploads/_resampled/ResizedImage600363-LADS-Animation-Still-v3.jpg
PROJECT PURPOSE
• Design and develop a web-service that pulls together various weather forecasting
services to aid the AGRG staff in LiDAR survey planning.
Data
METHODS
• HTML5 (Hyperlink Text Markup Language)
• CSS3 (Cascading Styles Sheet)
• JavaScript
• ArcGIS API for JavaScript
Web Programming:
Data Services Web Language
WHY ARCGIS API FOR JAVASCRIPT?
• Flexibility
• Compatibility
• Sources and Documentation
• Community
DATA SOURCES
• Weather Underground Forecast Stations (Python Script and Data Fetching)
• Environment Canada Weather Station Services (Map Service)
• Environment Canada Weather Radar (Image Service)
• Weather Underground Radar API (GitHub)
WEATHER UNDERGROUND FORECAST STATIONS
(PYTHON SCRIPT AND DATA FETCHING)
• Python Script makes use of Weather Underground Application Program Interface to
pull weather forecast data from online services.
• Data Format:
JSON
JavaScript Object
Notation. JSON is a
lightweight data-
interchange format.
Parsed & Transferred CSV
Comma Separated Value
File
WU DATA FETCHING
• Still To do:
• Script to pull weather forecasting information from all WU stations in Nova Scotia.
• Data Normalization
• Windows task to update forecast data and ArcGIS Server.
PUBLISHING WEATHER UNDERGROUND DATA
TO THE ARCGIS SERVER
• Compiled a test CSV for web-publishing to the ArcGIS Server at AGRG.
• ArcGIS Server:
software that makes geographic information available to an organization
JSON
JavaScript Object
Notation. JSON is a
lightweight data-
interchange format.
Parsed & Transferred CSV
Comma Separated Value
File
DATA FLOW
Representational
State
Transfer
CSV
(GIS DATA)
ArcGIS Server REST ENDPOINT ArcGIS API for
JavaScript
URL
ARCGIS API FOR JAVASCRIPT
SAMPLE
URL REST Endpoint
Add Layer to Map
APP SAMPLE
ENVIRONMENT CANADA WEATHER STATION SERVICES (MAP SERVICE)
ENVIRONMENT CANADA WEATHER RADAR (IMAGE SERVICE)
• Advantage:
• Canadian Weather Forecasting
• Constantly Updating
• Proof of concept
• Disadvantages:
• Updates and Scripts are out of our
control
WEATHER UNDERGROUND RADAR API (GITHUB)
• Advantages:
• Visual addition to weather station point data
• Disadvantages:
• Lack of Nova Scotia coverage
• No true weather forecasting data attributed to the GIF
FUTURE POSSIBILITIES
• Continue to develop Python script for ArcGIS Server publishing and automated
updates.
• Data analysis to determine ideal LiDAR acquisition times
• Additional API’s
• Twitter Updates from Environment Canada (Weather Warnings)
• Multi-purpose application
• Survey Planning
• Weather Forecasting
REFLECTION
Goals Accomplished:
• Connection between AGRG’s weather forecast data download.
• Proof of Concept  Potential for Success
• API Connections from multiple sources
ACKNOWLEDGEMENTS
• Alastair MacDonald – Data Download
• Applied Geomatics Research Group Staff
• Mentor: David Kristiansen
• Technical Assistance: Nathan Kendall
• Supervisor: Candace MacDonald
• COGS Faculty:
• David MacLean for Project Panning Advice
• Kathleen Stewart for Web Development Courses

Developing a Weather Forecasting Web-Service using ArcGIS API for JavaScript

  • 1.
    DEVELOPING A WEATHERFORECASTING WEB-SERVICE USING ARCGIS FOR SERVER AND ARCGIS API FOR JAVASCRIPT By: Alexa Guertin
  • 2.
    OUTLINE • Who areThe Applied Geomatics Research Group (AGRG) • LiDAR Acquisition and Uses • Project Purpose • Methods: • Web Programming • Weather Forecasting Data • Demo • Goals Accomplished • Future Possibilities • Acknowledgements
  • 3.
    APPLIED GEOMATICS RESEARCHGROUP • Collaborative team of Research Scientists and Associates, and Graduate Students • Research Specialization Include: • Flood risk mapping • Microclimate and agriculture • Vegetation canopy • Air quality monitoring • Hydrology and river flooding • Atlantic coastal plain flora • Wetlands mapping and forest practices • Health GIS applications • Atlas of sustainable development • Modeling coastal processes
  • 4.
    LIDAR • Light Detectionand Ranging • Two Types: 1. Topographic • Near-Infrared Laser to map land features 2. Bathymetric • Green light to penetrate water features • Ideal Weather Conditions are necessary for accurate survey measurements. Image Source: http://www.crcsi.com.au/assets/Uploads/_resampled/ResizedImage600363-LADS-Animation-Still-v3.jpg
  • 5.
    PROJECT PURPOSE • Designand develop a web-service that pulls together various weather forecasting services to aid the AGRG staff in LiDAR survey planning. Data
  • 6.
    METHODS • HTML5 (HyperlinkText Markup Language) • CSS3 (Cascading Styles Sheet) • JavaScript • ArcGIS API for JavaScript Web Programming: Data Services Web Language
  • 7.
    WHY ARCGIS APIFOR JAVASCRIPT? • Flexibility • Compatibility • Sources and Documentation • Community
  • 8.
    DATA SOURCES • WeatherUnderground Forecast Stations (Python Script and Data Fetching) • Environment Canada Weather Station Services (Map Service) • Environment Canada Weather Radar (Image Service) • Weather Underground Radar API (GitHub)
  • 9.
    WEATHER UNDERGROUND FORECASTSTATIONS (PYTHON SCRIPT AND DATA FETCHING) • Python Script makes use of Weather Underground Application Program Interface to pull weather forecast data from online services. • Data Format: JSON JavaScript Object Notation. JSON is a lightweight data- interchange format. Parsed & Transferred CSV Comma Separated Value File
  • 10.
    WU DATA FETCHING •Still To do: • Script to pull weather forecasting information from all WU stations in Nova Scotia. • Data Normalization • Windows task to update forecast data and ArcGIS Server.
  • 11.
    PUBLISHING WEATHER UNDERGROUNDDATA TO THE ARCGIS SERVER • Compiled a test CSV for web-publishing to the ArcGIS Server at AGRG. • ArcGIS Server: software that makes geographic information available to an organization JSON JavaScript Object Notation. JSON is a lightweight data- interchange format. Parsed & Transferred CSV Comma Separated Value File
  • 12.
    DATA FLOW Representational State Transfer CSV (GIS DATA) ArcGISServer REST ENDPOINT ArcGIS API for JavaScript URL
  • 13.
    ARCGIS API FORJAVASCRIPT SAMPLE URL REST Endpoint Add Layer to Map
  • 14.
  • 15.
    ENVIRONMENT CANADA WEATHERSTATION SERVICES (MAP SERVICE) ENVIRONMENT CANADA WEATHER RADAR (IMAGE SERVICE) • Advantage: • Canadian Weather Forecasting • Constantly Updating • Proof of concept • Disadvantages: • Updates and Scripts are out of our control
  • 16.
    WEATHER UNDERGROUND RADARAPI (GITHUB) • Advantages: • Visual addition to weather station point data • Disadvantages: • Lack of Nova Scotia coverage • No true weather forecasting data attributed to the GIF
  • 17.
    FUTURE POSSIBILITIES • Continueto develop Python script for ArcGIS Server publishing and automated updates. • Data analysis to determine ideal LiDAR acquisition times • Additional API’s • Twitter Updates from Environment Canada (Weather Warnings) • Multi-purpose application • Survey Planning • Weather Forecasting
  • 18.
    REFLECTION Goals Accomplished: • Connectionbetween AGRG’s weather forecast data download. • Proof of Concept  Potential for Success • API Connections from multiple sources
  • 19.
    ACKNOWLEDGEMENTS • Alastair MacDonald– Data Download • Applied Geomatics Research Group Staff • Mentor: David Kristiansen • Technical Assistance: Nathan Kendall • Supervisor: Candace MacDonald • COGS Faculty: • David MacLean for Project Panning Advice • Kathleen Stewart for Web Development Courses

Editor's Notes

  • #4 The Applied Geomatics Research Group are a collaborative team of Research Scientist, Associates, and Graduate Students, applying an extensive variety of geomatics technologies to study environmental, health, and social issues. Their ongoing geographically based research applies to flood risk modeling, hydrology and river flooding, Atlantic coastal plain flora, wetlands mapping and modeling coastal processes, just to name a few. AGRG’s leading research practice involves the acquisition and use of LiDAR-based data.
  • #5 “LiDAR, which stands for Light Detection and Ranging, is a remote sensing method that uses light in the form of a pulsed laser to measure ranges from usually, an aircraft where a laser, scanner, and a specialized GPS receiver are stationed, to the Earth. Light pulses, combined with other data recorded by the airborne system – generate precise, three-dimensional information about the shape of the Earth and its surface characteristics. Two types of LiDAR currently in use by the AGRG are topographic and bathymetric. Topographic LiDAR typically uses a NIR laser to map the land, while bathymetric LiDAR uses water-penetrating green light to measure seafloor and riverbed elevations. The Applied Geomatics Research Group is responsible for topo-bathy LiDAR acquisition across the province of Nova Scotia and other places in Canada. A critical factor in LiDAR acquisition planning, is an accurate understanding in regional weather forecasting. To ensure an accurate survey, weather conditions must be ideal. For example, high wind speeds cause ripples to form on water features, thus causing a distortion in returned survey measurements. Nova Scotia, being a coastal region, has continually variable weather, making it difficult at times to acquire accurate weather forecasting information when planning LiDAR surveys.
  • #6 The project goal is to design and develop a web service that pulls together various weather forecasting source data to aid the AGRG staff in LiDAR survey planning. I wanted to bring together various weather services to ensure maximum station coverage and more options for the AGRG to implement in the future.
  • #7 The application is developed using a variety of web programming languages including: HTML stands for Hyper Text Markup Language. It is used to give websites structure with text, links, and images and in this case, a map. CSS stands for Cascading Style Sheets; it is used to change the appearance of HTML elements. JavaScript is the programming language used to create interactive functions; it gives an HTML web-page its functionality. In the case of this web-service, I am using a JavaScript library developed by ESRI; ArcGIS API for JavaScript. The ArcGIS API for JavaScript is a powerful library of web page functions, built to interact with an ArcGIS Server. I am using the combination of languages to speak to both the weather services and the application. Before we can appreciate how the languages speak to one another, it’s important to understand the data and services I am working with.
  • #10 At the beginning of the semester, the initial plan was to have my web-service display weather forecasting data pulled together by another student’s project. This student developed a python script to pull weather forecasting information from Weather Underground. Weather Underground is an American commercial online weather service, and it is unique in the fact that they provide a combination of National Weather Service Stations and Personal Weather Stations. We chose to work with Weather Underground data because of its broad area of coverage and the additional weather station information we might not be able to find through other sources. The script created to download WU data uses an Application Programming Interface, more commonly known as an (API), to call forecast data in a JSON format. The JSON file is then parsed, and written to a CSV file in the root folder. Due to time constraints and a slight underestimation of how long the data gathering and normalization would take, the data downloaded is not yet useable in my web-service.
  • #11 WING IT!
  • #12 Knowing that our initial data download concept could work, I decided to compile a test CSV with useable information and upload it to AGRG’s ArcGIS Server. Currently this isn’t a forecast but it is meant to demonstrate that a connection between the data downloaded and the web-service is possible. The ArcGIS Server is a software that makes geographic information available to an organization through the web. Geographic data is then accessed through a URL. Let’s take a closer look at the data flow from a CSV to a web-service.
  • #16 A map service pulling Environment Canada weather station information is currently available to the public through ESRI’s online services. An ESRI user developed a python and beautiful soup script that downloads weather forecast information from EC’s online weather services. Just like our initial approach, the script downloads wanted data; the data is then parsed and uploaded to an ArcSDE point feature class on a public ArcGIS Server. The service is updated by a Windows task, which is run once every hour. The EC weather station map service proves that our concept is useable and has the potential for success, but as previously mentioned there is still a lot of data gathering and normalization to be accomplished on AGRG’s end. A connection between the EC map service and the AGRG web service is possible through the use of ArcGIS API for JavaScript.
  • #17 A weather radar has also been incorporated to the web-service via a JavaScript API A free developer’s subscription with Weather Underground is needed to complete this task. The free subscription gives you a 3 hour radar forecast. I is just a weather radar, representing precipitation but it holds no significant forecast data; it is merely just for visualization purposes.