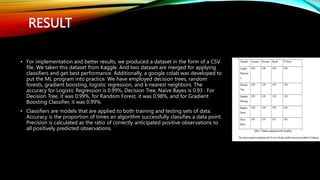
DETECTING FAKE NEWS ON
SOCIAL MEDIA
Nafim Hassan Pourno(ID:201-15-3510)
Habibur Rahman Ziad(ID:201-15-3541)
Ahmed Nihal(ID:201-15-3491)
CONTENT
• Introduction
• Major Problem
• Purpose
• Architecture
• Methodology
• Techniques
• Result
• Conclusion
• References
INTRODUCTION
• Fake news exist way before social media but it multifold when social media was
introduced
• Fake news is a news designed to deliberately spread hoaxes, propagenda and
disinformation
• Fake News Stories usually spread through social media sites like Facebook,
Twitter etc
BACKGROUND
• Social media is used for news reading
• Source of the news
• Proffession used to distribute the news in the past
• Nowadays , everybody wants to be a journalist .
• People are profiting by clickbaits and publishing fake news on online
• More clicks contribute to more money for content publishers.
MAJOR PROBLEMS
• By clicking on clickbait, users are led to page that contains false information.
• Fake news influences people’s preceptions.
• The rise of Fake news has become a global problem that even major tech companies like
Facebook and google are struggling to solve.It can be difficult to determine whether a text is
factual without additional context and human judgement
PURPOSE
• This project aims to develop a method for detecting classifying the news stories
using Natural Language Processing.
• The main goal is to indentify fake news, which is aclassic text classification issue.
• We gathered our data , preprocessed the text, and translated our articles into
supervised model feautures.
• Our goal is to develop a model that classifies a given news article as either fake or
trure.
DELIMITATIONS
• Our system does not guarantee 100% accuracy
• The system is unable to test data that is unrelated to the training database
TYPES OF FAKE NEWS
Visual based type
Visual based are mainly photoshopped images and videos which are
posted in social medias
Linguistic based type
Linguistic based are mainly the manipulation of text and string
content/ This isssues is with blogs , news , or emails
DATA SET
 Datasets are collected reaseech purposes with help of kaggole websites
 Our data is preleveled with fake and real news
 30% of the data is used for training the Ml Model
 70 of the data is used to test the model
WORKFLOW
• The steps in this procedure are as follows:
• Data set loading
• Data pre processing (remove stop words,
streaming, Drop duplicate and remove
meaningless char from the text.)
• Feauture Selection
• Applying Classifiication and model Consruction
• Classifying the new data
CONFUSION MATRIX
A confusion matrix is a table that is used to
define the performance of a classification
algorithm. A confusion matrix visualizes and
summarizes the performance of a
classification algorithm.
METHODOLOGY
1. Data collection
2. Data preprocessing
3. Model implementation
DATA COLLECTION
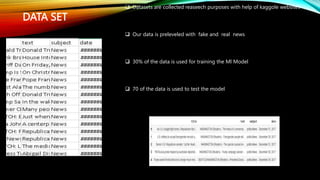
• In this paper, we used a dataset which collected from Kaggle[28].There are two dataset.
One of them includes real data, while the other ones contain fake data. True dataset
consists of 21417 data and Fake dataset consists of 23481 data.Title, text, subject, and
date are the four features present in both datasets. Text, Title and Subject which
attributes are contain qualitative data means all is textual data and Subject represent
categorical data.
DATA PREPROCESSING
• Both organized and unstructured data might be included. Unstructured data is that which does not adhere to all of the
grammar rules and may contain typos and slang. Structured data adheres to proper grammar standards. Both organized and
unstructured data do not produce the greatest outcomes. It is advisable to utilize data with a semi-structure. Data that is
partially organized but not completely unstructured is referred to as semi-structured data. It stands in between the two.We use
NLP.
• Eliminate punctuation
• Tokenization
• Stopwords
• Stemming
MODEL IMPLEMENTATION
• Logistic Regression
• Decision Tree
• Random Forest
• Gradient Boosting
• Naïve Bayes
 At present, one of the most popular methods is machine learning. First we taken a dataset for
implementation .But we need to modify this dataset before applying classifiers. There are two
dataset. Purpose of our work ,we need to merge our two dataset and also add a categorical
features (class) which make sure the news is true or fake. So, we preprocessing the data which
will eventually increase the performance of our model and the text data is converted into a
numerical vector during vectorization. After completing we applied some classifiers--
RESULT
• For implementation and better results, we produced a dataset in the form of a CSV
file. We taken this dataset from Kaggle. And two dataset are merged for applying
classifiers and get best performance. Additionally, a google colab was developed to
put the ML program into practice. We have employed decision trees, random
forests, gradient boosting, logistic regression, and k-nearest neighbors. The
accuracy for Logistic Regression is 0.99%, Decision Tree, NaĂŻve Bayes is 0.93 . For
Decision Tree, it was 0.99%, for Random Forest, it was 0.98%, and for Gradient
Boosting Classifier, it was 0.99%.
• Classifiers are models that are applied to both training and testing sets of data.
Accuracy is the proportion of times an algorithm successfully classifies a data point.
Precision is calculated as the ratio of correctly anticipated positive observations to
all positively predicted observations.
CONCLUSION
• All classifiers have these prediction values calculated, and the final percentage is determined
by averaging all of these prediction values. Using these metrics. In order to determine the
percentage of news that is accurate, we are setting a range. The news is being displayed first,
then the result, on the webserver we built. We used certain emoticons as a symbol to more
effectively display the results and draw users' attention. A platform-independent web server
has been developed. It implies that every configuration of the webserver will be device-
independent. We used Bootstrap to make our web server independent of hardware. The
resultant output takes the form of a message that varies depending on certain
percentages.These prediction values are computed for each classifier, and the final 97.8 % is
obtained by averaging all of these prediction values. These metrics are used. We are
establishing a range to determine the proportion of news that is accurate. On the webserver
we constructed, the news is displayed before the outcome. To capture users' attention and
more effectively convey the results, we employed specific emoticons as a sign. A web server
that works on any platform has been created. It indicates that each webserver setup will be
independent of the device. To make our web server independent of hardware, we used
Bootstrap. The output that results is a message that changes based on specific percentages.

Detecting fake news .pptx

  • 1.
    DETECTING FAKE NEWSON SOCIAL MEDIA Nafim Hassan Pourno(ID:201-15-3510) Habibur Rahman Ziad(ID:201-15-3541) Ahmed Nihal(ID:201-15-3491)
  • 2.
    CONTENT • Introduction • MajorProblem • Purpose • Architecture • Methodology • Techniques • Result • Conclusion • References
  • 3.
    INTRODUCTION • Fake newsexist way before social media but it multifold when social media was introduced • Fake news is a news designed to deliberately spread hoaxes, propagenda and disinformation • Fake News Stories usually spread through social media sites like Facebook, Twitter etc
  • 4.
    BACKGROUND • Social mediais used for news reading • Source of the news • Proffession used to distribute the news in the past • Nowadays , everybody wants to be a journalist . • People are profiting by clickbaits and publishing fake news on online • More clicks contribute to more money for content publishers.
  • 5.
    MAJOR PROBLEMS • Byclicking on clickbait, users are led to page that contains false information. • Fake news influences people’s preceptions. • The rise of Fake news has become a global problem that even major tech companies like Facebook and google are struggling to solve.It can be difficult to determine whether a text is factual without additional context and human judgement
  • 6.
    PURPOSE • This projectaims to develop a method for detecting classifying the news stories using Natural Language Processing. • The main goal is to indentify fake news, which is aclassic text classification issue. • We gathered our data , preprocessed the text, and translated our articles into supervised model feautures. • Our goal is to develop a model that classifies a given news article as either fake or trure.
  • 7.
    DELIMITATIONS • Our systemdoes not guarantee 100% accuracy • The system is unable to test data that is unrelated to the training database
  • 8.
    TYPES OF FAKENEWS Visual based type Visual based are mainly photoshopped images and videos which are posted in social medias Linguistic based type Linguistic based are mainly the manipulation of text and string content/ This isssues is with blogs , news , or emails
  • 9.
    DATA SET  Datasetsare collected reaseech purposes with help of kaggole websites  Our data is preleveled with fake and real news  30% of the data is used for training the Ml Model  70 of the data is used to test the model
  • 10.
    WORKFLOW • The stepsin this procedure are as follows: • Data set loading • Data pre processing (remove stop words, streaming, Drop duplicate and remove meaningless char from the text.) • Feauture Selection • Applying Classifiication and model Consruction • Classifying the new data
  • 11.
    CONFUSION MATRIX A confusionmatrix is a table that is used to define the performance of a classification algorithm. A confusion matrix visualizes and summarizes the performance of a classification algorithm.
  • 12.
    METHODOLOGY 1. Data collection 2.Data preprocessing 3. Model implementation
  • 13.
    DATA COLLECTION • Inthis paper, we used a dataset which collected from Kaggle[28].There are two dataset. One of them includes real data, while the other ones contain fake data. True dataset consists of 21417 data and Fake dataset consists of 23481 data.Title, text, subject, and date are the four features present in both datasets. Text, Title and Subject which attributes are contain qualitative data means all is textual data and Subject represent categorical data. DATA PREPROCESSING • Both organized and unstructured data might be included. Unstructured data is that which does not adhere to all of the grammar rules and may contain typos and slang. Structured data adheres to proper grammar standards. Both organized and unstructured data do not produce the greatest outcomes. It is advisable to utilize data with a semi-structure. Data that is partially organized but not completely unstructured is referred to as semi-structured data. It stands in between the two.We use NLP. • Eliminate punctuation • Tokenization • Stopwords • Stemming
  • 14.
    MODEL IMPLEMENTATION • LogisticRegression • Decision Tree • Random Forest • Gradient Boosting • Naïve Bayes  At present, one of the most popular methods is machine learning. First we taken a dataset for implementation .But we need to modify this dataset before applying classifiers. There are two dataset. Purpose of our work ,we need to merge our two dataset and also add a categorical features (class) which make sure the news is true or fake. So, we preprocessing the data which will eventually increase the performance of our model and the text data is converted into a numerical vector during vectorization. After completing we applied some classifiers--
  • 15.
    RESULT • For implementationand better results, we produced a dataset in the form of a CSV file. We taken this dataset from Kaggle. And two dataset are merged for applying classifiers and get best performance. Additionally, a google colab was developed to put the ML program into practice. We have employed decision trees, random forests, gradient boosting, logistic regression, and k-nearest neighbors. The accuracy for Logistic Regression is 0.99%, Decision Tree, Naïve Bayes is 0.93 . For Decision Tree, it was 0.99%, for Random Forest, it was 0.98%, and for Gradient Boosting Classifier, it was 0.99%. • Classifiers are models that are applied to both training and testing sets of data. Accuracy is the proportion of times an algorithm successfully classifies a data point. Precision is calculated as the ratio of correctly anticipated positive observations to all positively predicted observations.
  • 16.
    CONCLUSION • All classifiershave these prediction values calculated, and the final percentage is determined by averaging all of these prediction values. Using these metrics. In order to determine the percentage of news that is accurate, we are setting a range. The news is being displayed first, then the result, on the webserver we built. We used certain emoticons as a symbol to more effectively display the results and draw users' attention. A platform-independent web server has been developed. It implies that every configuration of the webserver will be device- independent. We used Bootstrap to make our web server independent of hardware. The resultant output takes the form of a message that varies depending on certain percentages.These prediction values are computed for each classifier, and the final 97.8 % is obtained by averaging all of these prediction values. These metrics are used. We are establishing a range to determine the proportion of news that is accurate. On the webserver we constructed, the news is displayed before the outcome. To capture users' attention and more effectively convey the results, we employed specific emoticons as a sign. A web server that works on any platform has been created. It indicates that each webserver setup will be independent of the device. To make our web server independent of hardware, we used Bootstrap. The output that results is a message that changes based on specific percentages.