Downloaded 10 times

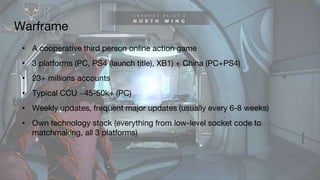
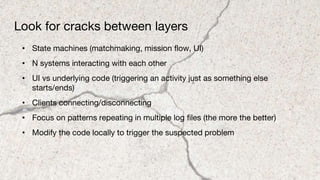

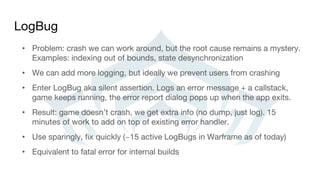
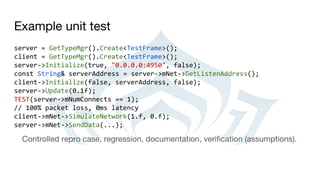
![Crash report - dumps
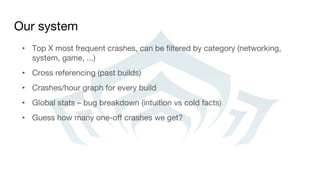
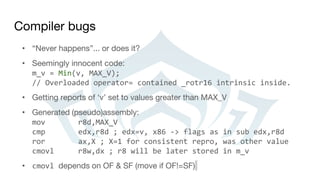
• Know your assembly (x64 tends to be easier to investigate, more registers).
See [Ruskin11]
• Immediate Window to the rescue (> + command, e.g. >~kb for callstacks for
all threads)
• Spider sense (e.g. reallocating std::vector while iterating)](https://image.slidesharecdn.com/debuggingmultiplayergames-160804231630/85/Debugging-multiplayer-games-15-320.jpg)
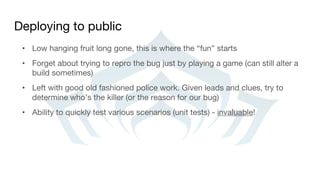

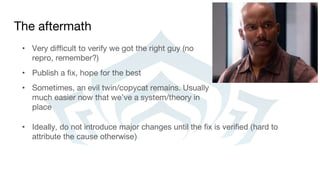
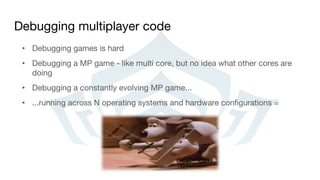
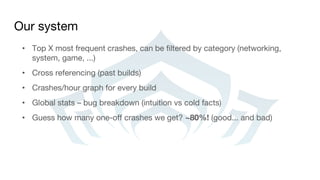
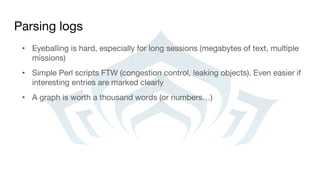
![Compiler bugs… and CPU differences
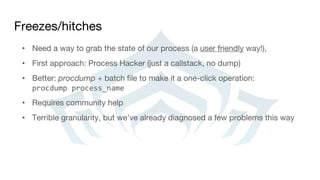
ROR instruction + the overflow flag:
• Different behavior on different CPUs. i5-3320m laptop and i7-850 are “fine”,
i7 2600k would modify the OF flag.
• VS 2010, seems to be fixed in VS2012
The OF flag is defined only for the 1-bit rotates; it is undefined in all other cases [...] For right rotates, the
OF flag is set to the exclusive OR of the two most-significant bits of the result. (Intel 64 and IA-32
Architectures Software Developer’s Manual, vol 2B)](https://image.slidesharecdn.com/debuggingmultiplayergames-160804231630/85/Debugging-multiplayer-games-27-320.jpg)
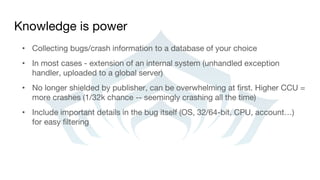
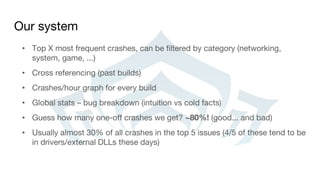
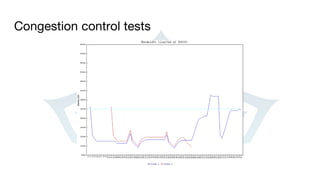
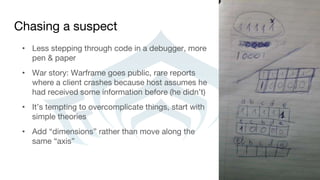
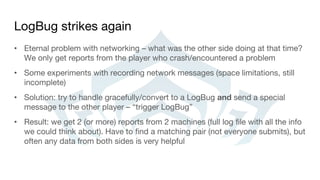
![Third party libraries/external DLLs
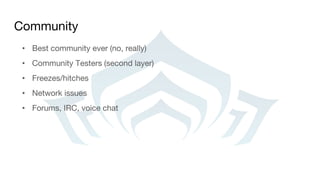
• Mostly beyond our control, but users blame you anyway (not your fault, but
your problem)
• Third party libs: report a problem, wait for a new version
• External app: report a problem, detect and inform (video card software,
various overlays)
• Also: early console SDKs (especially paths less traveled). Staring at assembly
code again
• If you’re feeling brave, other options exhausted and you’re really bored:
patching binaries by hand ([Sinilo13])](https://image.slidesharecdn.com/debuggingmultiplayergames-160804231630/85/Debugging-multiplayer-games-30-320.jpg)


![References
• [Ruskin11] Ruskin, E. Forensic Debugging (GDC 2011)
• [Sinilo13] Sinilo M., Patching binaries: http://msinilo.pl/blog/?p=1215](https://image.slidesharecdn.com/debuggingmultiplayergames-160804231630/85/Debugging-multiplayer-games-34-320.jpg)


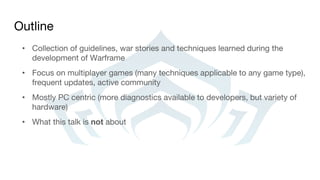
The document outlines guidelines and techniques for debugging multiplayer games, with a focus on the game Warframe, covering the challenges of maintaining a stable online experience across multiple platforms. It emphasizes the importance of collecting and analyzing bug reports and crash data to improve software reliability, as well as strategies for addressing common issues in game code. Additionally, it highlights the value of community involvement in identifying and resolving problems and the need for thorough documentation and testing practices.