Download to read offline

![Methodology
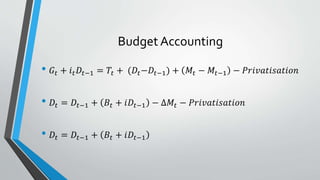
Both approaches involve Budget Constraint
• Derive necessary condition
[Mahmood and Rauf] r > g or r < g
• Derive Sufficient Condition
Accounting
Approach
• Econometric Estimation (Hamilton
and Flavin)
• Non-Ponzi Game Condition
PresentValue
Approach](https://image.slidesharecdn.com/debtsustainability-160926130915/85/Debt-sustainability-6-320.jpg)
![SustainableDebtThresholds
Institutions PV Debt/
Exports
PV Debt/
Revenue
Additional Criteria
HIPC (2004) 150 250 Debt servicing / Exports ratio is 15-20%
DRI 140 151 Debt Servicing / Exports ratio is 12%
and Debt Servicing / Revenue ratio is
13 %
IMF 180 201 PV/GDP is 42% and Debt
Servicing/Revenue is 30%
World Bank
(2004)
190 189 [PV/Exports is 220% and PV/GNI is 80
%]* [Also Debt stock/GDP is 50%, Debt
stock/ Exports is 275%, Debt
Servicing/Exports is 30%]**
CIPA Index
Poor/mediu
m/
strong
Poor/medium/
Strong
Debt servicing as 15, 20 and 25 % of
exports for poor, medium and strong
institutions
100/150/200 200/250/300 Debt servicing as 25, 30 and 35 % of
revenue for poor, medium and strong
institutions](https://image.slidesharecdn.com/debtsustainability-160926130915/85/Debt-sustainability-7-320.jpg)
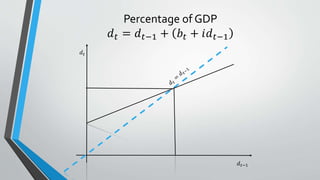
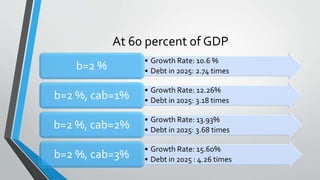
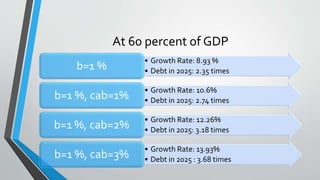

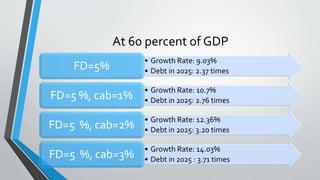
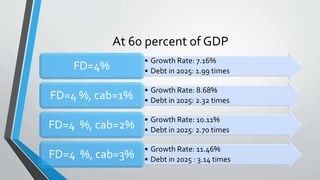

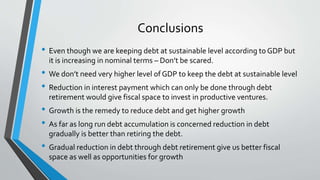

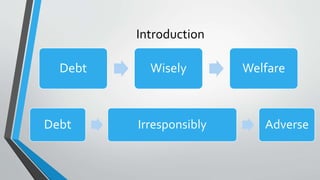
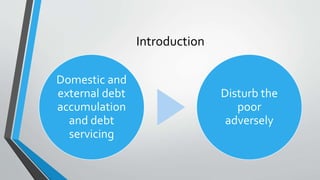
This document analyzes debt sustainability in Pakistan. It defines debt sustainability as a country's ability to meet current and future debt obligations without defaulting or compromising economic growth. The methodology examines both budget accounting and present value approaches. Sustainable debt thresholds are presented from various institutions, with thresholds ranging from 150-200% of exports to 180-220% of GDP. The analysis then models Pakistan's debt at 60% of GDP under varying budget balance and growth rate assumptions, finding the debt would increase by 2-4.26 times by 2025 depending on the scenario. It concludes gradual debt reduction through retirement provides better fiscal space and growth opportunities than immediate retirement.