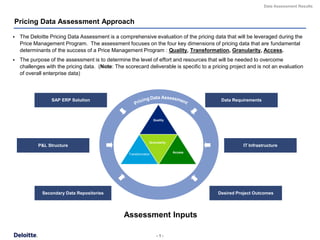
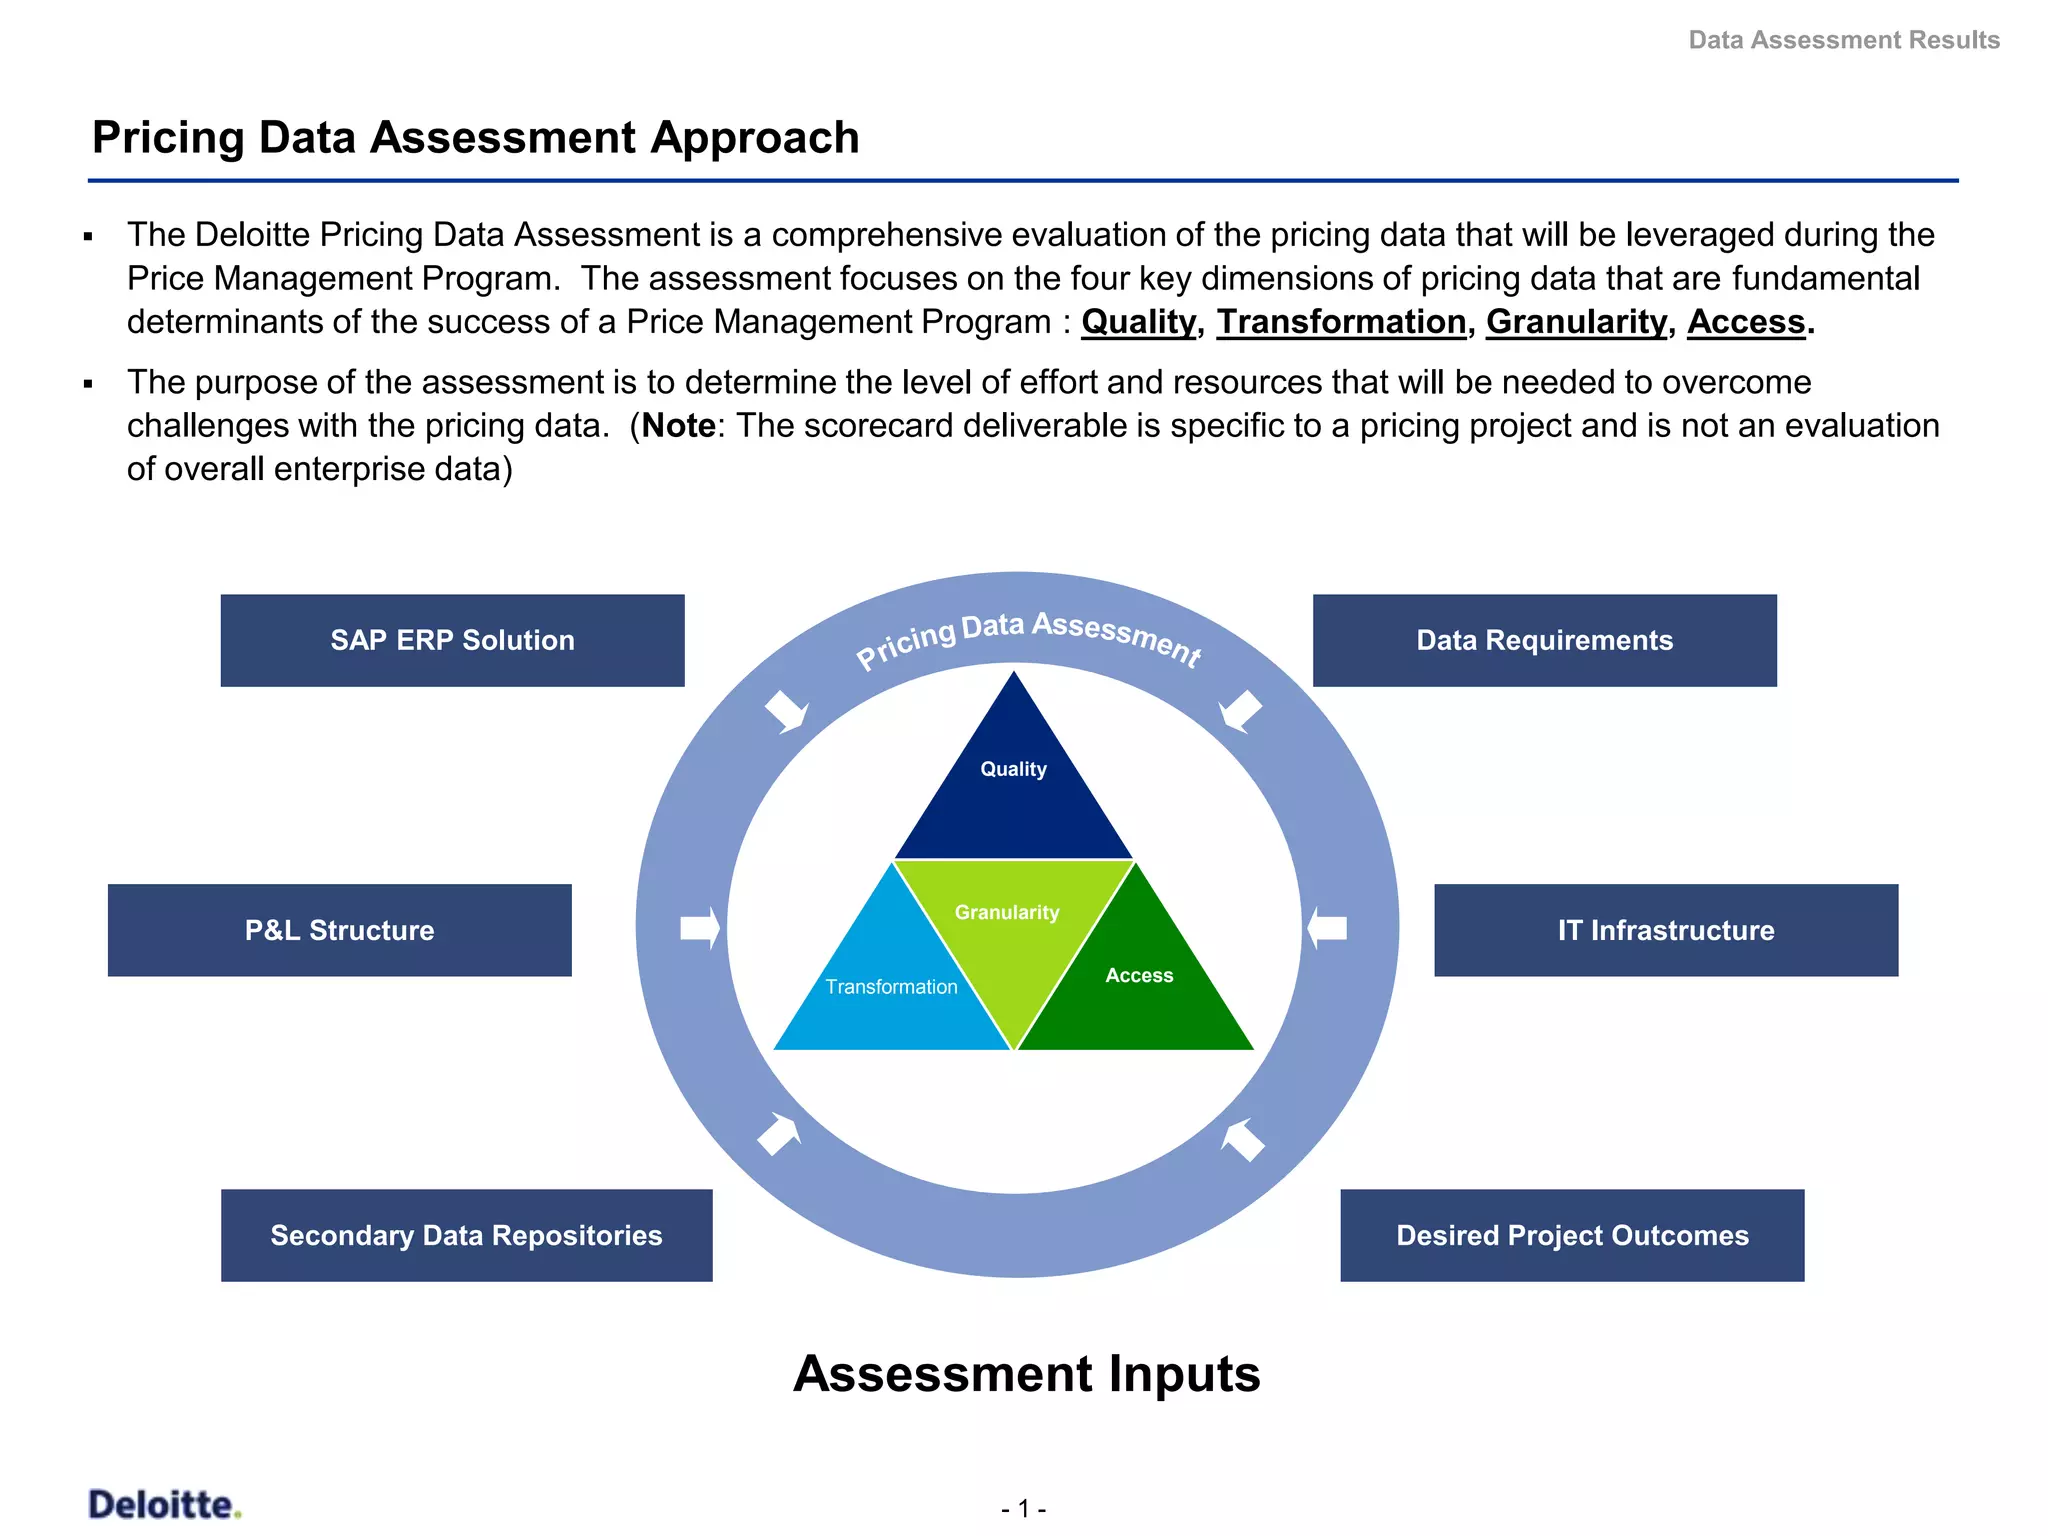
The document summarizes the results of an assessment of a company's pricing data across four key dimensions: quality, transformation, granularity, and accessibility. The assessment identified various challenges with the data, including a lack of customer hierarchy data, data quality issues requiring transformation, and inconsistencies between the data and financial statements. Scores were provided on a scale of 0 to 9 for each business department. The quality dimension received the lowest scores overall, indicating that improving data quality will be important for a successful pricing program.
![Data Assessment Results
Pricing Data Assessment
The process for conducting a Pricing Data Assessment involves an evaluation of a representative sample of pricing-related
data from all businesses across multiple dimensions and regions. The goal of the assessment is to understand the current
state of pricing data to enable more accurate scoping and planning.
Identify Pricing Extract and Validate
Identify Data Sources Assess Data
Data Requirements Sample Data
Create a list of data required Isolate sources of data for Extract sample data from Assess quality, accessibility,
to meet the pricing needs of each business and region identified sources for each granularity and
the business business and region transformation of data to be
Document data availability used for price management
TPA / Proof-of- Validate extracts against
Concept Identify who originates and financial statements Document assessment for
manages the data each business and region
Segmentation – User input Ensure completeness and
consistency of data extracts
Optimization – Database extract
– Extraction process
Based on data specifications
from [vendor] interfaces and
functionality
Driven by waterfall design
and potential dimensions of
analysis
1 week 1 week 1 week
-2-](https://image.slidesharecdn.com/dcom-be-en-data-assessment-approach-110118092953-phpapp02/85/Dcom-be-en-data-assessment-approach-2-320.jpg)
![Data Assessment Results
Pricing Data Assessment Summary
High Level Findings Supporting Information
Quality [Department 1] [Department 2]
Assessment Score
Low (0-3) Data within [tool x] is Data and operational
necessary for allocation and complexity indicated by x-
Average (3-6) will complicate the integration xxxX more records per $1MM
High (6-9) with a second interface revenue and x.x-y.yX more
records per billing line item
Lack of customer hierarchy
data will present biggest xx% variance in transactions
Transformation Access challenge within [department1] vs. P&L may indicate need for
due to proliferated ship-to’s modified extraction process
There are many large and Lack of attribute field usage
complex CTS elements and ―Nulls‖ add complexity
Assessment Score: 4.6 Assessment Score: 2.7
Granularity
[Department 3] [Department 4]
LB PMD PGG ELE
Low number of very high Appears to be the easiest
Single global SAP deployment for 95-97% of business (all in- revenue transactions may division to implement
scope areas) supports consistent data structure limit effectiveness of
Low number of very large
There is very granular information for transactional pricing, but transactional analysis
customers enables rich
detailed cost breakouts and cost-to-serve allocations will require
Highest proportion of standard hierarchy and segmentation
significant data transformation
cost indicates there will be
A detailed review of the extracted data revealed a number of Low number of transactions
more complex allocations
and revenue may limit
areas where the data was inconsistent with expectations
Material master complexity will effectiveness of transactional
− E.g., Revenue was matched to the P&L +/-6%; however, be prevalent given that analysis and reduce
the deviations within individual sales orgs and profit centers [department 3] has 2-5X more opportunity size
may indicate the extracted data lacks certain in-scope areas base materials
Assessment Score: 6.4
− Limited usage of product and customer segmentation fields Assessment Score: 5.4
-3-](https://image.slidesharecdn.com/dcom-be-en-data-assessment-approach-110118092953-phpapp02/85/Dcom-be-en-data-assessment-approach-3-320.jpg)
![Data Assessment Results
Assessment Scorecard: Pricing Data Quality Dimension
Business Unit Assessment Score *
Dimension Criteria Weight Summary Findings [Dep1] [Dep2] [Dep3] [Dep4]
+ Deloitte and [vendor] Data requests mapped to SAP tables
+ Three month extract pulled from ODS Pricing table, Rental
revenue waterfall SAP transaction, customer master, material
Completeness 25% master, and reference look-up tables 9 9 3 9
− Missing transactional revenue for [dep3](e.g., prepaid contracts)
− Did not receive receivables data or contract data
− Transaction fields with values not included in look-up tables
− P&L revenue matched transaction revenue +6% but [dep3] is
Pricing off by xx% and there are instances of significant variation by
Data Accuracy 20% sales org and profit center 9 3 1 9
Quality + Updates are made as separate correction entries vs. changes
− Customer and Material proliferation / duplication across
Duplication 20% 3 3 1 3
different Sales Orgs will make analysis more complex
―Ability to use
current − 140+ SOs with potentially inconsistent use of discrete pricing
captured data processes . Measurement of true discount will be complex.
within a pricing Consistency 15% − [dep3] has different processes that affects field usage (e.g., 3 3 1 3
transformation 69% of customers have ―No Segment‖ when references
— not industry)
incorrectness‖ − List price field doesn’t always represent true list price; is used
for ―goal seek‖ purposes
Integrity 15% 3 3 1 3
− The extract process for rental revenue provides different fields
from ODS extract, adds complexity to future data pulls
+ Base Unit of Measure is foundation in SAP
− NULL values in the transaction data will require cleansing
Conformity 5% 9 9 3 9
− Exchange rate and rental discount fields are stored as text
− Leading zeros were lost in some extracts, requires cleansing
*Score: 6.0 4.8 1.6 6.0
1 (Low): Significantly more effort will be required
3 (Average): Average level of effort will be required
9 (High): Less than average effort will be required
-4-](https://image.slidesharecdn.com/dcom-be-en-data-assessment-approach-110118092953-phpapp02/85/Dcom-be-en-data-assessment-approach-4-320.jpg)
![Data Assessment Results
Assessment Scorecard: Pricing Data Access Dimension
Business Unit Assessment Score *
Dimension Criteria Weight Summary Findings [Dep1] [Dep2] [Dep3] [Dep4]
+ Single global SAP deployment for 95-97% of business (all in-
scope areas) supports consistent data structures
+ Single SQL dB platform across all applications
Data Sources 30% − Detailed distribution data is maintained in [tool] which is a full 1 9 3 9
secondary interface
− Data extracted for assessment indicates additional complexity
in the underlying data sources for [dep3] transactions
Pricing + Extraction from R1 data cube allows for increased performance
Data Ease of + BW & ODS should contain the level of detail for most of the
25% 3 9 9 9
Access Extraction extracts This will mean good performance
+ Uniform extraction tools for SQL-based platform
− SQL queries and scripts are ad-hoc / manual but have been
―Accessibility
documented and stored
for IT resources
to extract Sustainability 20% − Working with European resources will require additional 9 9 3 9
necessary data logistical support during the course of the project
specific to a + Logistics has run monthly reports to collect [tool] data
pricing + Closing process takes five work days at the end of every month
transformation‖
Timeliness 10% + Copy of the production (R1) is refreshed weekly 9 9 3 9
− Stored procedures can take very long to run for waterfall data
− Special access was required to pull information from certain
environments, which may slow down data extraction
Security 10% 3 3 3 3
− Sales Orgs and Finance will need to allow clear communication
with the team about P&L data
− Certain information is not included in ODS table (e.g.,
Sequence 5% 9 9 9 9
intercompany drop ship ) and may need to be added
4.1 8.0 4.4 8.0
*Score:
1 (Low): Significantly more effort will be required
3 (Average): Average level of effort will be required
9 (High): Less than average effort will be required
-5-](https://image.slidesharecdn.com/dcom-be-en-data-assessment-approach-110118092953-phpapp02/85/Dcom-be-en-data-assessment-approach-5-320.jpg)
![Data Assessment Results
Assessment Scorecard: Pricing Data Granularity Dimension
Business Unit Assessment Score *
Dimension Criteria Weight Summary Findings [Dep1] [Dep2] [Dep3] [Dep4]
− COGS is often allocated using reference plant vs. mfg plant
+ Rich data is collected from 3rd party carriers
Cost Information 30% − Rental transactions do not include any cost information 9 9 3 9
− Lack general ledger level cost information
− Fixed/Variable breakout and detailed cost build-up are tracked
− SAP conditions types necessitates tribal knowledge to interpret
Interpretability 20% 3 3 3 3
+ ―Condition class‖ field helps understand the condition types
− Distribution costs in [tool] will complicate the process of building
Pricing Format 15% the CTS component build. 1 3 3 3
Data − Payment information will be tied to invoice number vs. line item
Granularity − Where NRP is used, it does not always reflect a ―true list price‖
− Specific reasons for price determination can not be identified in
the data (e.g., reference price, market discount, geographic
―Level of detail Price Information 15% discount, customer discount) 1 1 1 1
needed for − Quantity Tier Groupings can complicate transaction data
transaction
+ Free of charge Items flagged in sales doc item category field
level analysis‖
− Proliferation of customer sold-to’s not part of a single hierarchy
across sales organizations
Hierarchy
15% − Rep/customer relationship is mostly static, but they do realign 3 1 1 9
Information
some times which will affect sales incentive data
+ ―Same-as‖ materials can be identified using base material
+ Surcharges can be identified through specific condition types
Fees and − Associating fees to transaction lines will be complex for [dep3]
5% 9 9 3 9
Services − There is a fee that can be charged for ―order only‖ customers
(i.e., without telemetry) but not always used
*Score: 4.5 4.5 2.4 5.7
1 (Low): Significantly more effort will be required
3 (Average): Average level of effort will be required
9 (High): Less than average effort will be required
-6-](https://image.slidesharecdn.com/dcom-be-en-data-assessment-approach-110118092953-phpapp02/85/Dcom-be-en-data-assessment-approach-6-320.jpg)
![Data Assessment Results
Assessment Scorecard: Pricing Data Transformation Dimension
Business Unit Assessment Score *
Dimension Criteria Weight Summary Findings [Dep1] [Dep2] [Dep3] [Dep4]
− SAP condition types require tribal knowledge to unify
customers, materials, etc.
− AP Cancel invoices need to be transformed to find
Unification 40% corresponding debit, may span across time periods 3 3 1 3
− Creating single transaction set for rental will be complex
− Have to convert to USD when extracting raw data
+ Quantity of conditions within one invoice line item may expedite
waterfall development
+ Information for customer cost-to-serve is tracked in SAP
Pricing Allocations 30% 3 3 3 3
− Allocations within CO-PA are at various aggregate levels
Data
− Agent commissions are paid at the end of time period and aren’t
Transform- tied back to a sales transaction (mechanics are stored in SAP)
ation
− Insufficient decimals in SAP requires extra business logic
− Dates are formatted as text; requires cleansing for consistency
Ease of
―How close is 10% − [dep3] has 20-250X more data records per $1MM revenue 3 9 1 9
Manipulation
the raw data to relative to other business units and 1.5 -4.5 more data records
a price per billing line item, adds complexity to waterfall manipulation
waterfall‖ + Because of the diversity within condition types + the standard
SAP implementation exclusions seem predictable
Exclusions 10% 3 3 3 3
+ Intercompany transactions can be identified for exclusion
− Healthcare transaction may be difficult to identify
− Cost data is only updated annually, but index fluctuates often
Decision Support 5% − Similar materials are not tied to a common base product 1 3 3 3
+ Manual changes can be identified at the transaction level
− Rental transactions have a prior transaction dependency that
Relevancy 5% 9 9 1 9
drive a change in current transaction profitability
*Score: 3.2 3.9 1.9 3.9
1 (Low): Significantly more effort will be required
3 (Average): Average level of effort will be required
9 (High): Less than average effort will be required -7-](https://image.slidesharecdn.com/dcom-be-en-data-assessment-approach-110118092953-phpapp02/85/Dcom-be-en-data-assessment-approach-7-320.jpg)