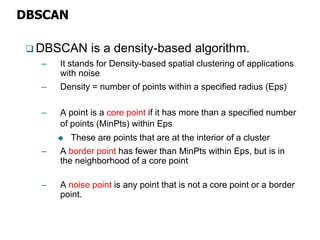
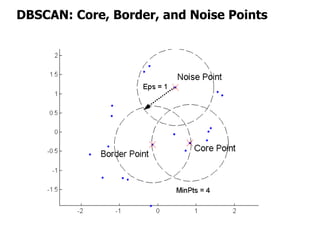
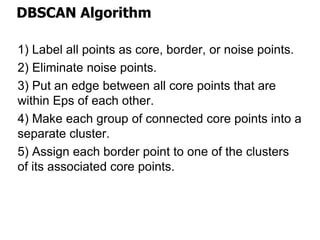
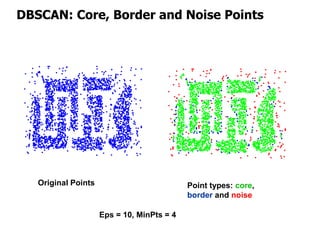
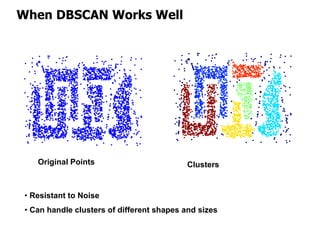
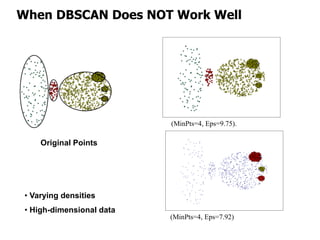
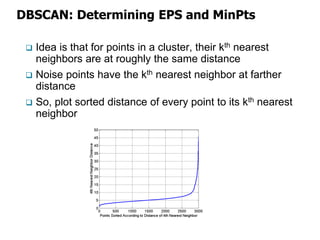
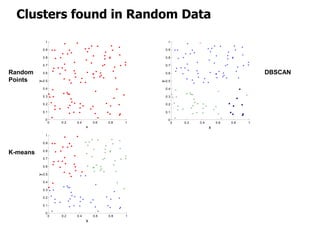
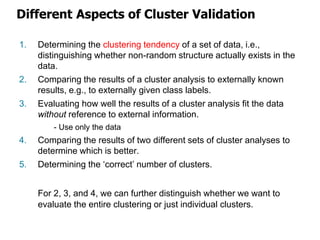
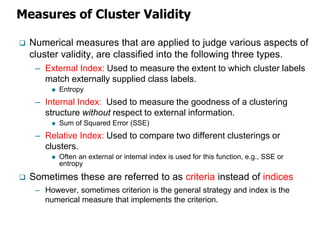
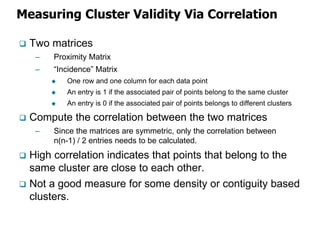
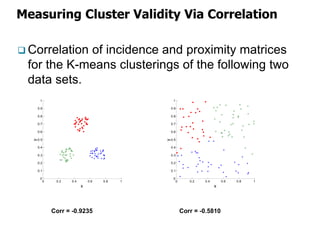
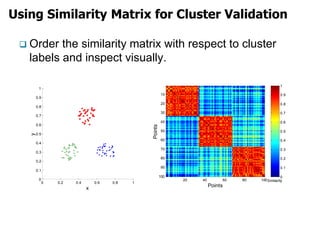
DATA MINING
MTL 782
OVERVIEW
● DBSCAN clustering algorithm
● Methods for Cluster Validity
DBSCAN
 DBSCAN is a density-based algorithm.
– It stands for Density-based spatial clustering of applications
with noise
– Density = number of points within a specified radius (Eps)
– A point is a core point if it has more than a specified number
of points (MinPts) within Eps
 These are points that are at the interior of a cluster
– A border point has fewer than MinPts within Eps, but is in
the neighborhood of a core point
– A noise point is any point that is not a core point or a border
point.
DBSCAN: Core, Border, and Noise Points
DBSCAN Algorithm
1) Label all points as core, border, or noise points.
2) Eliminate noise points.
3) Put an edge between all core points that are
within Eps of each other.
4) Make each group of connected core points into a
separate cluster.
5) Assign each border point to one of the clusters
of its associated core points.
DBSCAN: Core, Border and Noise Points
Original Points Point types: core,
border and noise
Eps = 10, MinPts = 4
When DBSCAN Works Well
Original Points Clusters
• Resistant to Noise
• Can handle clusters of different shapes and sizes
When DBSCAN Does NOT Work Well
Original Points
(MinPts=4, Eps=9.75).
(MinPts=4, Eps=7.92)
• Varying densities
• High-dimensional data
DBSCAN: Determining EPS and MinPts
 Idea is that for points in a cluster, their kth nearest
neighbors are at roughly the same distance
 Noise points have the kth nearest neighbor at farther
distance
 So, plot sorted distance of every point to its kth nearest
neighbor
Cluster Validity
 For supervised classification we have a variety of
measures to evaluate how good our model is
 Entropy, Purity
 For cluster analysis, the analogous question is how to
evaluate the “goodness” of the resulting clusters?
 But “clusters are in the eye of the beholder”!
 Then why do we want to evaluate them?
– To avoid finding patterns in noise
– To compare clustering algorithms
– To compare two sets of clusters
– To compare two clusters
Clusters found in Random Data
0 0.2 0.4 0.6 0.8 1
0
0.1
0.2
0.3
0.4
0.5
0.6
0.7
0.8
0.9
1
x
y
Random
Points
0 0.2 0.4 0.6 0.8 1
0
0.1
0.2
0.3
0.4
0.5
0.6
0.7
0.8
0.9
1
x
y
K-means
0 0.2 0.4 0.6 0.8 1
0
0.1
0.2
0.3
0.4
0.5
0.6
0.7
0.8
0.9
1
x
y
DBSCAN
1. Determining the clustering tendency of a set of data, i.e.,
distinguishing whether non-random structure actually exists in the
data.
2. Comparing the results of a cluster analysis to externally known
results, e.g., to externally given class labels.
3. Evaluating how well the results of a cluster analysis fit the data
without reference to external information.
- Use only the data
4. Comparing the results of two different sets of cluster analyses to
determine which is better.
5. Determining the ‘correct’ number of clusters.
For 2, 3, and 4, we can further distinguish whether we want to
evaluate the entire clustering or just individual clusters.
Different Aspects of Cluster Validation
 Numerical measures that are applied to judge various aspects of
cluster validity, are classified into the following three types.
– External Index: Used to measure the extent to which cluster labels
match externally supplied class labels.
 Entropy
– Internal Index: Used to measure the goodness of a clustering
structure without respect to external information.
 Sum of Squared Error (SSE)
– Relative Index: Used to compare two different clusterings or
clusters.
 Often an external or internal index is used for this function, e.g., SSE or
entropy
 Sometimes these are referred to as criteria instead of indices
– However, sometimes criterion is the general strategy and index is the
numerical measure that implements the criterion.
Measures of Cluster Validity
 Two matrices
– Proximity Matrix
– “Incidence” Matrix
 One row and one column for each data point
 An entry is 1 if the associated pair of points belong to the same cluster
 An entry is 0 if the associated pair of points belongs to different clusters
 Compute the correlation between the two matrices
– Since the matrices are symmetric, only the correlation between
n(n-1) / 2 entries needs to be calculated.
 High correlation indicates that points that belong to the
same cluster are close to each other.
 Not a good measure for some density or contiguity based
clusters.
Measuring Cluster Validity Via Correlation
 Correlation of incidence and proximity matrices
for the K-means clusterings of the following two
data sets.
0 0.2 0.4 0.6 0.8 1
0
0.1
0.2
0.3
0.4
0.5
0.6
0.7
0.8
0.9
1
x
y
0 0.2 0.4 0.6 0.8 1
0
0.1
0.2
0.3
0.4
0.5
0.6
0.7
0.8
0.9
1
x
y
Corr = -0.9235 Corr = -0.5810
 Order the similarity matrix with respect to cluster
labels and inspect visually.
Using Similarity Matrix for Cluster Validation
0 0.2 0.4 0.6 0.8 1
0
0.1
0.2
0.3
0.4
0.5
0.6
0.7
0.8
0.9
1
x
y
Points
Points
20 40 60 80 100
10
20
30
40
50
60
70
80
90
100
Similarity
0
0.1
0.2
0.3
0.4
0.5
0.6
0.7
0.8
0.9
1

dbscan clusteringdbscan clusteringdbscan clusteringdbscan clustering.pdf

  • 1.
  • 2.
    OVERVIEW ● DBSCAN clusteringalgorithm ● Methods for Cluster Validity
  • 3.
    DBSCAN  DBSCAN isa density-based algorithm. – It stands for Density-based spatial clustering of applications with noise – Density = number of points within a specified radius (Eps) – A point is a core point if it has more than a specified number of points (MinPts) within Eps  These are points that are at the interior of a cluster – A border point has fewer than MinPts within Eps, but is in the neighborhood of a core point – A noise point is any point that is not a core point or a border point.
  • 4.
    DBSCAN: Core, Border,and Noise Points
  • 5.
    DBSCAN Algorithm 1) Labelall points as core, border, or noise points. 2) Eliminate noise points. 3) Put an edge between all core points that are within Eps of each other. 4) Make each group of connected core points into a separate cluster. 5) Assign each border point to one of the clusters of its associated core points.
  • 6.
    DBSCAN: Core, Borderand Noise Points Original Points Point types: core, border and noise Eps = 10, MinPts = 4
  • 7.
    When DBSCAN WorksWell Original Points Clusters • Resistant to Noise • Can handle clusters of different shapes and sizes
  • 8.
    When DBSCAN DoesNOT Work Well Original Points (MinPts=4, Eps=9.75). (MinPts=4, Eps=7.92) • Varying densities • High-dimensional data
  • 9.
    DBSCAN: Determining EPSand MinPts  Idea is that for points in a cluster, their kth nearest neighbors are at roughly the same distance  Noise points have the kth nearest neighbor at farther distance  So, plot sorted distance of every point to its kth nearest neighbor
  • 10.
    Cluster Validity  Forsupervised classification we have a variety of measures to evaluate how good our model is  Entropy, Purity  For cluster analysis, the analogous question is how to evaluate the “goodness” of the resulting clusters?  But “clusters are in the eye of the beholder”!  Then why do we want to evaluate them? – To avoid finding patterns in noise – To compare clustering algorithms – To compare two sets of clusters – To compare two clusters
  • 11.
    Clusters found inRandom Data 0 0.2 0.4 0.6 0.8 1 0 0.1 0.2 0.3 0.4 0.5 0.6 0.7 0.8 0.9 1 x y Random Points 0 0.2 0.4 0.6 0.8 1 0 0.1 0.2 0.3 0.4 0.5 0.6 0.7 0.8 0.9 1 x y K-means 0 0.2 0.4 0.6 0.8 1 0 0.1 0.2 0.3 0.4 0.5 0.6 0.7 0.8 0.9 1 x y DBSCAN
  • 12.
    1. Determining theclustering tendency of a set of data, i.e., distinguishing whether non-random structure actually exists in the data. 2. Comparing the results of a cluster analysis to externally known results, e.g., to externally given class labels. 3. Evaluating how well the results of a cluster analysis fit the data without reference to external information. - Use only the data 4. Comparing the results of two different sets of cluster analyses to determine which is better. 5. Determining the ‘correct’ number of clusters. For 2, 3, and 4, we can further distinguish whether we want to evaluate the entire clustering or just individual clusters. Different Aspects of Cluster Validation
  • 13.
     Numerical measuresthat are applied to judge various aspects of cluster validity, are classified into the following three types. – External Index: Used to measure the extent to which cluster labels match externally supplied class labels.  Entropy – Internal Index: Used to measure the goodness of a clustering structure without respect to external information.  Sum of Squared Error (SSE) – Relative Index: Used to compare two different clusterings or clusters.  Often an external or internal index is used for this function, e.g., SSE or entropy  Sometimes these are referred to as criteria instead of indices – However, sometimes criterion is the general strategy and index is the numerical measure that implements the criterion. Measures of Cluster Validity
  • 14.
     Two matrices –Proximity Matrix – “Incidence” Matrix  One row and one column for each data point  An entry is 1 if the associated pair of points belong to the same cluster  An entry is 0 if the associated pair of points belongs to different clusters  Compute the correlation between the two matrices – Since the matrices are symmetric, only the correlation between n(n-1) / 2 entries needs to be calculated.  High correlation indicates that points that belong to the same cluster are close to each other.  Not a good measure for some density or contiguity based clusters. Measuring Cluster Validity Via Correlation
  • 15.
    Measuring Cluster ValidityVia Correlation  Correlation of incidence and proximity matrices for the K-means clusterings of the following two data sets. 0 0.2 0.4 0.6 0.8 1 0 0.1 0.2 0.3 0.4 0.5 0.6 0.7 0.8 0.9 1 x y 0 0.2 0.4 0.6 0.8 1 0 0.1 0.2 0.3 0.4 0.5 0.6 0.7 0.8 0.9 1 x y Corr = -0.9235 Corr = -0.5810
  • 16.
     Order thesimilarity matrix with respect to cluster labels and inspect visually. Using Similarity Matrix for Cluster Validation 0 0.2 0.4 0.6 0.8 1 0 0.1 0.2 0.3 0.4 0.5 0.6 0.7 0.8 0.9 1 x y Points Points 20 40 60 80 100 10 20 30 40 50 60 70 80 90 100 Similarity 0 0.1 0.2 0.3 0.4 0.5 0.6 0.7 0.8 0.9 1