Download to read offline


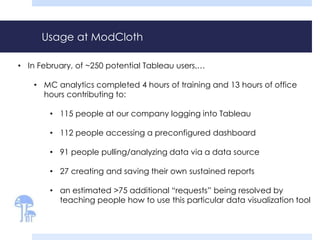
![The importance of office hours
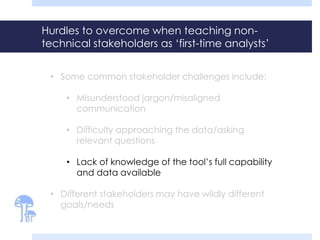
• We currently host 8 hours of office hours a week
• 4 hours dedicated to Tableau-Only questions
• 2 hours dedicated to Omniture-Only questions
• 2 hours of multipurpose office hours (open questions)
• ~50% of office hour time is scheduled and used
“[I want to get]
individual help running
[my] own reports.”
“Wish we spent more time
doing live scenarios,
practicing using the tool,
reviewing the metrics
available, how to pull ad
hoc reports, etc.”](https://image.slidesharecdn.com/datavissummit-140410142744-phpapp02/85/DataViz14-Stakeholder-empowerment-in-using-data-vis-GUIs-ModCloth-42-320.jpg)


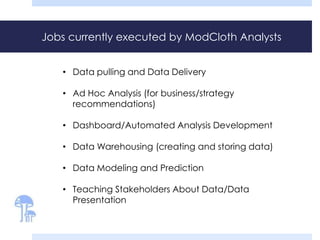
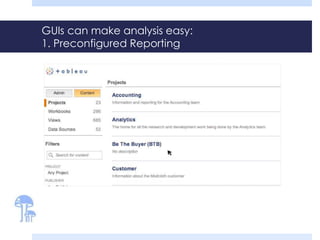
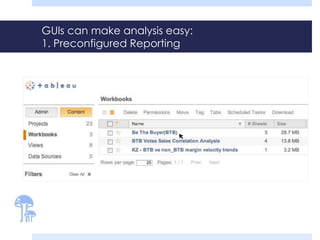
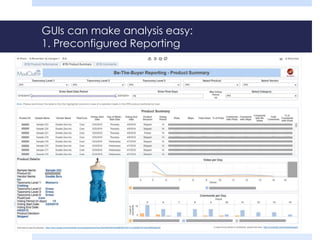
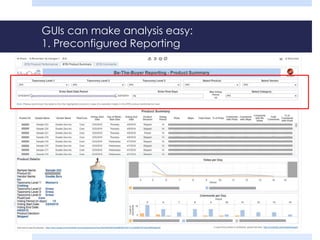
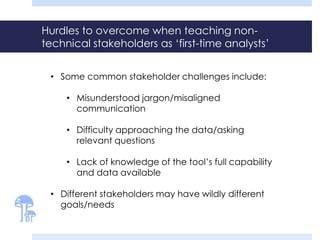
1) The document discusses teaching non-expert analysts at ModCloth to use data visualization tools like Tableau through training sessions and office hours. 2) It outlines challenges like technical jargon and different stakeholder needs, and strategies used like tailored training, interactive exercises, and dedicated support hours. 3) Usage data from February shows over 100 people accessing preconfigured reports, with many more taught to pull their own data and create reports through these training efforts.


