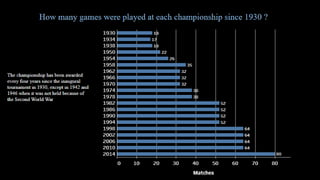
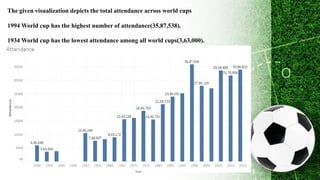
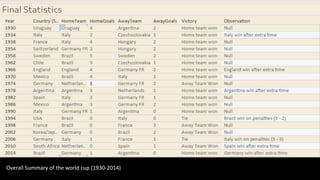
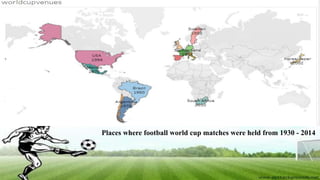
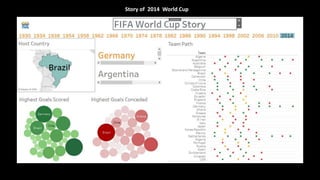
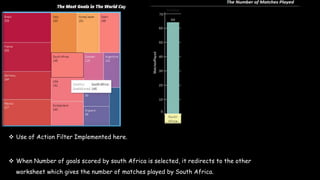
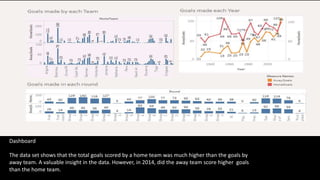
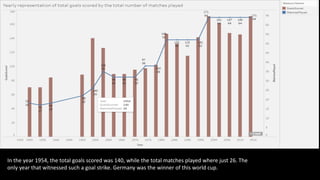
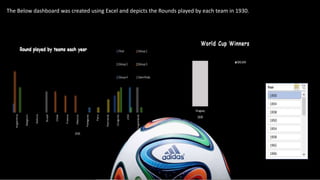
World Cup Result
Analysis
Descriptive Analysis and Data
Visualization
Project Submission
VariablesUnderstandingfromtheDataSet
 Year - The year in which the match was played.
 Date - The Date on which the match was played.
 Stage - The stage at which the match was played.
 Stadium - Stadium name where the match was held.
 City - The city name, where the match was played
 Home team - Home team’s country name.
 Home Goals - Total goals scored by the home team.
 Away Goals - Total goals scored by the away team.
 Away Team - Away team’s country name.
 Matches Played - Total matches played in the Tournament.
 Attendance - Total attendance in the Tournament..
 Qualified Teams - Total participating teams
 Goals Scored - Total goals scored in the world cup tournament.
 Fourth - Team who won the fourth place
 Third - Team who won the third place
 Runner-Up - Team who won the second place.
 Winner - Team who won the FIFA world cup
The given visualization depicts the total attendance across world cups
1994 World cup has the highest number of attendance(35,87,538).
1934 World cup has the lowest attendance among all world cups(3,63,000).
 Depicts the LOD of number of World Cups won by each Country.
 World Cup Rank is calculated by putting in the sum of world cups won in distinct years.
 Out of the 20 world cups, brazil has the maximum worldcups(5) which accounts for 25%.
 Germany before unification has won 3 world cups and also won a world cup in 2014 where the
total count of world cup takes to 4.
Overall Summary of the world cup (1930-2014)
Places where football world cup matches were held from 1930 - 2014
Story of 2014 World Cup
 Use of Action Filter Implemented here.
 When Number of goals scored by south Africa is selected, it redirects to the other
worksheet which gives the number of matches played by South Africa.
The data set shows that the total goals scored by a home team was much higher than the goals by
away team. A valuable insight in the data. However, in 2014, did the away team score higher goals
than the home team.
Dashboard
In the year 1954, the total goals scored was 140, while the total matches played where just 26. The
only year that witnessed such a goal strike. Germany was the winner of this world cup.
 The above visualization depicts the number of stadiums across various Host Countries
 We can find the maximum number of stadiums is in Italy(20).
 We also find European countries have more stadiums than their Latin American Counterparts.
No. of Penalty Kicks / Goals scored across matches
A penalty kick is awarded if a player commits a direct free kick inside their penalty area or off the
field as part of play as outlined in laws. A goal may be scored directly from a penalty kick and has
a high chances to qualify for the finals. Hence many kicks is found in Quarter finals such that the
teams can qualify for the next rounds as Semi-Finals and finals.
Count(penalty-kicks) : Quarter-Finals > Semi-Finals > Finals
Both the graphs are skewed right, because there are countries (home or away
team) who have scored more goals in order to compete and win FIFA a way
greater than the mean value which is around 2.1 in home goals and 1.02 in Away
goals. The mean value in both the graphs tells that there was a tough
competition among the players to get the Championship.
Germany has scored the maximum
Number of goals in the FIFA from
1930-2014.
The top 4 countries are listed here
Goals Scored in the season:
Germany > Brazil > Argentina > Italy
The Below dashboard was created using Excel and depicts the Rounds played by each team in 1930.
Key Findings from the Dataset
1. The world cup has been played every 4 years except in the year 1942 and 1946; the period of the World War 2.
2. The number of matches played has increased with each passing year as new countries participated in the World
cup.
3. 1994 World cup witnessed the highest number of attendees i.e. 35,87,538 while 1934 witnesses 3,63,000.
4. Brazil holds the record of winning the maximum number of times, Germany is close behind. However, Germany
has played most of the quarter finals, semi finals and finals. Furthermore, Germany has scored the highest number
of goals in the championship.
5. A major insight from the data was, on an average the home team scored more goals than the away goals, this
behaviour has been shown in different rounds played in different years.
6. The basic assumption of people that if matches played is more, the goals scored would also be high was changed in
the year 1954. This year 140 goals were scored in just 26 matches.
7. Looking at the various stadiums across the country, Italy has the maximum stadiums. Also the European countries
have more stadiums that have hosted the World Cup compared to their Latin counterpart.
8. From the dataset we find that Italy(1934,1990),France(1938,1998),Brazil(1950,2014),Mexico(1970,1986) and
Germany(1974,2006) has hosted most number of world cups.
9. The record for most number of matches played is for 2014 world cup(80).
NOTE: All the insights have been found after using BI tools like Tableau, Excel and SPSS. The use of action filter,
dashboards and slicer has been implemented.
ThankYou

Data-Visualization(Fifa WorldCup)

  • 1.
    World Cup Result Analysis DescriptiveAnalysis and Data Visualization Project Submission
  • 3.
    VariablesUnderstandingfromtheDataSet  Year -The year in which the match was played.  Date - The Date on which the match was played.  Stage - The stage at which the match was played.  Stadium - Stadium name where the match was held.  City - The city name, where the match was played  Home team - Home team’s country name.  Home Goals - Total goals scored by the home team.  Away Goals - Total goals scored by the away team.  Away Team - Away team’s country name.  Matches Played - Total matches played in the Tournament.  Attendance - Total attendance in the Tournament..  Qualified Teams - Total participating teams  Goals Scored - Total goals scored in the world cup tournament.  Fourth - Team who won the fourth place  Third - Team who won the third place  Runner-Up - Team who won the second place.  Winner - Team who won the FIFA world cup
  • 6.
    The given visualizationdepicts the total attendance across world cups 1994 World cup has the highest number of attendance(35,87,538). 1934 World cup has the lowest attendance among all world cups(3,63,000).
  • 7.
     Depicts theLOD of number of World Cups won by each Country.  World Cup Rank is calculated by putting in the sum of world cups won in distinct years.  Out of the 20 world cups, brazil has the maximum worldcups(5) which accounts for 25%.  Germany before unification has won 3 world cups and also won a world cup in 2014 where the total count of world cup takes to 4.
  • 8.
    Overall Summary ofthe world cup (1930-2014)
  • 9.
    Places where footballworld cup matches were held from 1930 - 2014
  • 10.
    Story of 2014World Cup
  • 11.
     Use ofAction Filter Implemented here.  When Number of goals scored by south Africa is selected, it redirects to the other worksheet which gives the number of matches played by South Africa.
  • 12.
    The data setshows that the total goals scored by a home team was much higher than the goals by away team. A valuable insight in the data. However, in 2014, did the away team score higher goals than the home team. Dashboard
  • 13.
    In the year1954, the total goals scored was 140, while the total matches played where just 26. The only year that witnessed such a goal strike. Germany was the winner of this world cup.
  • 14.
     The abovevisualization depicts the number of stadiums across various Host Countries  We can find the maximum number of stadiums is in Italy(20).  We also find European countries have more stadiums than their Latin American Counterparts.
  • 16.
    No. of PenaltyKicks / Goals scored across matches A penalty kick is awarded if a player commits a direct free kick inside their penalty area or off the field as part of play as outlined in laws. A goal may be scored directly from a penalty kick and has a high chances to qualify for the finals. Hence many kicks is found in Quarter finals such that the teams can qualify for the next rounds as Semi-Finals and finals. Count(penalty-kicks) : Quarter-Finals > Semi-Finals > Finals
  • 17.
    Both the graphsare skewed right, because there are countries (home or away team) who have scored more goals in order to compete and win FIFA a way greater than the mean value which is around 2.1 in home goals and 1.02 in Away goals. The mean value in both the graphs tells that there was a tough competition among the players to get the Championship.
  • 18.
    Germany has scoredthe maximum Number of goals in the FIFA from 1930-2014. The top 4 countries are listed here Goals Scored in the season: Germany > Brazil > Argentina > Italy
  • 19.
    The Below dashboardwas created using Excel and depicts the Rounds played by each team in 1930.
  • 20.
    Key Findings fromthe Dataset 1. The world cup has been played every 4 years except in the year 1942 and 1946; the period of the World War 2. 2. The number of matches played has increased with each passing year as new countries participated in the World cup. 3. 1994 World cup witnessed the highest number of attendees i.e. 35,87,538 while 1934 witnesses 3,63,000. 4. Brazil holds the record of winning the maximum number of times, Germany is close behind. However, Germany has played most of the quarter finals, semi finals and finals. Furthermore, Germany has scored the highest number of goals in the championship. 5. A major insight from the data was, on an average the home team scored more goals than the away goals, this behaviour has been shown in different rounds played in different years. 6. The basic assumption of people that if matches played is more, the goals scored would also be high was changed in the year 1954. This year 140 goals were scored in just 26 matches. 7. Looking at the various stadiums across the country, Italy has the maximum stadiums. Also the European countries have more stadiums that have hosted the World Cup compared to their Latin counterpart. 8. From the dataset we find that Italy(1934,1990),France(1938,1998),Brazil(1950,2014),Mexico(1970,1986) and Germany(1974,2006) has hosted most number of world cups. 9. The record for most number of matches played is for 2014 world cup(80). NOTE: All the insights have been found after using BI tools like Tableau, Excel and SPSS. The use of action filter, dashboards and slicer has been implemented.
  • 21.