SlideShare a Scribd company logo
1 of 13
Download to read offline
 The 2014 FIFA World Cup BrazilTM was the 20th edition of the tournament 
 12 host cities, 12 stadiums 
 28 Venue Specific Training Sites (VSTSs) in the 12 host cities 
 32 Team Base Camps (TBCs) across Brazil 
 32 teams, 64 matches 
Statistics 
FIFA World Cup™ Teams / Matches Goals Average Yellow / Red cards Average Attendance Average Brazil 2014 32 / 64 171 2.67 177 / 10 2.77 / 0.16 3,429,873 53,592 
South Africa 2010 
32 / 64 
145 
2.27 
245 / 17 
3.83 / 0.27 
3,178,856 
49,670 Germany 2006 32 / 64 147 2.30 307 / 28 4.80 / 0.44 3,359,439 52,491 
Korea/Japan 2002 
32 / 64 
161 
2.52 
260 / 17 
4.06 / 0.27 
2,705,197 
42,269 France 1998 32 / 64 171 2.67 250 / 22 3.91 / 0.34 2,785,100 43,517 
USA 1994 
24 / 52 
141 
2.71 
221 / 15 
4.25 / 0.29 
3,587,538 
68,991 Italy 1990 24 / 52 115 2.21 165 / 16 3.17 / 0.31 2,516,215 48,389 
Mexico 1986 
24 / 52 
132 
2.54 
137 / 8 
2.63 / 0.15 
2,394,031 
46,039 Spain 1982 24 / 52 146 2.81 99 / 5 1.90 / 0.10 2,109,723 40,572 
Argentina 1978 
16 / 38 
102 
2.68 
59 / 3 
1.55 / 0.08 
1,545,791 
40,679 Germany FR 1974 16 / 38 97 2.55 87 / 5 2.29 / 0.13 1,865,753 49,099 
Mexico 1970 
16 / 32 
95 
2.97 
51 / 0 
1.59 / 0 
1,603,975 
50,124 England 1966 16 / 32 89 2.78 21 / 5 0.66 / 0.16 1,563,135 48,848 
Chile 1962 
16 / 32 
89 
2.78 
1 / 6 
0.03 / 0.19 
893,172 
27,912 Sweden 1958 16 / 35 126 3.6 0 / 3 0 / 0.09 819,810 23,423 
Switzerland 1954 
16 / 26 
140 
5.38 
0 / 3 
0 / 0.12 
768,607 
29,562 Brazil 1950 13 / 22 88 4 1 / 0 0.05 / 0 1,045,246 47,511 
France 1938 
15 / 18 
84 
4.67 
0 / 4 
0 / 0.22 
375,700 
20,872 Italy 1934 16 /17 70 4.12 0 / 1 0 / 0.06 363,000 21,353 
Uruguay 1930 
13 / 18 
70 
3.89 
0 / 1 
0 / 0.06 
590,549 
32,808
Total attendance: 
3,429,873 
Average attendance: 
53,592 
Number of goals: 
171 
Goal average: 
2.67 
Most goals scored: 
18 Germany 
Least goals scored: 
1 Cameroon 
1 Honduras 
1 Iran 
Most goals conceded: 
14 Brazil 
Least goals conceded: 
2 Costa Rica 
Number of penalties: 
13 (12 converted, 1 missed) 
Number of own goals: 
5 
Goals scored by substitutes: 
32 (out of 171, 18.71%) 
Goals first half v. second half: 
65 v. 98 
-goals in additional time 1st half: 
3 
-goals in additional time 2nd half: 
12 
Goals in first 10 minutes: 
11 (6.43%) 
Goals in last 10 minutes: 
35 (20.47%) 
Goals in extratime: 
8 (4.68%) 
Top goalscorer: 
6 RODRIGUEZ James (COL) 
Youngest goalscorer: 
19y 0m GREEN Julian (USA), 01.07.2014 (Belgium - USA) 
Fastest goal: 
0' 30" DEMPSEY Clint (USA), 16.06.2014 (Ghana - USA) 
Highest number of assists: 
4 CUADRADO Juan (COL) 
4 KROOS Toni (GER) 
Highest wins: 
1 - 7, 08.07.2014 (Brazil - Germany) 
Highest-scoring matches: 
1 - 7, 08.07.2014 (Brazil - Germany) 
Highest number of wins: 
6 Germany 
Highest number of defeats: 
3 Australia 
3 Cameroon 
3 Honduras 
Number of yellow cards: 
181 (avg/game 2.83) 
Number of red cards: 
10 (avg/game 0.16) 
Most yellow cards: 
14 Brazil 
Least yellow cards: 
2 Portugal 
Most red cards: 
1 Belgium 
1 Cameroon
1 Costa Rica 
1 Croatia 
1 Ecuador 
1 Greece 
1 Honduras 
1 Italy 
1 Portugal 
1 Uruguay 
Goal Line Technology (GLT) 
 First FIFA World Cup to utilise the Goal Line Technology during the competition 
 Goal-line incidents: 3 
 Goal-line replays televised: 10 
Event Operations 
 1,453 Hyundai and Kia vehicles and 422 buses transporting media, referees, the 32 teams, FIFA staff and authorities in the 12 host cities 
 Approximately 200,000 m2 of signage and decoration at the 12 stadiums 
 2,952 linear metres of LED panels of Electronic Advertising 
 5,500 communication radios for FIFA/LOC staff 
 More than 2.3 million Coca-Cola drink bottles, including water, juice, soda water, soft drinks and Powerade (average bottle size of 500ml), for the 32 teams, the 14,000 volunteers and FIFA/LOC staff alone 
o Approximately 1.15 million litres of drinks for the 32 teams, the 14,000 volunteers and FIFA/LOC staff alone 
 150,000 meals and 50,000 snacks for volunteers and staff 
 250,000 meals sold in third-party operated restaurants for staff within stadiums 
 A total of 3,240 adidas balls have been used for the whole tournament (including training balls and match balls) 
Participation 
 3,389 children participating in the FIFA Youth Programme visited FIFA World Cup stadiums for a unique experience on the pitch, whether escorting the players, carrying the team flags, the FIFA or the “Fair Play” flag, or acting as ball boys or ball girls. Over 25,000 adidas products for the Youth Programme 
 152,000 volunteers registered 
 14,000 LOC/FIFA volunteers selected to work at the FIFA World Cup and over 125,000 adidas volunteer uniform items 
 240,000 accreditations printed (143,000 individualized, 103,000 generic) 
o 36,000 day passes 
o 178,000 wristbands 
o 174,000 SADs 
o 380,000 other access devices
Ticketing 
 More than 11 million ticket applications received 
 Total allocated tickets: 3,141,908 
 64% of the tickets allocated to Brazilians and 36% to international fans 
 Top-20 countries in terms of ticket sales 
Countries 
Combined: Tickets Allocated to General Public and PMA Supporters (by Residency) Brazil 1,636,294 
USA 
203,964 Argentina 63,128 
Germany 
60,991 England 58,690 
Colombia 
56,638 Australia 52,509 
Chile 
40,200 France 35,347 
Mexico 
35,006 Canada 30,026 
Japan 
22,942 Switzerland 17,880 
Netherlands 
16,374 Uruguay 16,142 
Spain 
13,886 Israel 12,433 
Ecuador 
11,762 Russian Federation 10,858 
Italy 
10,155 
Teams 
• More than 300 tons of team equipment 
• More than 500 hours of domestic flights with the delegations 
• 280,000 km flown by the teams or 7 laps around the world 
• Almost 18,000 passengers transported 
• 250 domestic flights with the participating teams 
• 570 domestic flights with the referees 
• 62 arrivals and departures of international flights involving teams 
• 492,000 m2 of grass of selected pitches maintained 
• 11 tons of Winter seeds for the pitch management 
• 2,300 litres of paint for pitch marking 
• 450 training sessions in the Team Base Camps (TBCs) 
• More than 50 training sessions in the Venue Specific Training Sites (VSTSs) in the host cities 
• Almost 100 training sessions in the stadia on match days - 1 
• 2,740 towels provided by adidas for players and referees 
• 22,000 toilet kits (shampoo, soap and toilet bags) for players and referees
Medical services 
 More than 2,000 health professionals at the stadia 
 112 ambulances at the stadia 
 105 medical posts at the stadia 
 Medical Encounters on Match Days: 6,230 
 Matches – 64 
 Average per Match – 97 
 % of Attendance – 0,16 % 
o (Expected Range - 0,1% to 0,3%) 
 Medevacs from Stadium – 159 
 % of Medical Encounters – 2,55% 
o (Expected Range 3,0% to 5,0%) 
 7,218 free health screenings for Volunteers conducted by Johnson and Johnson 
 83,760 Johnson and Johnson care packages distributed 
Spectator services 
 Wristband to identify kids: more than 20,000 
 Found items: 1,326 
 Lost children: 72 (all cases solves in 5 min max) 
 Wheelchair service: 5,305 
 Total number of printed media accreditations: 16,746 (more than 10,000 for broadcasters including technicians) 
Host Broadcaster 3,048 
International Photographer 
Total for Category 
725 
International Press 
Total for Category 
2033 
International Technician Photo/Press 
Total for Category 
63 Total International Media 2,821 
Local Photographer 
Total for Category 
126 
Local Press 
Total for Category 
331 Total Local Media 457 
National Photographer 
Total for Category 
111 
National Press 
Total for Category 
262 
National Technician Photo/Press 
Total for Category 
6 Total National Media 379 TV/Radio 10,044 
 120,000 bottles of water distributed in press boxes 
 Media working area of 58,043 m2 
 10,936 places for written press in the 12 stadiums
FIFA TV achievements 
 Record figures from all FIFA World Cup Groups 
 “Watershed” moment for football in the United States – beat TV viewing figures for 2014 NBA Finals and 2013 World Series 
 FIFA TV expects bigger global audience than 2010 (numbers still to be consolidated) 
 FIFA TV expects that more than one billion people have watched some coverage of the Final Match, including out-of-home viewing (numbers still to be consolidated) 
 All-time high TV viewing records in Germany, the Netherlands and Belgium 
 The final between GER v ARG attracted the biggest audience in German TV history, breaking the record set in the semi-final as an average 34.7 mln watched on ARD. 
 Breakthrough all-time record figures in online streaming of matches in the USA 
 Most data ever streamed for an event as fans watch online 
 Biggest audience for a TV show in France for 7 years 
 Biggest audience for a TV show achieved in UK, Italy, Spain and Portugal for 2 years 
 Pioneered next generation Ultra HD technology and other innovations: 
o 3 matches, including Final, produced live in 4K 
o showcased 4K in cinema 
o 9 matches test-produced in 8K 
o biggest ever and most advanced multimedia production for tablets, computers and mobile phones 
o 360 degree Ultra HD film of Final for the FIFA World Football Museum 
IBC (International Broadcast Centre) at Riocentro 
 Area of 70,000 m², including both indoor and external areas 
 Security provided 24 hours per day, 7 days a week, during FIFA exclusive use period 
 2,750 hours of content produced 
 450 km of cables (distance from Rio to Sao Paulo by car) 
 29,000 m² of carpet 
 2.9 km of cable trays 
 All matches transmitted in HD, some in 4k and some in 8k 
 290 HD cameras 
 A peak of 1,750 people working during the event 
 214 countries receiving the TV signal from the event 
Digital 
 Attendance in FIFA’s Global Stadium exceeds 1 billion fans (equivalent to 13,380 time the seating in Maracana) 
 The official FIFA app recently became the biggest sports event app of all time with a record 28 million downloads. 
 An impressive 451 million Facebook users were reached with official FIFA social content, while FIFA’s Twitter followers surpassed the 16-million mark, with an average of ten new followers per second recorded on the opening match day. The official FIFA World Cup Instagram app increased from 42,000 to 0.8 million followers in 31 days, a growth rate of over 1,600 per cent. 
 More than 40 billion impressions of official FIFA World Cup digital content
FIFA Fan FestTM 
 12 FIFA Fan Fest venues (one in each host city) 
 Open on a total of 281 days 
 748 live performances 
 760 hours of music 
 Featuring 1,191 square metres of high quality giant screens 
Attendance by city: 
City 
Attendance 
Belo Horizonte 
255,403 
Brasilia 
369,480 
Cuiaba 
306,896 
Curitiba 
112,836 
Fortaleza 
781,602 
Manaus 
504,108 
Natal 
195,062 
Porto Alegre 
497,893 
Recife 
132,510 
Rio de Janeiro 
937,330 
Salvador 
255,040 
São Paulo 
806,226 
Total 
5,154,386 
International FIFA Fan Fest 
 Hosted in 6 cities (Kaliningrad, Samara, Niyhny Novgorod, Saransk, Volgograd and Ekaterinburg) 
 Open on a total of 28 match days 
 Total attendance of 142,000 for the 3 matches of the Russian national team 
Licensing 
Brazil licensing programme: 
• 1 Local Master Licensee 
• 1 Official On-Site Merchandising Operator 
• 1 Official Online Store Operator 
• 1 Official TV Shopping Operator 
• 70 Official Licensees 
• 2,000 different Official Licensed Products developed 
• 22 million Official Licensed Products in the market 
• 72 stores within on-site merchandising project 
• 2 Megastores (2,000m2 & 500m2) during the tournament in Rio de Janeiro and Fortaleza and 4 other merchandising stores linked to FIFA Fan Fest activities 
• 14 Official Airport Stores across Brazil
• 3 Official Fan Shops located in Shopping Malls 
• 11 Official Kiosks 
International licensing programme: 
• 69 Official Licensees 
• 3 Official Online Store Operators 
• 5 Direct-To-Retail Official Licensees 
• 7 Official Event Store partners 
• 2 Official Fan Shop partners 
• 3 licensing agencies in Asia Pacific 
• FIFA Official Online Store available in 189 countries 
• 935 dedicated retail corners at Official Event Stores 
• Approx. 14,000 retail outlets featured direct-to-retail Official Licensed Products 
• 77 million Official Licensed Products in the market 
Food & Beverage (Stadium concessions) 
Recruitment: 
 More than 15.000 jobs created for the Food & Beverage operation (excluding Hospitality areas) 
 166,035 applicants registered on the recruitment website for the stadium catering services 
 30,554 applicants were interviewed after successfully registering on the recruitment website 
Suppliers: 
 More than 100 suppliers of food services 
 Nearly 15 local catering companies involved 
Menu offer and sales: 
• 3,127,674 sales transactions throughout the 64 matches 
 Menu offer including 9 Brazilian dishes and 22 international dishes or snacks 
• More than 800,000 servings of food (including hot and cold sandwiches, Barbecue, Feijão Tropeiro and Tambaqui de Pé) 
• 34,601 portions of Feijão Tropeiro (local dish in Belo Horizonte) 
• 6,738 portions of Tambaqui de Pé (local dish in Manaus) 
• More than 3 million units of beer (Brahma, Budweiser and Brahma Zero) 
• More than 2 million units of soft drinks (Coca-Cola, Coca-Cola Zero, Guaraná Kuat, Sprite, Powerade Mountain Blast, Água Crystal and Matte Leão Natural) 
• Nearly 750,000 units of snacks (including popcorn, salty snacks, chocolate, ice cream, Bolo de Rolo and Biscoito Globo) 
Number of stadium F&B points of sale: 
• Belo Horizonte: 38 
• Brasília: 45 
• Cuiabá: 27 
• Curitiba: 37 
• Fortaleza: 40 
• Manaus: 23 
• Natal: 19
• Porto Alegre: 54 
• Recife: 20 
• Rio de Janeiro: 38 
• Salvador: 35 
• São Paulo: 35 
Hospitality 
• 290,000 Hospitality Packages sold (58% domestic vs. 42% international) 
• 373,000 Hospitality Guests (second biggest FIFA World Cup hospitality guest number ever) 
• 9 Hospitality Villages 
• 130 Hospitality Lounges 
• 780 Hospitality Suites/Skyboxes 
• 28 Catering companies 
• More than 15,000 staff including waiters, bartenders, chefs & cooks, technicians, plus 2,260 Hospitality Hostesses (from which 95% Brazilian) 
• 140,000m2 temporary facilities built (including 60,000m2 tents) 
• 9,000 tables 
• 30,000 chairs 
• 155 tons of food served 
• 150,000 Champagne glasses 
• 200,000 plates 
• 225,000 glasses 
• 250,000 forks and knives 
• 250 containers 
• 250 coffee machines 
• 400 ovens 
The FIFA World Cup Trophy Tour by Coca-Cola 
Global Tour: 
• The FIFA World Cup Trophy Tour by Coca-Cola began in Rio de Janeiro on 12 September 2013 and concluded in Sao Paulo on 1 June 2014 
• Across 267 days the tour; 
o Travelled 165,000km Carbon Neutral 
o Visited 90 Countries 
o Went through 149 airports 
o Crossed 44 time zones 
• More than 1 million people got to see the Trophy through a range of events, including; 
o 45 Heads of State 
o 33 previous FIFA World Cup™ winners 
Social Media platforms: 
• The FIFA World Cup Trophy Tour by Coca-Cola dedicated Facebook page achieved; 
o More than 4.4 million users 
o 417 million impressions 
o 1.9 million likes 
o 41,700 thousand comments
o 48,700 thousand shares. 
The Official Mascot, FulecoTM 
Live performances: 
• Fuleco was present in all 64 matches and 25 FIFA Fan Fests across Brazil, entertaining the fans on and off the pitch 350 times. 
• He was the ambassador voice of the Waste Management campaign in all 12 stadia which collected around 420 tonnes of waste. 
• Since Fuleco’s launch in September 2012, he attended a total of 486 events and visited 21 cities in Brazil. 
• Internationally, Fuleco travelled through 90 countries with the FIFA World Cup Trophy Tour by Coca-Cola. 
Social Media platforms: 
• Fuleco’s Facebook Page had 1,376,239 fans, from which 73% are Brazilian and having a total reach of 7,774,274 people (57% Brazil). He was followed on Twitter by 14,100 followers. 
 45% of FIFA World Cup vehicle fleet used only ethanol, a renewable fuel source 
 All 14,000 volunteers were trained to provide special services for people with disabilities and reduced mobility 
 All 12 FIFA World Cup stadiums were non-smoking zones. Smoking was only permitted in designated areas 
 26 matches in stadiums in Belo Horizonte, Brasilia, Rio de Janeiro and Sao Paulo had audio descriptive commentary for blind or partially sighted people 
 Stadium workers in all 12 host cities of the FIFA World Cup received training in sustainable operations 
 Around 4,000 specialised workers were hired by the stadium operators and complementary structures integrators. 
 Around 420 tons of recyclable waste produced in the stadia and additional FIFA World Cup related facilities were collected and allocated to cooperatives of garbage collectors. 
 The total investment in the implementation of the FIFA World Cup Sustainability Strategy in Brazil will be approximately USD 20 million, including various social and environmental initiatives. 
Football for Hope 
 01-06 July 2014: Cultural and educational activities 
 07-10 July 2014: Football tournament 
 26 (at least one per host city) community organisations supported by Football for Hope in Brazil in 2014, with a total of US$ 1.05 million provided. This support will continue in 2015 and 2016 
 192 young people aged between 15 and 18 from 27 countries took part in the Football For Hope Festival in Caju, in Rio de Janeiro 
 32 teams participated at the Football for Hope Festival in Caju, in Rio de Janeiro. The teams came from 26 different countries, including eight from Brazil
 According to the Getulio Vargas Foundation, 14 million jobs have been created in the last four years because of the FIFA World Cup, the equivalent of 180 Maracana stadiums filled to capacity 
 15,000 jobs created in stadium catering services 
 More than 1,200 jobs created in merchandising at the stadia and official event locations 
 17,000 people working in the area of Hospitality 
 420 receptionists, with a total of 2,240 daily allowances 
 More than 29,000 temporary workers employed directly or through third-party service providers 
o 1,220 permanent workers or temporary workers employed until the 2014 FIFA World Cup 
o Safety: 20,000 trained, specialised workers responsible for the security and safety of delegations and supporters in official FIFA World Cup areas such as stadiums, Official Training Pitches (COTs), National Team Training Centres (CTSs) and official hotels 
o Catering services for staff and volunteers: 3,000 indirect workers 
o Transport: approximately 3,145 indirectly employed drivers. Another 258 indirectly employed staff will work as coordinators, inspectors and dispatchers 
o Logistics: approximately 800 indirect employees 
o Protocol: 105 temporary employees to work in VIP and VVIP areas 
o Events: approximately 800 indirect Jobs created for the opening and closing ceremonies 
 Approximately 800 agents from waste management cooperatives participated in the selective collection of recyclable waste, supported and funded by Coca-Cola. The job was paid and workers received a uniform, personal protective equipment (PPE) and training. 
 Stadium operators and those responsible for the administration of supplementary installations employed approximately 4,000 cleaning staff from specialised companies 
 FIFA invested more than US$ 850 million in the organisation of the FIFA World Cup in Brazil 
 In hotel accommodation in Brazil alone, FIFA and COL spent more than half a billion reais 
 FIFA and LOC representatives spent more than 600,000 nights in hotels 
 In two and a half years, Local Organising Committee representatives have taken than 12,000 flights and flown for approximately 36,000 hours between the 12 host cities 
 Tax revenue for the host country as a result of investments in the FIFA World Cup shall amount to as much as USD 7.2 billion (Source: Ernst & Young and Getulio Vargas Foundation) 
 FIFA´s first contribution to the 2014 FIFA World Cup Legacy Fund (launched in Belém on 06 July 2014) will be USD 20 million, but the total amount will be defined after the Brazil 2014 financial results have been calculated. The Legacy Fund will focus on the development of football infrastructure and women's football. The investment is expected to reach the USD 100 million mark. 
 BRL 29.3 million were spent with Visa-branded products at all FIFA venues, including 12 stadiums and 12 FIFA Fan Fest venues, throughout the 2014 FIFA World CupTM (12 June - 13 July). A total of 582,300 transactions were processed using Visa credit, debit and prepaid cards.
 1,210 new laptops deployed for the FIFA World Cup event (Accreditation centres, volunteers, center, Transport locations, Media centers, FIFA venue delegation) 
 Printing equipment: 
o 738 black and white A4 desktop printer 
o 50 color A4 desktop printers 
o 147 Multifunction desktop equipment (PCFs) 
o 115 accreditation printers 
o 134 Multifunction 
 1,287 LAN ports 
 814 Analogue lines 
 71 Fax lines 
 706 ADSL lines 
 164 Wireless Access points 
 1,437 phone handsets 
 42 Conference phones 
 32 VOIP phones 
Media Services 
• 5,524 LAN managed ports (Free media), including 1672 for the News agencies 
• 25,000 media network ports across all venues 
• 619 Wireless access points 
• 2,457 unmanaged switches 
• 24,714 RJ45 Cables 
Network Sizing and Support 
 A fully redundant Wide-Area Network backbone to support: 
 22 ISP connections from 2Mbps to 1Gbps; 
 70 MPLS connections from 6Mbps to 155Mbps; 
 Two - LAN to LAN connections of 10Gbps 
 A Local Area and Wireless Network to support staging / deployment / operations / and support of approximately : 
o 1,000 network elements (including core switches, access switches and firewalls); 
o 7,900 cat 5e network ports and accessories (patch cords, optical cords, racks, etc.); 
 The On-site Support & Network Monitoring Team: 
o More than 4,500 Oi managed professionals to support the event with the SLA, quality and reliability that FIFA requires; 
o More than 20 Oi professionals to provide real-time monitoring of all the IT&T services and infrastructure deployed and supported by Oi 
IT&T Information and statistics 
• Until the end of the FIFA World Cup Final Match, 404,299 devices got connected to the 12 host cities WiFi network. 
• The highest number of devices simultaneously connected was 7.596 and happened 2 hours before the opening match.
• The record of devices simultaneously connected to the WiFi network of a single host city was 2,460 at 18:00h in July 13rd at Maracana during the Final Match between Germany x Argentina. 
• Until the end of the FIFA World Cup, Media Services had a traffic of approximately 57 Terabytes of data at the network, this would be the same as 15,486,000 photos in high resolution, or 62,283,000 photos in regular resolution, or 12,192 DVDs. 
• Until the end of the FIFA World Cup, approximately 74 Terabytes of traffic passed through Oi Network (Media + FITS), an amount of information similar to 19,938,000 photos in high resolution, or 80,187,000 photos in regular resolution, or 15.696 DVDs. 
In terms of comparing, we can make the following considerations: 
• During the FIFA Confederations Cup 2013, Media Services had traffic of approximately 7 terabytes of data at the network, an amount of information similar to 1 million and 975 thousand photos in high resolution, or 7.310 DVDs. 
o Until the end of the 2014 FIFA World Cup, the data traffic at the network, which supports the Media Services, was similar to 8.14 FIFA Confederations Cup 
• During the whole 2010 FIFA World Cup South Africa, the media services had a traffic of approximately 25 Terabytes. 
o Until the end of the FIFA World Cup, the data traffic at the network was similar to 2.96 the whole data traffic during the 2010 FIFA World Cup South Africa. 
• From the opening until the end of the FIFA World Cup, the data traffic at the network, which supports the Media Services and non-media (FITS and others)(74 Tbytes) was similar to approximately 7 USA Congress Libraries. 
Telecommunications Rate Card for broadcasters 
 IBC : 
o 407 phone lines 
o 243 ISDN 
o 116 ADSL 
o 56 IP Connect circuits 
 Venues : 
o Commentary Positions : 
 1192 phone liens 
 561 ISDN 
o Broadcast Compound : 
 394 phone lines 
 211 ISDN 
 243 ADSL 
 86 IP Connect

More Related Content

More from Cassio Zirpoli

A tabela básica da Série D do Brasileiro 20201
A tabela básica da Série D do Brasileiro 20201A tabela básica da Série D do Brasileiro 20201
A tabela básica da Série D do Brasileiro 20201Cassio Zirpoli
 
A tabela revisada da Série C de 2020
A tabela revisada da Série C de 2020A tabela revisada da Série C de 2020
A tabela revisada da Série C de 2020Cassio Zirpoli
 
A tabela revisada da Série B de 2020
A tabela revisada da Série B de 2020A tabela revisada da Série B de 2020
A tabela revisada da Série B de 2020Cassio Zirpoli
 
A tabela revisada do Campeonato Brasileiro de 2020
A tabela revisada do Campeonato Brasileiro de 2020A tabela revisada do Campeonato Brasileiro de 2020
A tabela revisada do Campeonato Brasileiro de 2020Cassio Zirpoli
 
A tabela básica da Série D do Brasileiro 2020
A tabela básica da Série D do Brasileiro 2020A tabela básica da Série D do Brasileiro 2020
A tabela básica da Série D do Brasileiro 2020Cassio Zirpoli
 
A tabela básica da Série C do Brasileiro 2020
A tabela básica da Série C do Brasileiro 2020A tabela básica da Série C do Brasileiro 2020
A tabela básica da Série C do Brasileiro 2020Cassio Zirpoli
 
A tabela básica da Série B do Brasileiro 2020
A tabela básica da Série B do Brasileiro 2020A tabela básica da Série B do Brasileiro 2020
A tabela básica da Série B do Brasileiro 2020Cassio Zirpoli
 
A tabela básica da Série A do Brasileiro 2020
A tabela básica da Série A do Brasileiro 2020A tabela básica da Série A do Brasileiro 2020
A tabela básica da Série A do Brasileiro 2020Cassio Zirpoli
 
Projeto sobre a reforma do estatuto do Santa Cruz
Projeto sobre a reforma do estatuto do Santa CruzProjeto sobre a reforma do estatuto do Santa Cruz
Projeto sobre a reforma do estatuto do Santa CruzCassio Zirpoli
 
Pesquisa de remuneração no futebol brasileiro, via CBF
Pesquisa de remuneração no futebol brasileiro, via CBFPesquisa de remuneração no futebol brasileiro, via CBF
Pesquisa de remuneração no futebol brasileiro, via CBFCassio Zirpoli
 
A tabela básica da Série D de 2019
A tabela básica da Série D de 2019A tabela básica da Série D de 2019
A tabela básica da Série D de 2019Cassio Zirpoli
 
A tabela básica da Série A de 2019
A tabela básica da Série A de 2019A tabela básica da Série A de 2019
A tabela básica da Série A de 2019Cassio Zirpoli
 
A tabela básica da Série B de 2019
A tabela básica da Série B de 2019A tabela básica da Série B de 2019
A tabela básica da Série B de 2019Cassio Zirpoli
 
Regulamento Geral de Competições da CBF - 2019
Regulamento Geral de Competições da CBF - 2019Regulamento Geral de Competições da CBF - 2019
Regulamento Geral de Competições da CBF - 2019Cassio Zirpoli
 
Regulamento do Campeonato Pernambucano de 2019
Regulamento do Campeonato Pernambucano de 2019Regulamento do Campeonato Pernambucano de 2019
Regulamento do Campeonato Pernambucano de 2019Cassio Zirpoli
 
O regulamento da Copa do Nordeste 2019
O regulamento da Copa do Nordeste 2019O regulamento da Copa do Nordeste 2019
O regulamento da Copa do Nordeste 2019Cassio Zirpoli
 
A tabela detalhada da Copa do Nordeste de 2019
A tabela detalhada da Copa do Nordeste de 2019A tabela detalhada da Copa do Nordeste de 2019
A tabela detalhada da Copa do Nordeste de 2019Cassio Zirpoli
 
A tabela básica da Copa do Nordeste de 2019
A tabela básica da Copa do Nordeste de 2019A tabela básica da Copa do Nordeste de 2019
A tabela básica da Copa do Nordeste de 2019Cassio Zirpoli
 
Análise dos clubes brasileiros 2018 - Itaú BBA
Análise dos clubes brasileiros 2018 - Itaú BBAAnálise dos clubes brasileiros 2018 - Itaú BBA
Análise dos clubes brasileiros 2018 - Itaú BBACassio Zirpoli
 
O balanço financeiro do Náutico em 2017
O balanço financeiro do Náutico em 2017O balanço financeiro do Náutico em 2017
O balanço financeiro do Náutico em 2017Cassio Zirpoli
 

More from Cassio Zirpoli (20)

A tabela básica da Série D do Brasileiro 20201
A tabela básica da Série D do Brasileiro 20201A tabela básica da Série D do Brasileiro 20201
A tabela básica da Série D do Brasileiro 20201
 
A tabela revisada da Série C de 2020
A tabela revisada da Série C de 2020A tabela revisada da Série C de 2020
A tabela revisada da Série C de 2020
 
A tabela revisada da Série B de 2020
A tabela revisada da Série B de 2020A tabela revisada da Série B de 2020
A tabela revisada da Série B de 2020
 
A tabela revisada do Campeonato Brasileiro de 2020
A tabela revisada do Campeonato Brasileiro de 2020A tabela revisada do Campeonato Brasileiro de 2020
A tabela revisada do Campeonato Brasileiro de 2020
 
A tabela básica da Série D do Brasileiro 2020
A tabela básica da Série D do Brasileiro 2020A tabela básica da Série D do Brasileiro 2020
A tabela básica da Série D do Brasileiro 2020
 
A tabela básica da Série C do Brasileiro 2020
A tabela básica da Série C do Brasileiro 2020A tabela básica da Série C do Brasileiro 2020
A tabela básica da Série C do Brasileiro 2020
 
A tabela básica da Série B do Brasileiro 2020
A tabela básica da Série B do Brasileiro 2020A tabela básica da Série B do Brasileiro 2020
A tabela básica da Série B do Brasileiro 2020
 
A tabela básica da Série A do Brasileiro 2020
A tabela básica da Série A do Brasileiro 2020A tabela básica da Série A do Brasileiro 2020
A tabela básica da Série A do Brasileiro 2020
 
Projeto sobre a reforma do estatuto do Santa Cruz
Projeto sobre a reforma do estatuto do Santa CruzProjeto sobre a reforma do estatuto do Santa Cruz
Projeto sobre a reforma do estatuto do Santa Cruz
 
Pesquisa de remuneração no futebol brasileiro, via CBF
Pesquisa de remuneração no futebol brasileiro, via CBFPesquisa de remuneração no futebol brasileiro, via CBF
Pesquisa de remuneração no futebol brasileiro, via CBF
 
A tabela básica da Série D de 2019
A tabela básica da Série D de 2019A tabela básica da Série D de 2019
A tabela básica da Série D de 2019
 
A tabela básica da Série A de 2019
A tabela básica da Série A de 2019A tabela básica da Série A de 2019
A tabela básica da Série A de 2019
 
A tabela básica da Série B de 2019
A tabela básica da Série B de 2019A tabela básica da Série B de 2019
A tabela básica da Série B de 2019
 
Regulamento Geral de Competições da CBF - 2019
Regulamento Geral de Competições da CBF - 2019Regulamento Geral de Competições da CBF - 2019
Regulamento Geral de Competições da CBF - 2019
 
Regulamento do Campeonato Pernambucano de 2019
Regulamento do Campeonato Pernambucano de 2019Regulamento do Campeonato Pernambucano de 2019
Regulamento do Campeonato Pernambucano de 2019
 
O regulamento da Copa do Nordeste 2019
O regulamento da Copa do Nordeste 2019O regulamento da Copa do Nordeste 2019
O regulamento da Copa do Nordeste 2019
 
A tabela detalhada da Copa do Nordeste de 2019
A tabela detalhada da Copa do Nordeste de 2019A tabela detalhada da Copa do Nordeste de 2019
A tabela detalhada da Copa do Nordeste de 2019
 
A tabela básica da Copa do Nordeste de 2019
A tabela básica da Copa do Nordeste de 2019A tabela básica da Copa do Nordeste de 2019
A tabela básica da Copa do Nordeste de 2019
 
Análise dos clubes brasileiros 2018 - Itaú BBA
Análise dos clubes brasileiros 2018 - Itaú BBAAnálise dos clubes brasileiros 2018 - Itaú BBA
Análise dos clubes brasileiros 2018 - Itaú BBA
 
O balanço financeiro do Náutico em 2017
O balanço financeiro do Náutico em 2017O balanço financeiro do Náutico em 2017
O balanço financeiro do Náutico em 2017
 

Números da Copa do Mundo de 2014
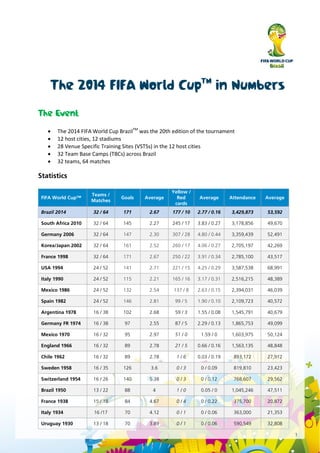
  • 1.  The 2014 FIFA World Cup BrazilTM was the 20th edition of the tournament  12 host cities, 12 stadiums  28 Venue Specific Training Sites (VSTSs) in the 12 host cities  32 Team Base Camps (TBCs) across Brazil  32 teams, 64 matches Statistics FIFA World Cup™ Teams / Matches Goals Average Yellow / Red cards Average Attendance Average Brazil 2014 32 / 64 171 2.67 177 / 10 2.77 / 0.16 3,429,873 53,592 South Africa 2010 32 / 64 145 2.27 245 / 17 3.83 / 0.27 3,178,856 49,670 Germany 2006 32 / 64 147 2.30 307 / 28 4.80 / 0.44 3,359,439 52,491 Korea/Japan 2002 32 / 64 161 2.52 260 / 17 4.06 / 0.27 2,705,197 42,269 France 1998 32 / 64 171 2.67 250 / 22 3.91 / 0.34 2,785,100 43,517 USA 1994 24 / 52 141 2.71 221 / 15 4.25 / 0.29 3,587,538 68,991 Italy 1990 24 / 52 115 2.21 165 / 16 3.17 / 0.31 2,516,215 48,389 Mexico 1986 24 / 52 132 2.54 137 / 8 2.63 / 0.15 2,394,031 46,039 Spain 1982 24 / 52 146 2.81 99 / 5 1.90 / 0.10 2,109,723 40,572 Argentina 1978 16 / 38 102 2.68 59 / 3 1.55 / 0.08 1,545,791 40,679 Germany FR 1974 16 / 38 97 2.55 87 / 5 2.29 / 0.13 1,865,753 49,099 Mexico 1970 16 / 32 95 2.97 51 / 0 1.59 / 0 1,603,975 50,124 England 1966 16 / 32 89 2.78 21 / 5 0.66 / 0.16 1,563,135 48,848 Chile 1962 16 / 32 89 2.78 1 / 6 0.03 / 0.19 893,172 27,912 Sweden 1958 16 / 35 126 3.6 0 / 3 0 / 0.09 819,810 23,423 Switzerland 1954 16 / 26 140 5.38 0 / 3 0 / 0.12 768,607 29,562 Brazil 1950 13 / 22 88 4 1 / 0 0.05 / 0 1,045,246 47,511 France 1938 15 / 18 84 4.67 0 / 4 0 / 0.22 375,700 20,872 Italy 1934 16 /17 70 4.12 0 / 1 0 / 0.06 363,000 21,353 Uruguay 1930 13 / 18 70 3.89 0 / 1 0 / 0.06 590,549 32,808
  • 2. Total attendance: 3,429,873 Average attendance: 53,592 Number of goals: 171 Goal average: 2.67 Most goals scored: 18 Germany Least goals scored: 1 Cameroon 1 Honduras 1 Iran Most goals conceded: 14 Brazil Least goals conceded: 2 Costa Rica Number of penalties: 13 (12 converted, 1 missed) Number of own goals: 5 Goals scored by substitutes: 32 (out of 171, 18.71%) Goals first half v. second half: 65 v. 98 -goals in additional time 1st half: 3 -goals in additional time 2nd half: 12 Goals in first 10 minutes: 11 (6.43%) Goals in last 10 minutes: 35 (20.47%) Goals in extratime: 8 (4.68%) Top goalscorer: 6 RODRIGUEZ James (COL) Youngest goalscorer: 19y 0m GREEN Julian (USA), 01.07.2014 (Belgium - USA) Fastest goal: 0' 30" DEMPSEY Clint (USA), 16.06.2014 (Ghana - USA) Highest number of assists: 4 CUADRADO Juan (COL) 4 KROOS Toni (GER) Highest wins: 1 - 7, 08.07.2014 (Brazil - Germany) Highest-scoring matches: 1 - 7, 08.07.2014 (Brazil - Germany) Highest number of wins: 6 Germany Highest number of defeats: 3 Australia 3 Cameroon 3 Honduras Number of yellow cards: 181 (avg/game 2.83) Number of red cards: 10 (avg/game 0.16) Most yellow cards: 14 Brazil Least yellow cards: 2 Portugal Most red cards: 1 Belgium 1 Cameroon
  • 3. 1 Costa Rica 1 Croatia 1 Ecuador 1 Greece 1 Honduras 1 Italy 1 Portugal 1 Uruguay Goal Line Technology (GLT)  First FIFA World Cup to utilise the Goal Line Technology during the competition  Goal-line incidents: 3  Goal-line replays televised: 10 Event Operations  1,453 Hyundai and Kia vehicles and 422 buses transporting media, referees, the 32 teams, FIFA staff and authorities in the 12 host cities  Approximately 200,000 m2 of signage and decoration at the 12 stadiums  2,952 linear metres of LED panels of Electronic Advertising  5,500 communication radios for FIFA/LOC staff  More than 2.3 million Coca-Cola drink bottles, including water, juice, soda water, soft drinks and Powerade (average bottle size of 500ml), for the 32 teams, the 14,000 volunteers and FIFA/LOC staff alone o Approximately 1.15 million litres of drinks for the 32 teams, the 14,000 volunteers and FIFA/LOC staff alone  150,000 meals and 50,000 snacks for volunteers and staff  250,000 meals sold in third-party operated restaurants for staff within stadiums  A total of 3,240 adidas balls have been used for the whole tournament (including training balls and match balls) Participation  3,389 children participating in the FIFA Youth Programme visited FIFA World Cup stadiums for a unique experience on the pitch, whether escorting the players, carrying the team flags, the FIFA or the “Fair Play” flag, or acting as ball boys or ball girls. Over 25,000 adidas products for the Youth Programme  152,000 volunteers registered  14,000 LOC/FIFA volunteers selected to work at the FIFA World Cup and over 125,000 adidas volunteer uniform items  240,000 accreditations printed (143,000 individualized, 103,000 generic) o 36,000 day passes o 178,000 wristbands o 174,000 SADs o 380,000 other access devices
  • 4. Ticketing  More than 11 million ticket applications received  Total allocated tickets: 3,141,908  64% of the tickets allocated to Brazilians and 36% to international fans  Top-20 countries in terms of ticket sales Countries Combined: Tickets Allocated to General Public and PMA Supporters (by Residency) Brazil 1,636,294 USA 203,964 Argentina 63,128 Germany 60,991 England 58,690 Colombia 56,638 Australia 52,509 Chile 40,200 France 35,347 Mexico 35,006 Canada 30,026 Japan 22,942 Switzerland 17,880 Netherlands 16,374 Uruguay 16,142 Spain 13,886 Israel 12,433 Ecuador 11,762 Russian Federation 10,858 Italy 10,155 Teams • More than 300 tons of team equipment • More than 500 hours of domestic flights with the delegations • 280,000 km flown by the teams or 7 laps around the world • Almost 18,000 passengers transported • 250 domestic flights with the participating teams • 570 domestic flights with the referees • 62 arrivals and departures of international flights involving teams • 492,000 m2 of grass of selected pitches maintained • 11 tons of Winter seeds for the pitch management • 2,300 litres of paint for pitch marking • 450 training sessions in the Team Base Camps (TBCs) • More than 50 training sessions in the Venue Specific Training Sites (VSTSs) in the host cities • Almost 100 training sessions in the stadia on match days - 1 • 2,740 towels provided by adidas for players and referees • 22,000 toilet kits (shampoo, soap and toilet bags) for players and referees
  • 5. Medical services  More than 2,000 health professionals at the stadia  112 ambulances at the stadia  105 medical posts at the stadia  Medical Encounters on Match Days: 6,230  Matches – 64  Average per Match – 97  % of Attendance – 0,16 % o (Expected Range - 0,1% to 0,3%)  Medevacs from Stadium – 159  % of Medical Encounters – 2,55% o (Expected Range 3,0% to 5,0%)  7,218 free health screenings for Volunteers conducted by Johnson and Johnson  83,760 Johnson and Johnson care packages distributed Spectator services  Wristband to identify kids: more than 20,000  Found items: 1,326  Lost children: 72 (all cases solves in 5 min max)  Wheelchair service: 5,305  Total number of printed media accreditations: 16,746 (more than 10,000 for broadcasters including technicians) Host Broadcaster 3,048 International Photographer Total for Category 725 International Press Total for Category 2033 International Technician Photo/Press Total for Category 63 Total International Media 2,821 Local Photographer Total for Category 126 Local Press Total for Category 331 Total Local Media 457 National Photographer Total for Category 111 National Press Total for Category 262 National Technician Photo/Press Total for Category 6 Total National Media 379 TV/Radio 10,044  120,000 bottles of water distributed in press boxes  Media working area of 58,043 m2  10,936 places for written press in the 12 stadiums
  • 6. FIFA TV achievements  Record figures from all FIFA World Cup Groups  “Watershed” moment for football in the United States – beat TV viewing figures for 2014 NBA Finals and 2013 World Series  FIFA TV expects bigger global audience than 2010 (numbers still to be consolidated)  FIFA TV expects that more than one billion people have watched some coverage of the Final Match, including out-of-home viewing (numbers still to be consolidated)  All-time high TV viewing records in Germany, the Netherlands and Belgium  The final between GER v ARG attracted the biggest audience in German TV history, breaking the record set in the semi-final as an average 34.7 mln watched on ARD.  Breakthrough all-time record figures in online streaming of matches in the USA  Most data ever streamed for an event as fans watch online  Biggest audience for a TV show in France for 7 years  Biggest audience for a TV show achieved in UK, Italy, Spain and Portugal for 2 years  Pioneered next generation Ultra HD technology and other innovations: o 3 matches, including Final, produced live in 4K o showcased 4K in cinema o 9 matches test-produced in 8K o biggest ever and most advanced multimedia production for tablets, computers and mobile phones o 360 degree Ultra HD film of Final for the FIFA World Football Museum IBC (International Broadcast Centre) at Riocentro  Area of 70,000 m², including both indoor and external areas  Security provided 24 hours per day, 7 days a week, during FIFA exclusive use period  2,750 hours of content produced  450 km of cables (distance from Rio to Sao Paulo by car)  29,000 m² of carpet  2.9 km of cable trays  All matches transmitted in HD, some in 4k and some in 8k  290 HD cameras  A peak of 1,750 people working during the event  214 countries receiving the TV signal from the event Digital  Attendance in FIFA’s Global Stadium exceeds 1 billion fans (equivalent to 13,380 time the seating in Maracana)  The official FIFA app recently became the biggest sports event app of all time with a record 28 million downloads.  An impressive 451 million Facebook users were reached with official FIFA social content, while FIFA’s Twitter followers surpassed the 16-million mark, with an average of ten new followers per second recorded on the opening match day. The official FIFA World Cup Instagram app increased from 42,000 to 0.8 million followers in 31 days, a growth rate of over 1,600 per cent.  More than 40 billion impressions of official FIFA World Cup digital content
  • 7. FIFA Fan FestTM  12 FIFA Fan Fest venues (one in each host city)  Open on a total of 281 days  748 live performances  760 hours of music  Featuring 1,191 square metres of high quality giant screens Attendance by city: City Attendance Belo Horizonte 255,403 Brasilia 369,480 Cuiaba 306,896 Curitiba 112,836 Fortaleza 781,602 Manaus 504,108 Natal 195,062 Porto Alegre 497,893 Recife 132,510 Rio de Janeiro 937,330 Salvador 255,040 São Paulo 806,226 Total 5,154,386 International FIFA Fan Fest  Hosted in 6 cities (Kaliningrad, Samara, Niyhny Novgorod, Saransk, Volgograd and Ekaterinburg)  Open on a total of 28 match days  Total attendance of 142,000 for the 3 matches of the Russian national team Licensing Brazil licensing programme: • 1 Local Master Licensee • 1 Official On-Site Merchandising Operator • 1 Official Online Store Operator • 1 Official TV Shopping Operator • 70 Official Licensees • 2,000 different Official Licensed Products developed • 22 million Official Licensed Products in the market • 72 stores within on-site merchandising project • 2 Megastores (2,000m2 & 500m2) during the tournament in Rio de Janeiro and Fortaleza and 4 other merchandising stores linked to FIFA Fan Fest activities • 14 Official Airport Stores across Brazil
  • 8. • 3 Official Fan Shops located in Shopping Malls • 11 Official Kiosks International licensing programme: • 69 Official Licensees • 3 Official Online Store Operators • 5 Direct-To-Retail Official Licensees • 7 Official Event Store partners • 2 Official Fan Shop partners • 3 licensing agencies in Asia Pacific • FIFA Official Online Store available in 189 countries • 935 dedicated retail corners at Official Event Stores • Approx. 14,000 retail outlets featured direct-to-retail Official Licensed Products • 77 million Official Licensed Products in the market Food & Beverage (Stadium concessions) Recruitment:  More than 15.000 jobs created for the Food & Beverage operation (excluding Hospitality areas)  166,035 applicants registered on the recruitment website for the stadium catering services  30,554 applicants were interviewed after successfully registering on the recruitment website Suppliers:  More than 100 suppliers of food services  Nearly 15 local catering companies involved Menu offer and sales: • 3,127,674 sales transactions throughout the 64 matches  Menu offer including 9 Brazilian dishes and 22 international dishes or snacks • More than 800,000 servings of food (including hot and cold sandwiches, Barbecue, Feijão Tropeiro and Tambaqui de Pé) • 34,601 portions of Feijão Tropeiro (local dish in Belo Horizonte) • 6,738 portions of Tambaqui de Pé (local dish in Manaus) • More than 3 million units of beer (Brahma, Budweiser and Brahma Zero) • More than 2 million units of soft drinks (Coca-Cola, Coca-Cola Zero, Guaraná Kuat, Sprite, Powerade Mountain Blast, Água Crystal and Matte Leão Natural) • Nearly 750,000 units of snacks (including popcorn, salty snacks, chocolate, ice cream, Bolo de Rolo and Biscoito Globo) Number of stadium F&B points of sale: • Belo Horizonte: 38 • Brasília: 45 • Cuiabá: 27 • Curitiba: 37 • Fortaleza: 40 • Manaus: 23 • Natal: 19
  • 9. • Porto Alegre: 54 • Recife: 20 • Rio de Janeiro: 38 • Salvador: 35 • São Paulo: 35 Hospitality • 290,000 Hospitality Packages sold (58% domestic vs. 42% international) • 373,000 Hospitality Guests (second biggest FIFA World Cup hospitality guest number ever) • 9 Hospitality Villages • 130 Hospitality Lounges • 780 Hospitality Suites/Skyboxes • 28 Catering companies • More than 15,000 staff including waiters, bartenders, chefs & cooks, technicians, plus 2,260 Hospitality Hostesses (from which 95% Brazilian) • 140,000m2 temporary facilities built (including 60,000m2 tents) • 9,000 tables • 30,000 chairs • 155 tons of food served • 150,000 Champagne glasses • 200,000 plates • 225,000 glasses • 250,000 forks and knives • 250 containers • 250 coffee machines • 400 ovens The FIFA World Cup Trophy Tour by Coca-Cola Global Tour: • The FIFA World Cup Trophy Tour by Coca-Cola began in Rio de Janeiro on 12 September 2013 and concluded in Sao Paulo on 1 June 2014 • Across 267 days the tour; o Travelled 165,000km Carbon Neutral o Visited 90 Countries o Went through 149 airports o Crossed 44 time zones • More than 1 million people got to see the Trophy through a range of events, including; o 45 Heads of State o 33 previous FIFA World Cup™ winners Social Media platforms: • The FIFA World Cup Trophy Tour by Coca-Cola dedicated Facebook page achieved; o More than 4.4 million users o 417 million impressions o 1.9 million likes o 41,700 thousand comments
  • 10. o 48,700 thousand shares. The Official Mascot, FulecoTM Live performances: • Fuleco was present in all 64 matches and 25 FIFA Fan Fests across Brazil, entertaining the fans on and off the pitch 350 times. • He was the ambassador voice of the Waste Management campaign in all 12 stadia which collected around 420 tonnes of waste. • Since Fuleco’s launch in September 2012, he attended a total of 486 events and visited 21 cities in Brazil. • Internationally, Fuleco travelled through 90 countries with the FIFA World Cup Trophy Tour by Coca-Cola. Social Media platforms: • Fuleco’s Facebook Page had 1,376,239 fans, from which 73% are Brazilian and having a total reach of 7,774,274 people (57% Brazil). He was followed on Twitter by 14,100 followers.  45% of FIFA World Cup vehicle fleet used only ethanol, a renewable fuel source  All 14,000 volunteers were trained to provide special services for people with disabilities and reduced mobility  All 12 FIFA World Cup stadiums were non-smoking zones. Smoking was only permitted in designated areas  26 matches in stadiums in Belo Horizonte, Brasilia, Rio de Janeiro and Sao Paulo had audio descriptive commentary for blind or partially sighted people  Stadium workers in all 12 host cities of the FIFA World Cup received training in sustainable operations  Around 4,000 specialised workers were hired by the stadium operators and complementary structures integrators.  Around 420 tons of recyclable waste produced in the stadia and additional FIFA World Cup related facilities were collected and allocated to cooperatives of garbage collectors.  The total investment in the implementation of the FIFA World Cup Sustainability Strategy in Brazil will be approximately USD 20 million, including various social and environmental initiatives. Football for Hope  01-06 July 2014: Cultural and educational activities  07-10 July 2014: Football tournament  26 (at least one per host city) community organisations supported by Football for Hope in Brazil in 2014, with a total of US$ 1.05 million provided. This support will continue in 2015 and 2016  192 young people aged between 15 and 18 from 27 countries took part in the Football For Hope Festival in Caju, in Rio de Janeiro  32 teams participated at the Football for Hope Festival in Caju, in Rio de Janeiro. The teams came from 26 different countries, including eight from Brazil
  • 11.  According to the Getulio Vargas Foundation, 14 million jobs have been created in the last four years because of the FIFA World Cup, the equivalent of 180 Maracana stadiums filled to capacity  15,000 jobs created in stadium catering services  More than 1,200 jobs created in merchandising at the stadia and official event locations  17,000 people working in the area of Hospitality  420 receptionists, with a total of 2,240 daily allowances  More than 29,000 temporary workers employed directly or through third-party service providers o 1,220 permanent workers or temporary workers employed until the 2014 FIFA World Cup o Safety: 20,000 trained, specialised workers responsible for the security and safety of delegations and supporters in official FIFA World Cup areas such as stadiums, Official Training Pitches (COTs), National Team Training Centres (CTSs) and official hotels o Catering services for staff and volunteers: 3,000 indirect workers o Transport: approximately 3,145 indirectly employed drivers. Another 258 indirectly employed staff will work as coordinators, inspectors and dispatchers o Logistics: approximately 800 indirect employees o Protocol: 105 temporary employees to work in VIP and VVIP areas o Events: approximately 800 indirect Jobs created for the opening and closing ceremonies  Approximately 800 agents from waste management cooperatives participated in the selective collection of recyclable waste, supported and funded by Coca-Cola. The job was paid and workers received a uniform, personal protective equipment (PPE) and training.  Stadium operators and those responsible for the administration of supplementary installations employed approximately 4,000 cleaning staff from specialised companies  FIFA invested more than US$ 850 million in the organisation of the FIFA World Cup in Brazil  In hotel accommodation in Brazil alone, FIFA and COL spent more than half a billion reais  FIFA and LOC representatives spent more than 600,000 nights in hotels  In two and a half years, Local Organising Committee representatives have taken than 12,000 flights and flown for approximately 36,000 hours between the 12 host cities  Tax revenue for the host country as a result of investments in the FIFA World Cup shall amount to as much as USD 7.2 billion (Source: Ernst & Young and Getulio Vargas Foundation)  FIFA´s first contribution to the 2014 FIFA World Cup Legacy Fund (launched in Belém on 06 July 2014) will be USD 20 million, but the total amount will be defined after the Brazil 2014 financial results have been calculated. The Legacy Fund will focus on the development of football infrastructure and women's football. The investment is expected to reach the USD 100 million mark.  BRL 29.3 million were spent with Visa-branded products at all FIFA venues, including 12 stadiums and 12 FIFA Fan Fest venues, throughout the 2014 FIFA World CupTM (12 June - 13 July). A total of 582,300 transactions were processed using Visa credit, debit and prepaid cards.
  • 12.  1,210 new laptops deployed for the FIFA World Cup event (Accreditation centres, volunteers, center, Transport locations, Media centers, FIFA venue delegation)  Printing equipment: o 738 black and white A4 desktop printer o 50 color A4 desktop printers o 147 Multifunction desktop equipment (PCFs) o 115 accreditation printers o 134 Multifunction  1,287 LAN ports  814 Analogue lines  71 Fax lines  706 ADSL lines  164 Wireless Access points  1,437 phone handsets  42 Conference phones  32 VOIP phones Media Services • 5,524 LAN managed ports (Free media), including 1672 for the News agencies • 25,000 media network ports across all venues • 619 Wireless access points • 2,457 unmanaged switches • 24,714 RJ45 Cables Network Sizing and Support  A fully redundant Wide-Area Network backbone to support:  22 ISP connections from 2Mbps to 1Gbps;  70 MPLS connections from 6Mbps to 155Mbps;  Two - LAN to LAN connections of 10Gbps  A Local Area and Wireless Network to support staging / deployment / operations / and support of approximately : o 1,000 network elements (including core switches, access switches and firewalls); o 7,900 cat 5e network ports and accessories (patch cords, optical cords, racks, etc.);  The On-site Support & Network Monitoring Team: o More than 4,500 Oi managed professionals to support the event with the SLA, quality and reliability that FIFA requires; o More than 20 Oi professionals to provide real-time monitoring of all the IT&T services and infrastructure deployed and supported by Oi IT&T Information and statistics • Until the end of the FIFA World Cup Final Match, 404,299 devices got connected to the 12 host cities WiFi network. • The highest number of devices simultaneously connected was 7.596 and happened 2 hours before the opening match.
  • 13. • The record of devices simultaneously connected to the WiFi network of a single host city was 2,460 at 18:00h in July 13rd at Maracana during the Final Match between Germany x Argentina. • Until the end of the FIFA World Cup, Media Services had a traffic of approximately 57 Terabytes of data at the network, this would be the same as 15,486,000 photos in high resolution, or 62,283,000 photos in regular resolution, or 12,192 DVDs. • Until the end of the FIFA World Cup, approximately 74 Terabytes of traffic passed through Oi Network (Media + FITS), an amount of information similar to 19,938,000 photos in high resolution, or 80,187,000 photos in regular resolution, or 15.696 DVDs. In terms of comparing, we can make the following considerations: • During the FIFA Confederations Cup 2013, Media Services had traffic of approximately 7 terabytes of data at the network, an amount of information similar to 1 million and 975 thousand photos in high resolution, or 7.310 DVDs. o Until the end of the 2014 FIFA World Cup, the data traffic at the network, which supports the Media Services, was similar to 8.14 FIFA Confederations Cup • During the whole 2010 FIFA World Cup South Africa, the media services had a traffic of approximately 25 Terabytes. o Until the end of the FIFA World Cup, the data traffic at the network was similar to 2.96 the whole data traffic during the 2010 FIFA World Cup South Africa. • From the opening until the end of the FIFA World Cup, the data traffic at the network, which supports the Media Services and non-media (FITS and others)(74 Tbytes) was similar to approximately 7 USA Congress Libraries. Telecommunications Rate Card for broadcasters  IBC : o 407 phone lines o 243 ISDN o 116 ADSL o 56 IP Connect circuits  Venues : o Commentary Positions :  1192 phone liens  561 ISDN o Broadcast Compound :  394 phone lines  211 ISDN  243 ADSL  86 IP Connect