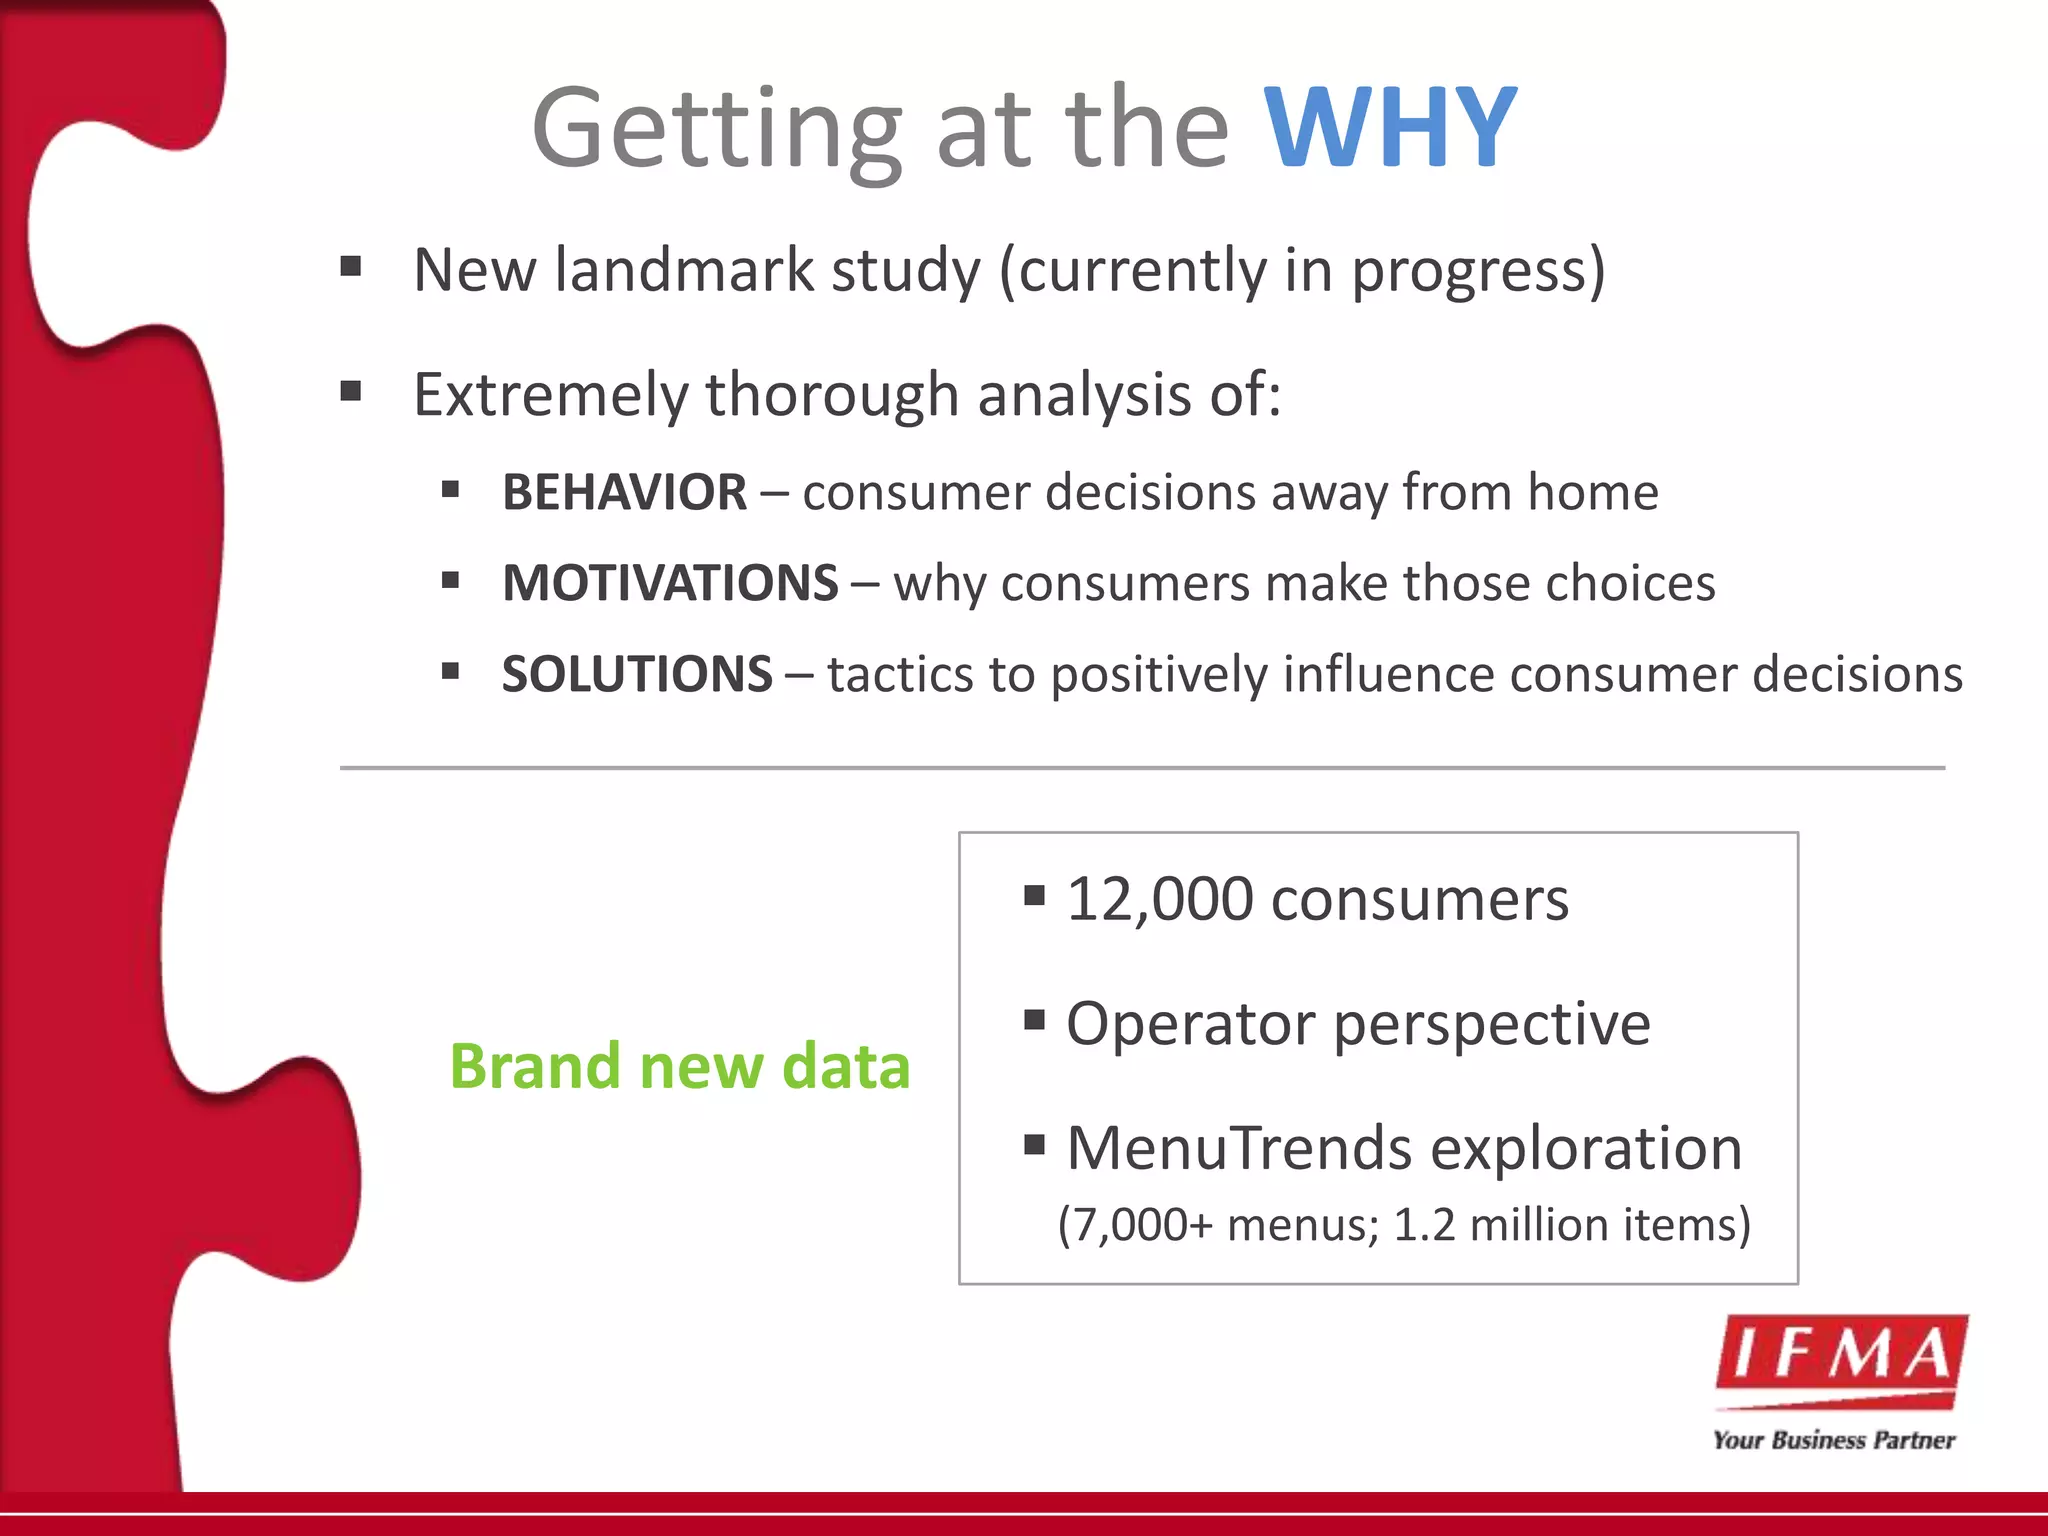
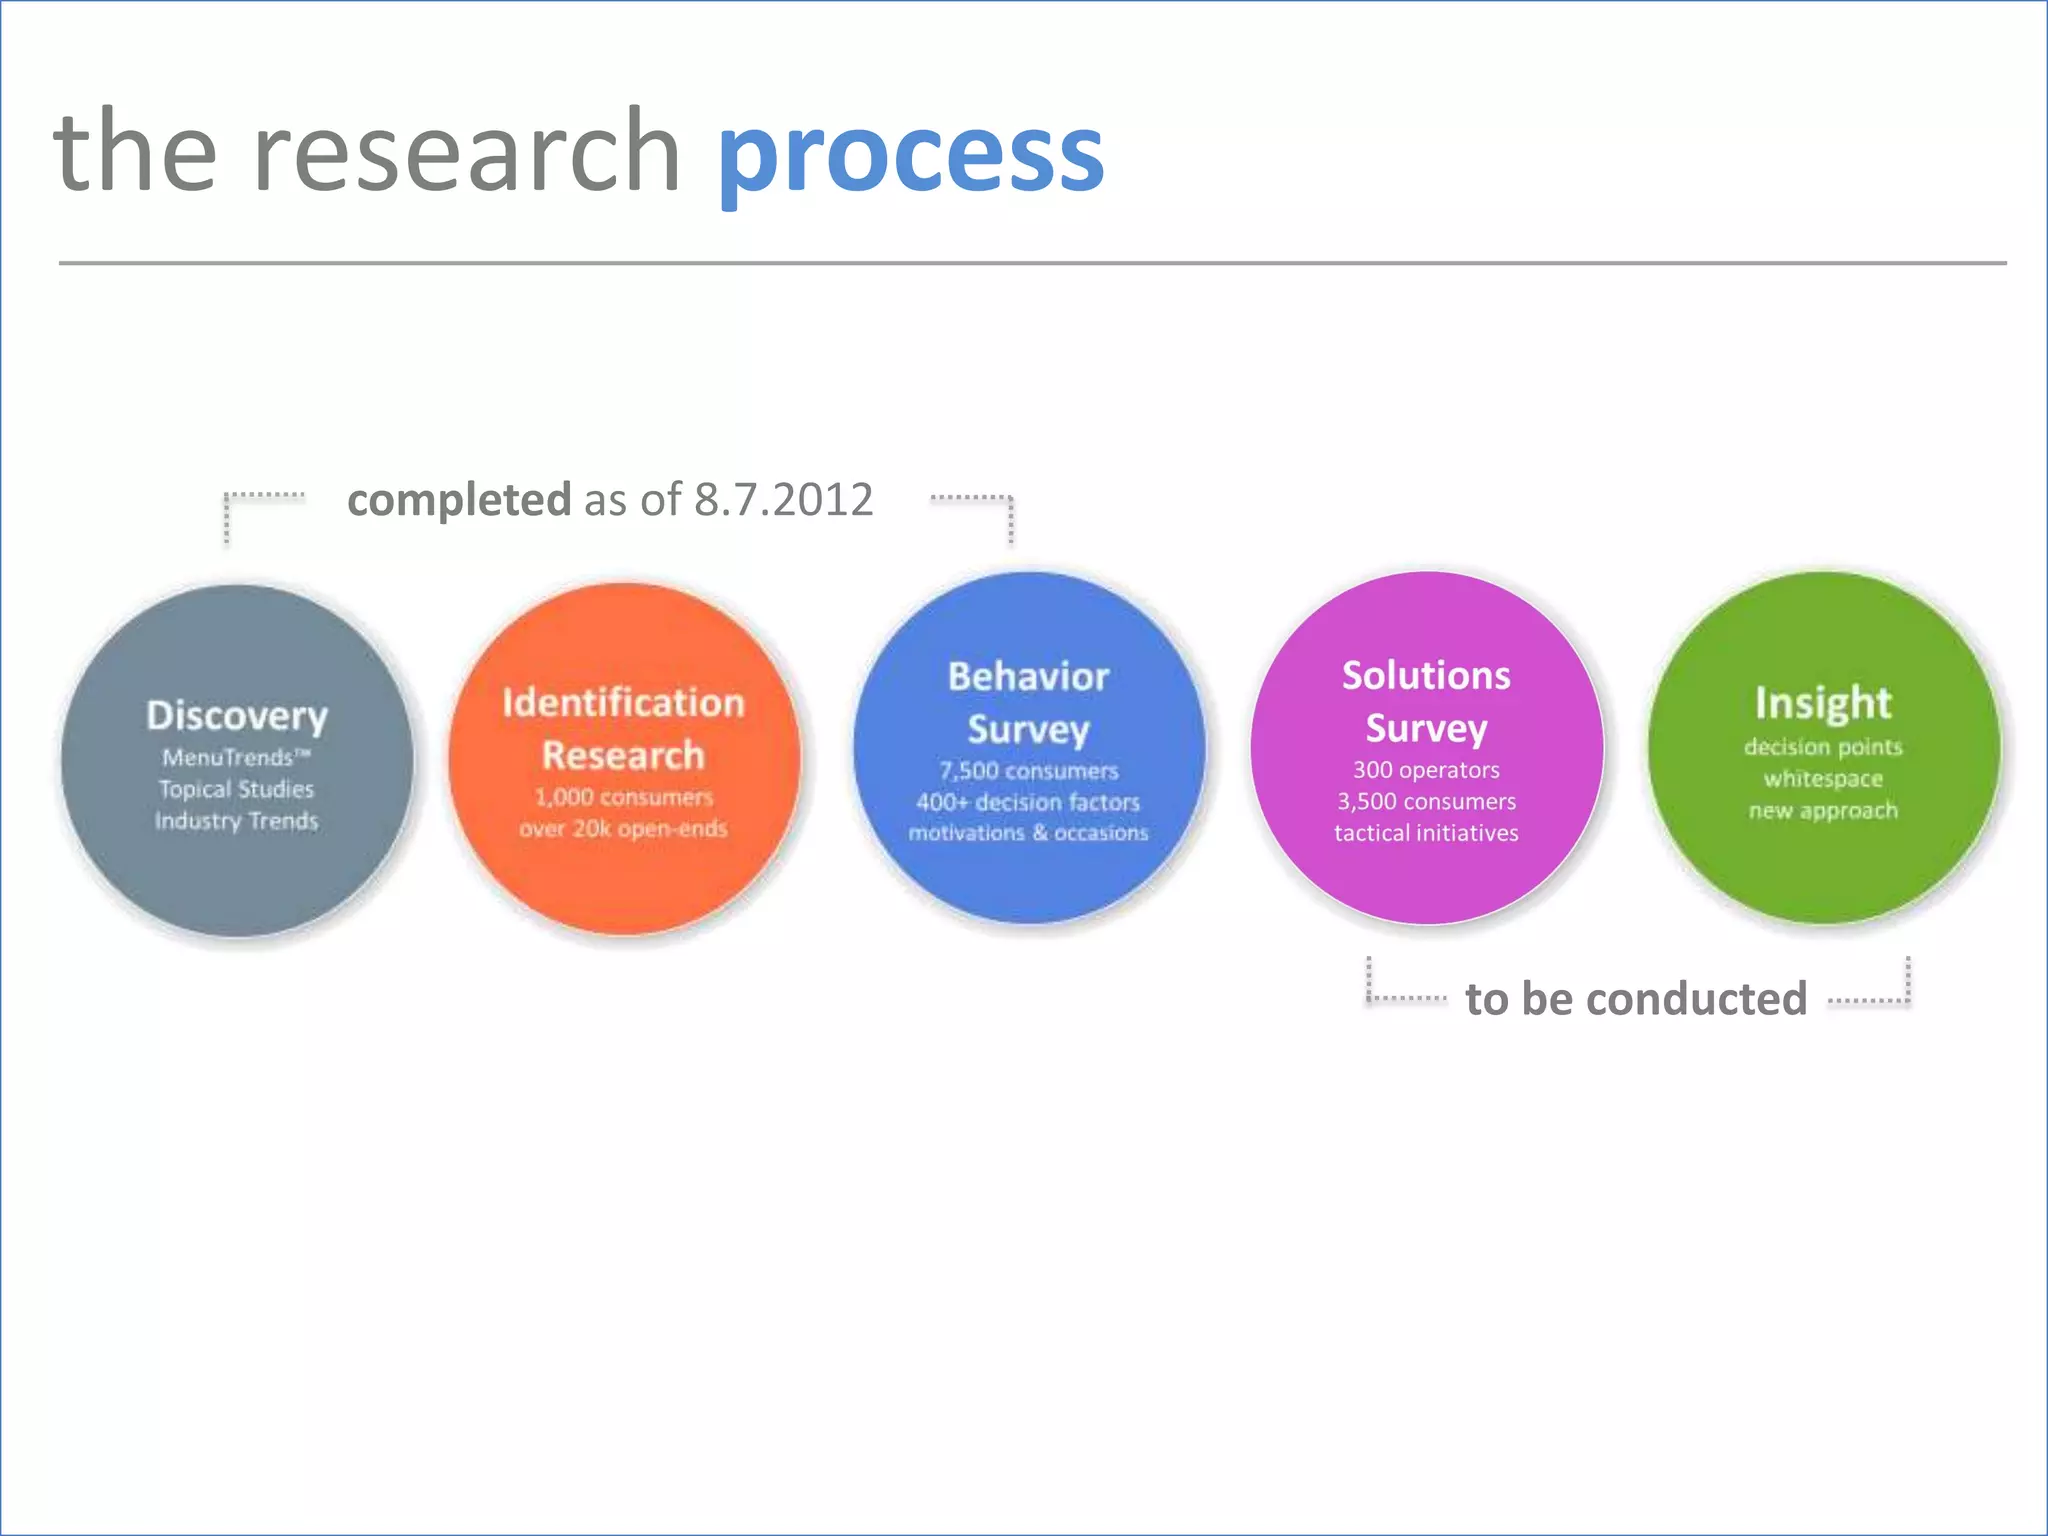
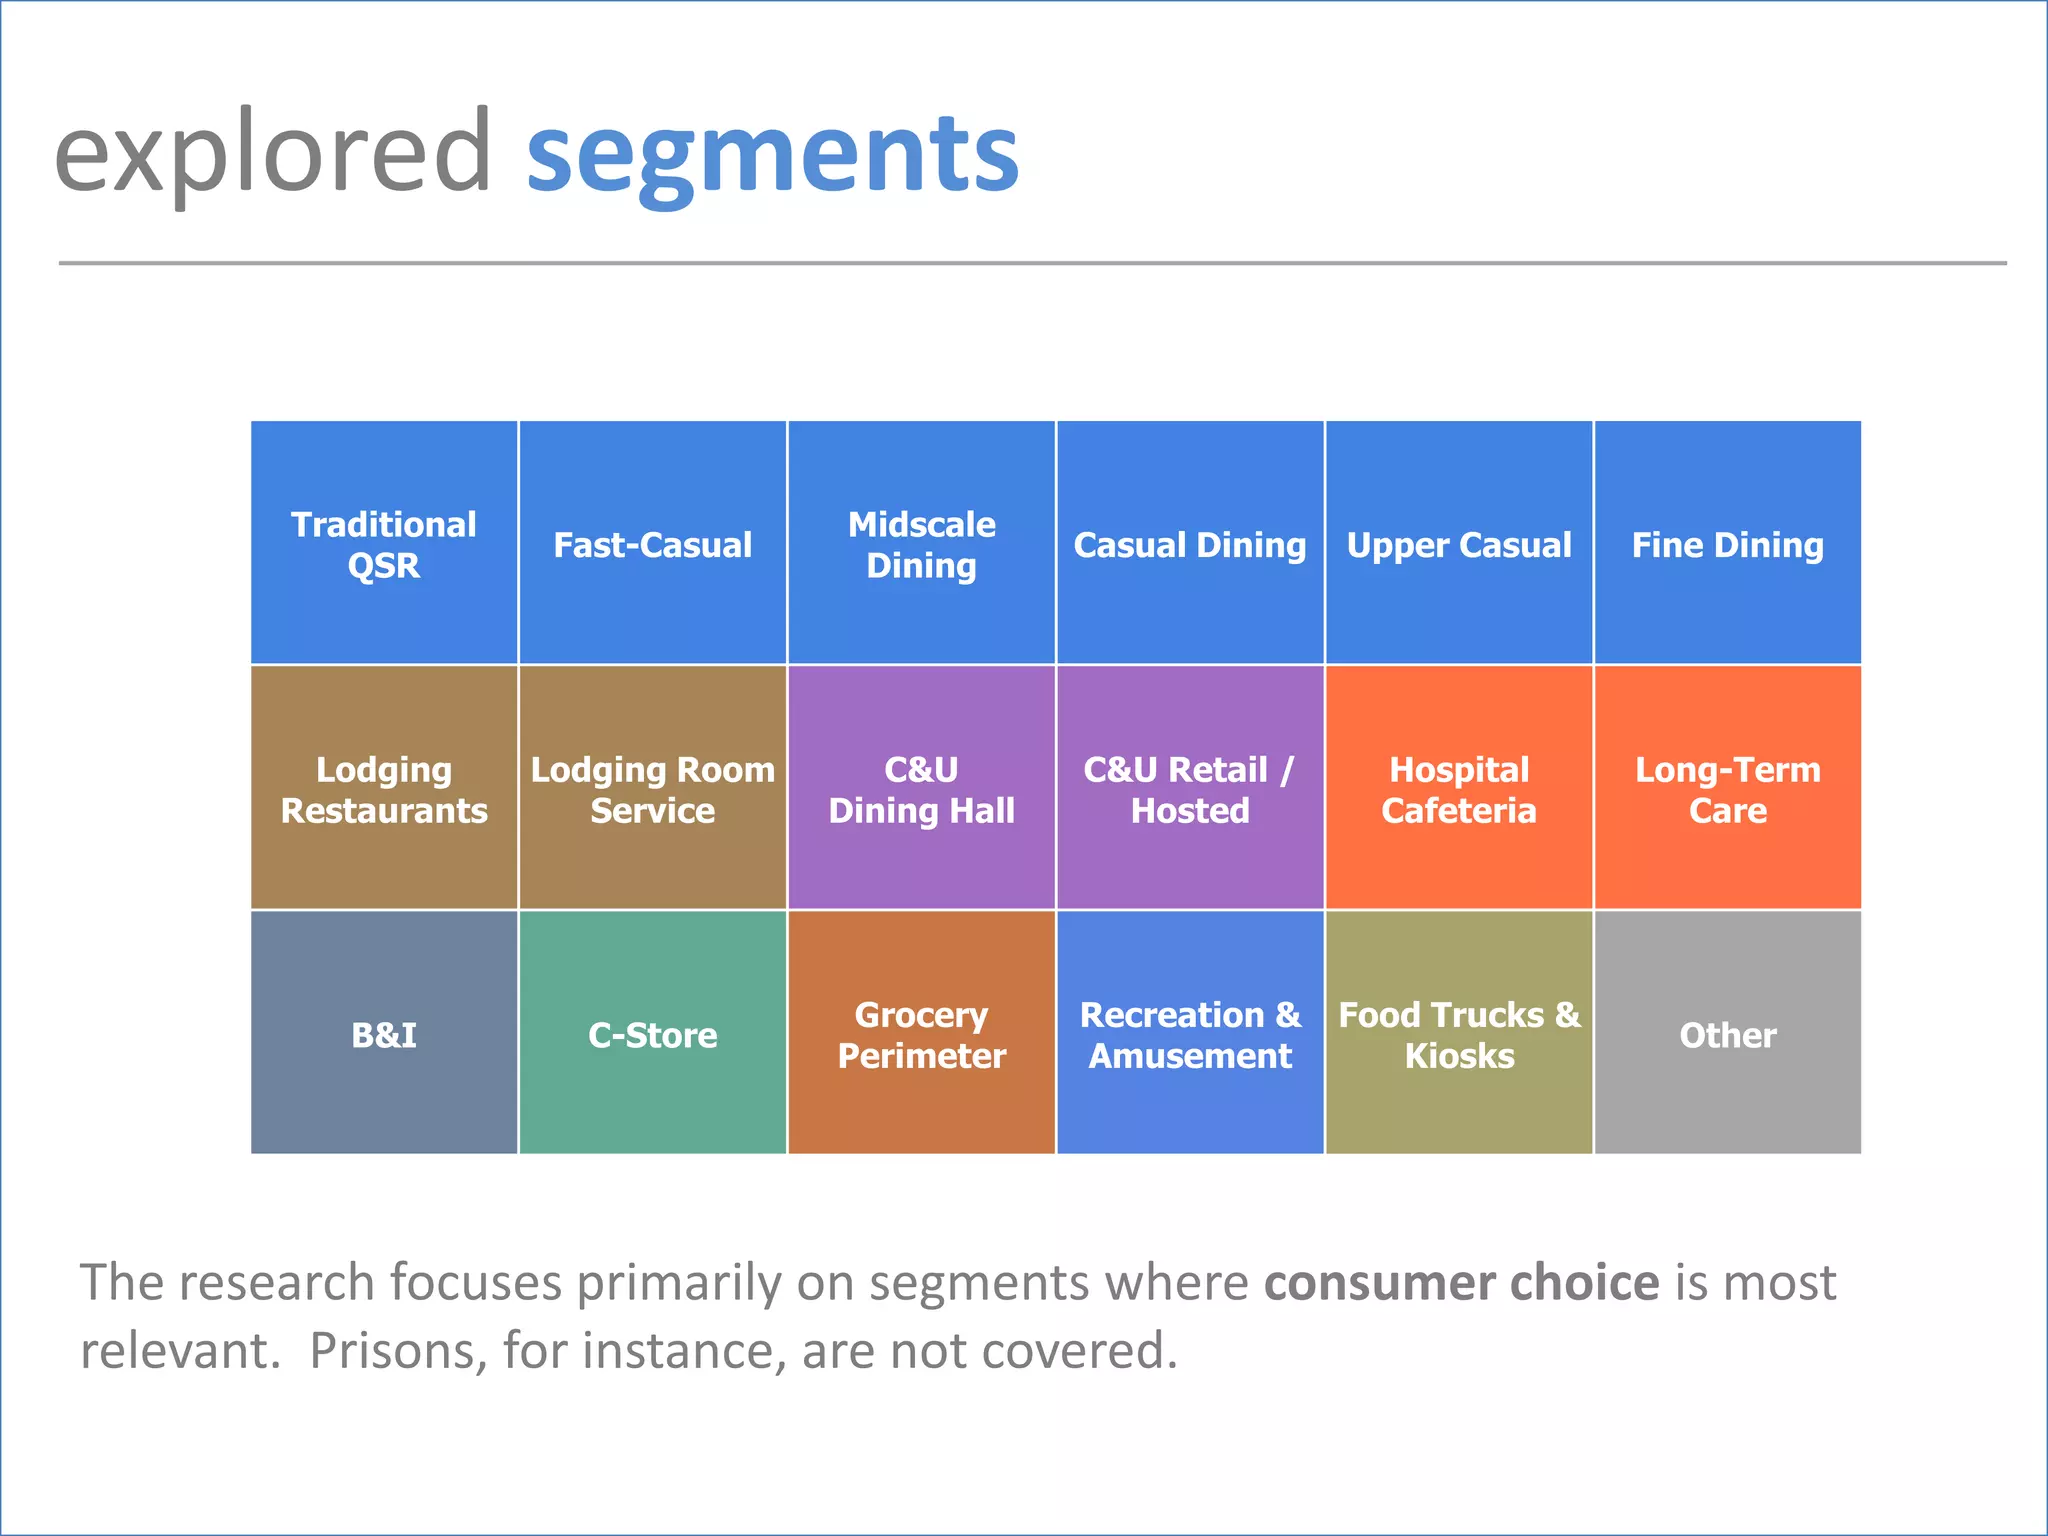
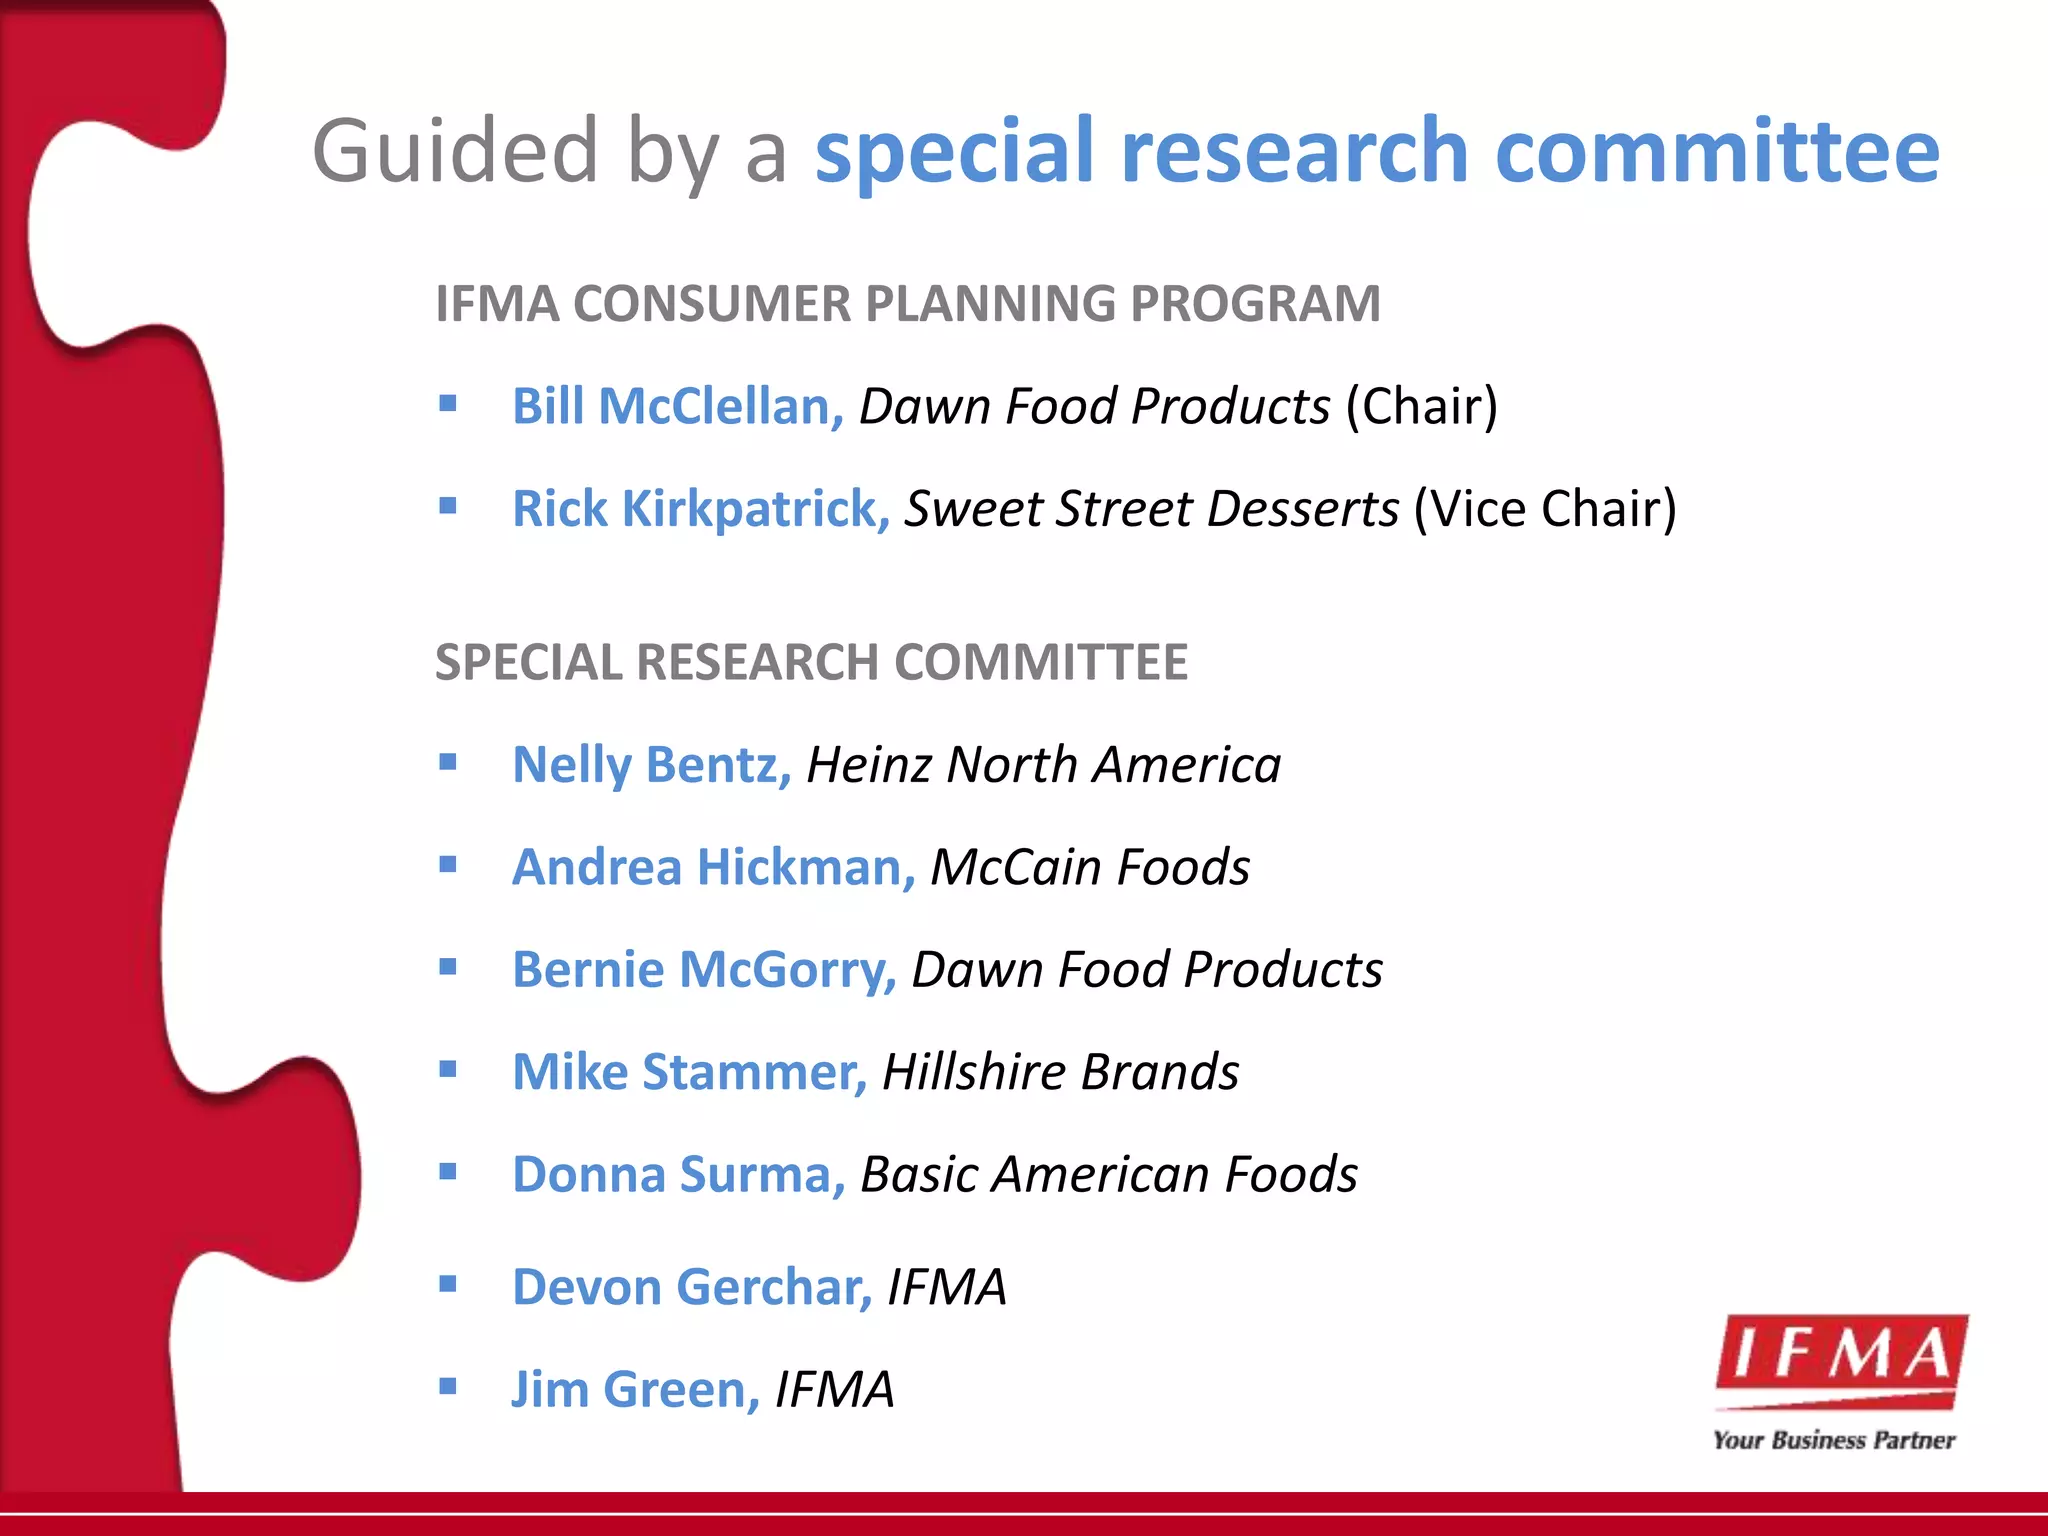
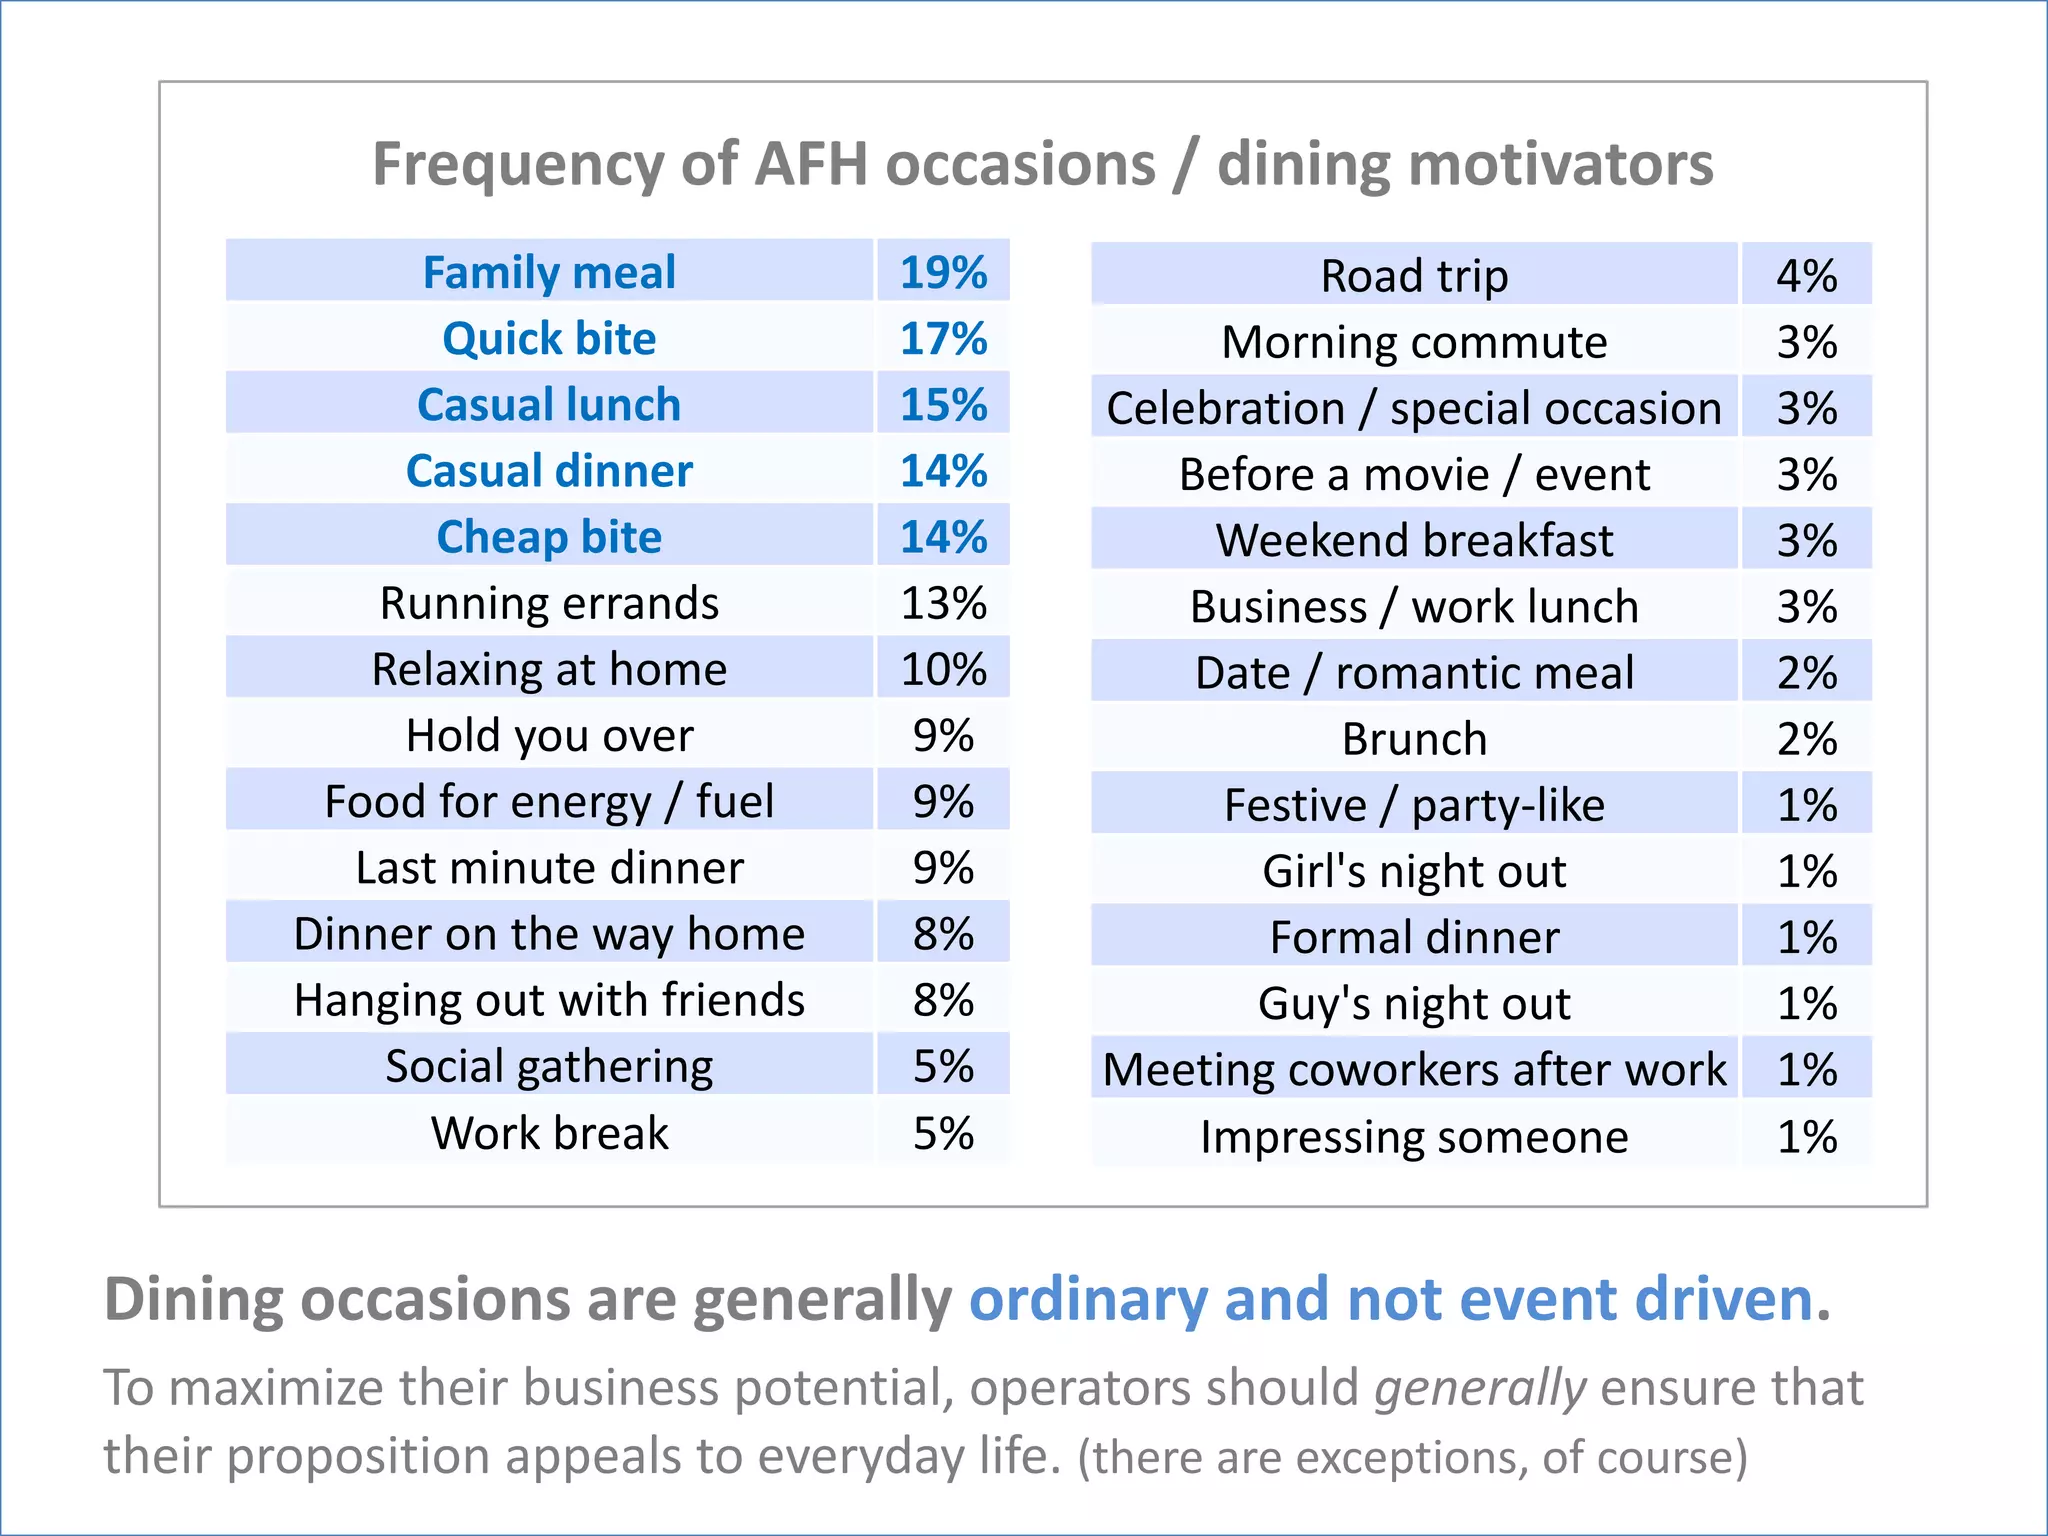
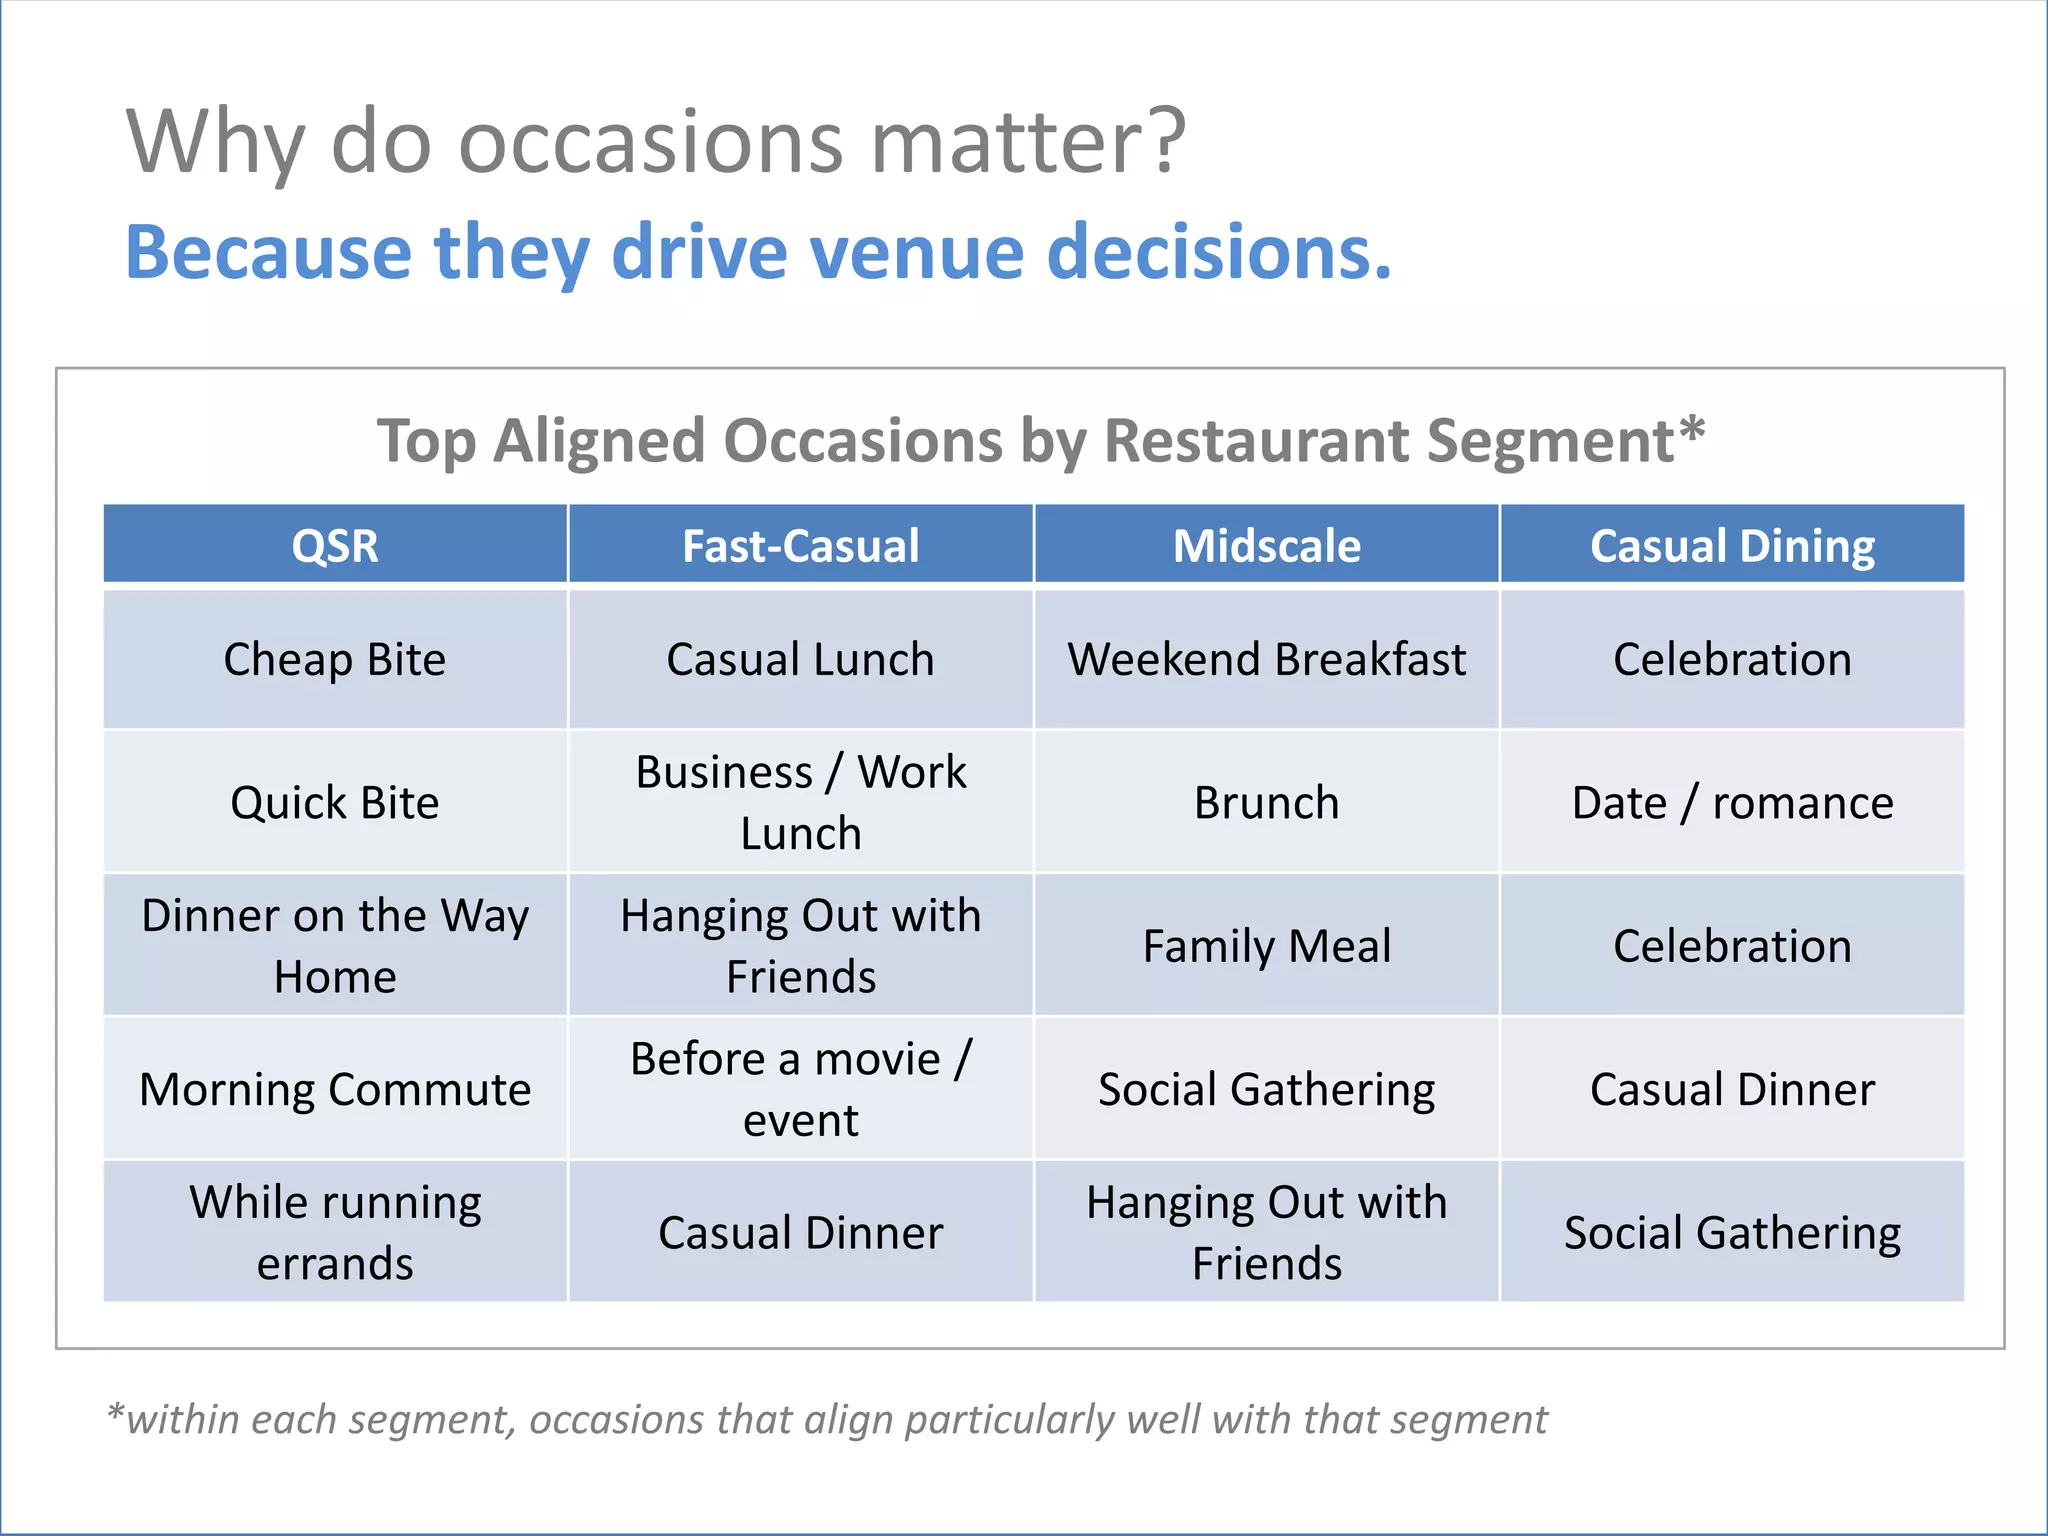
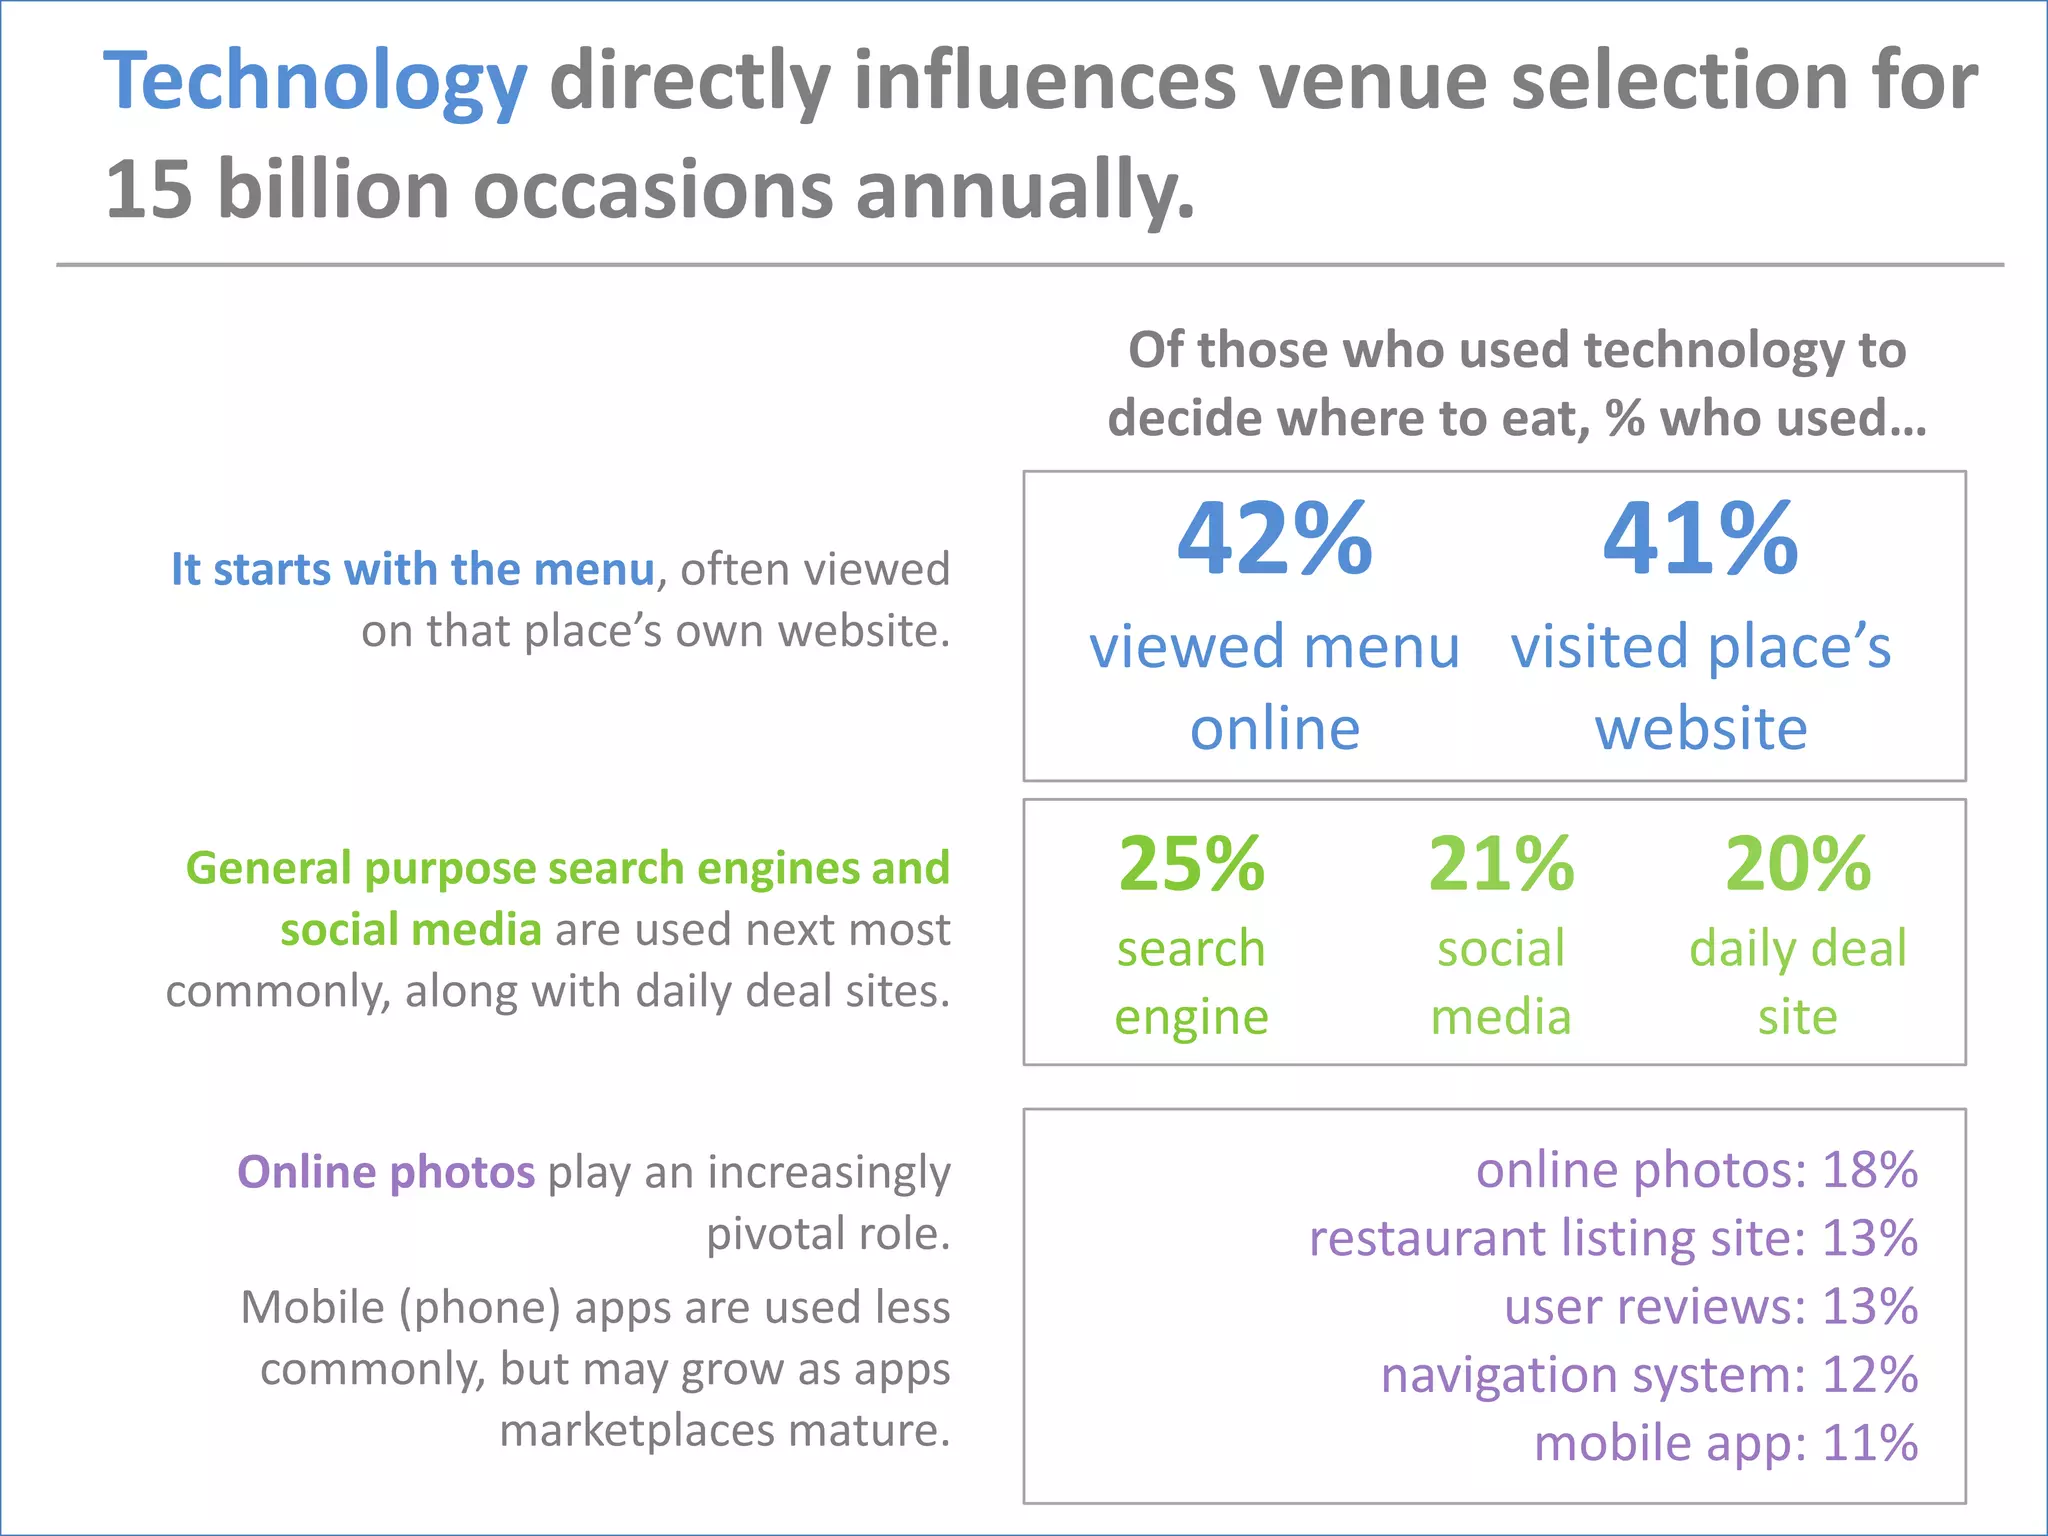
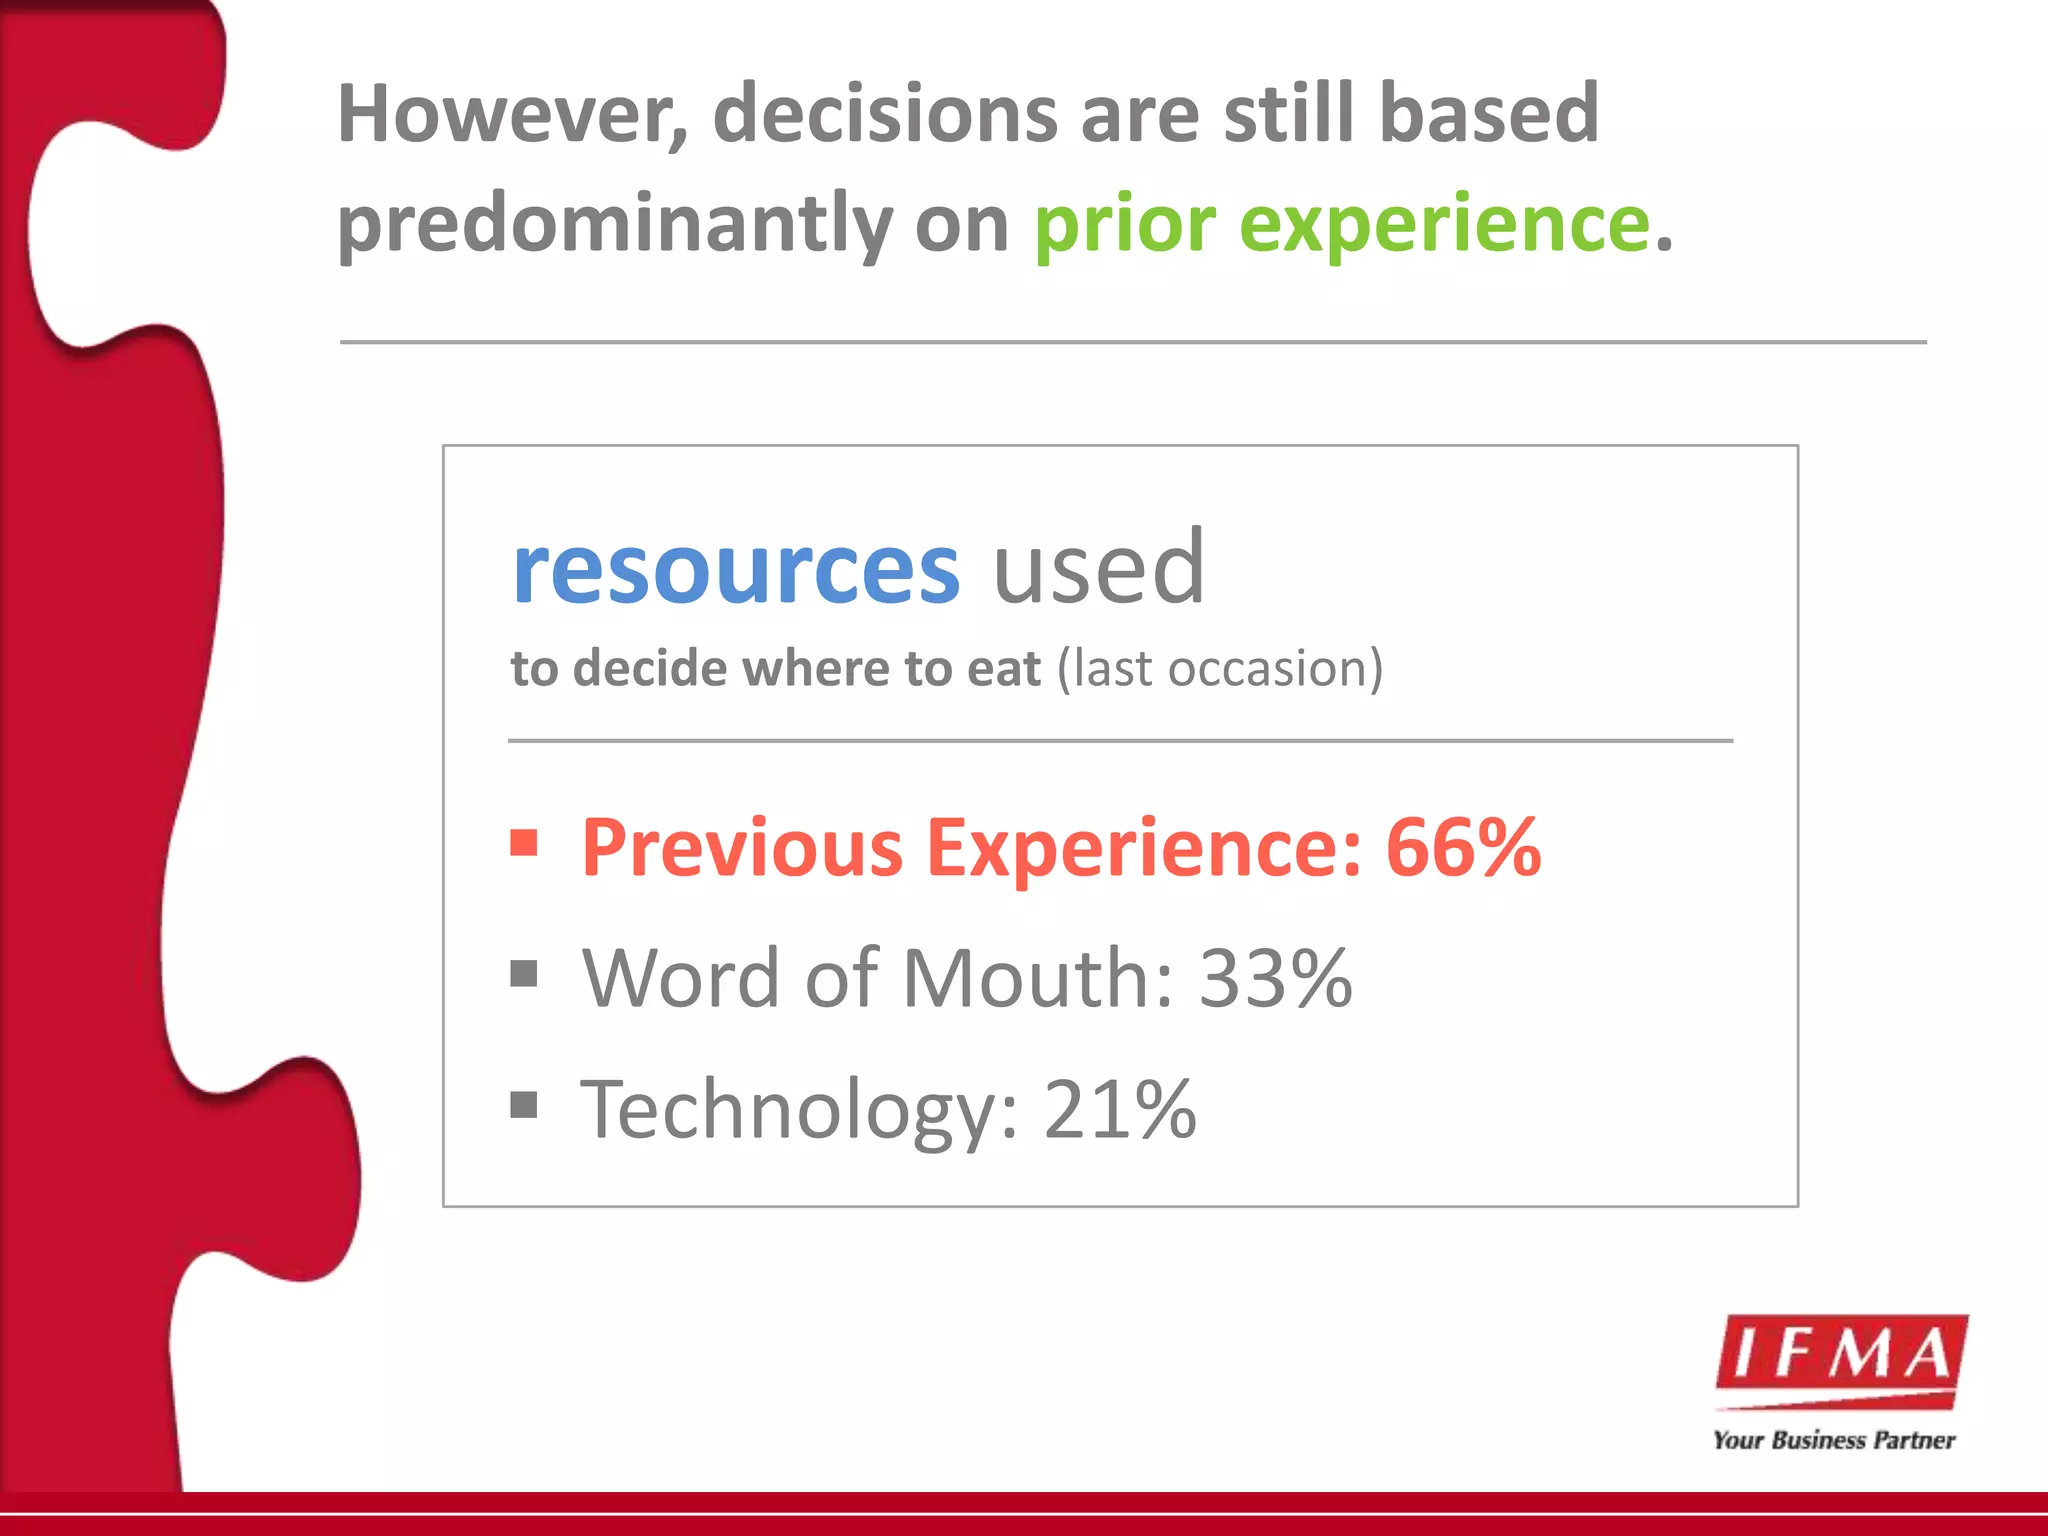
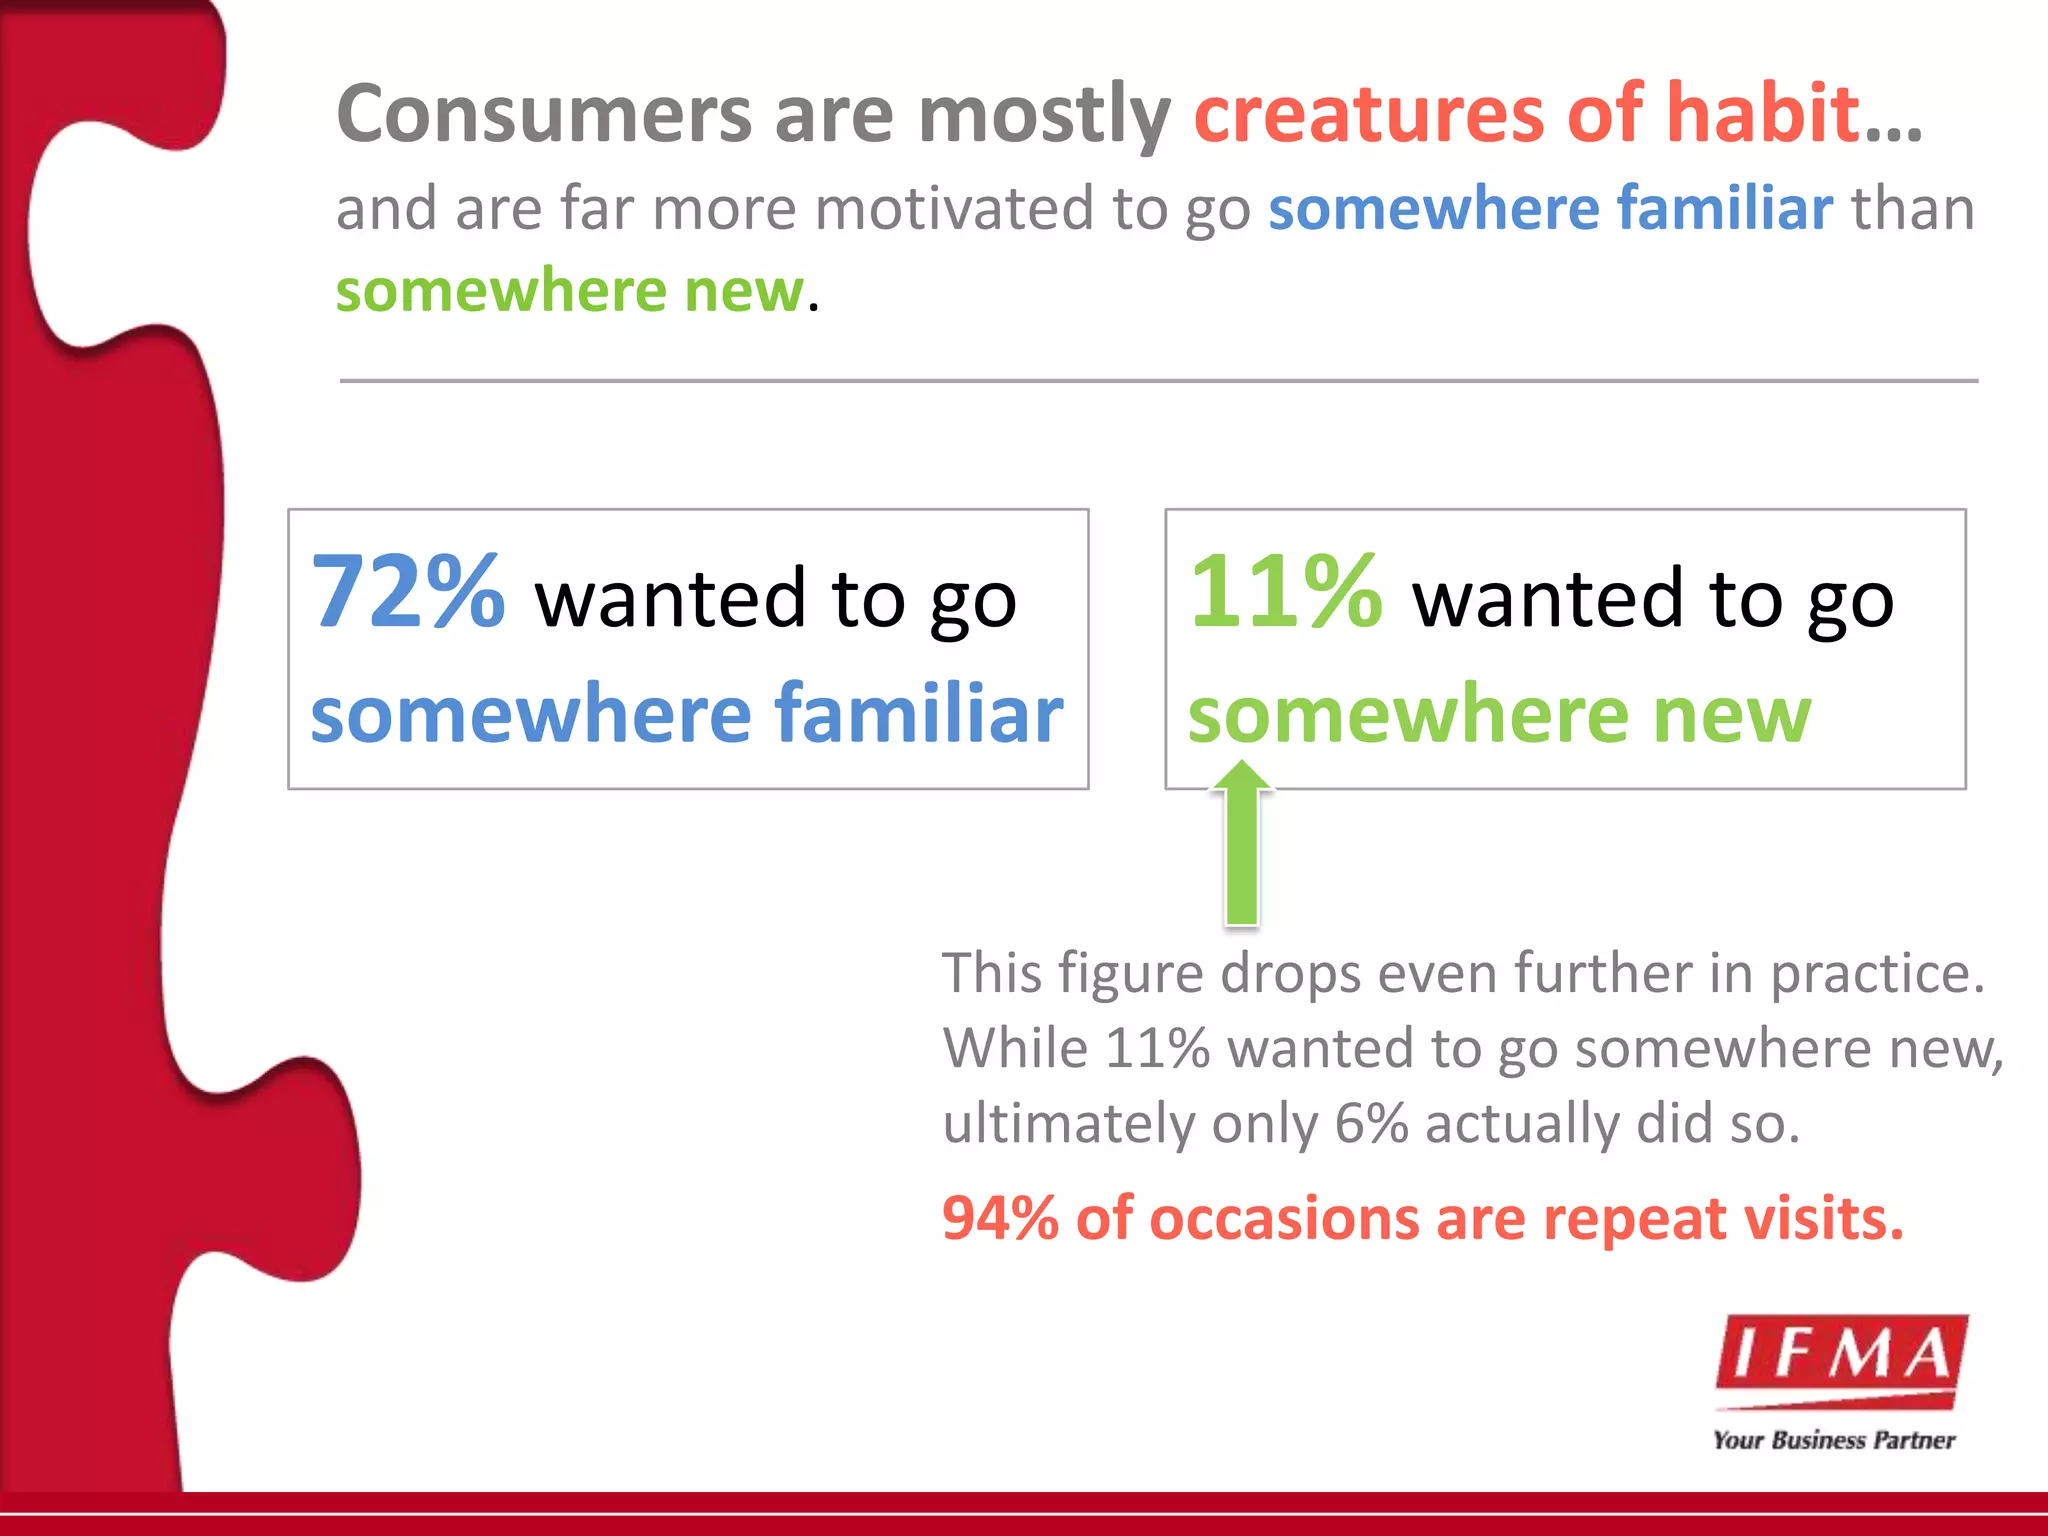
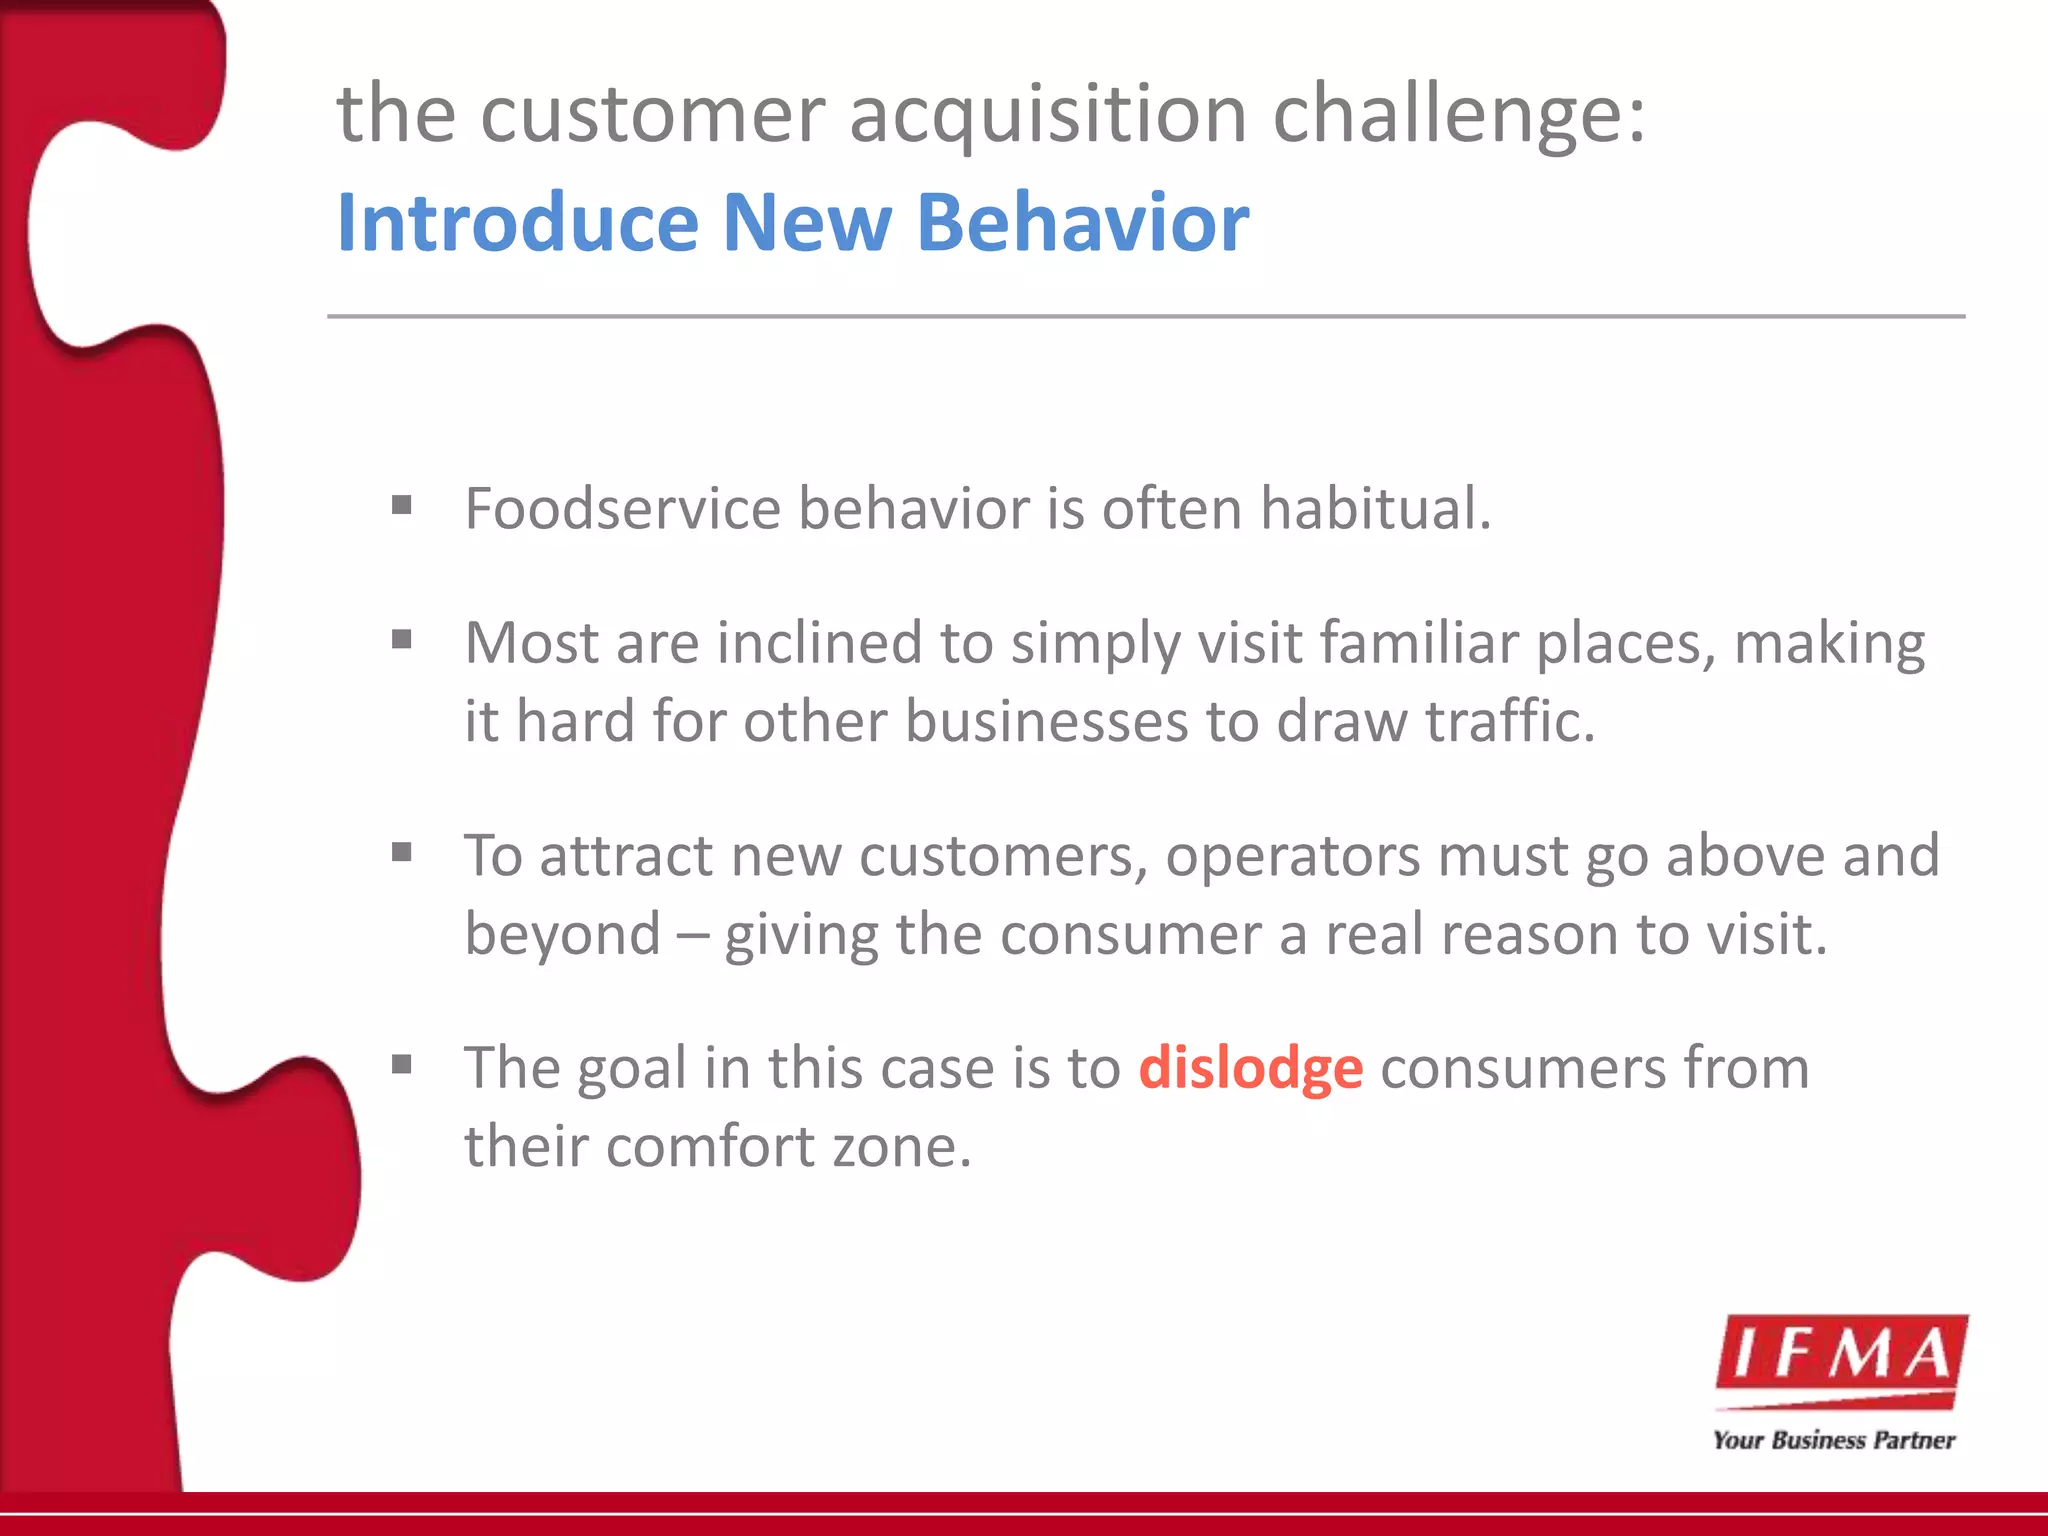
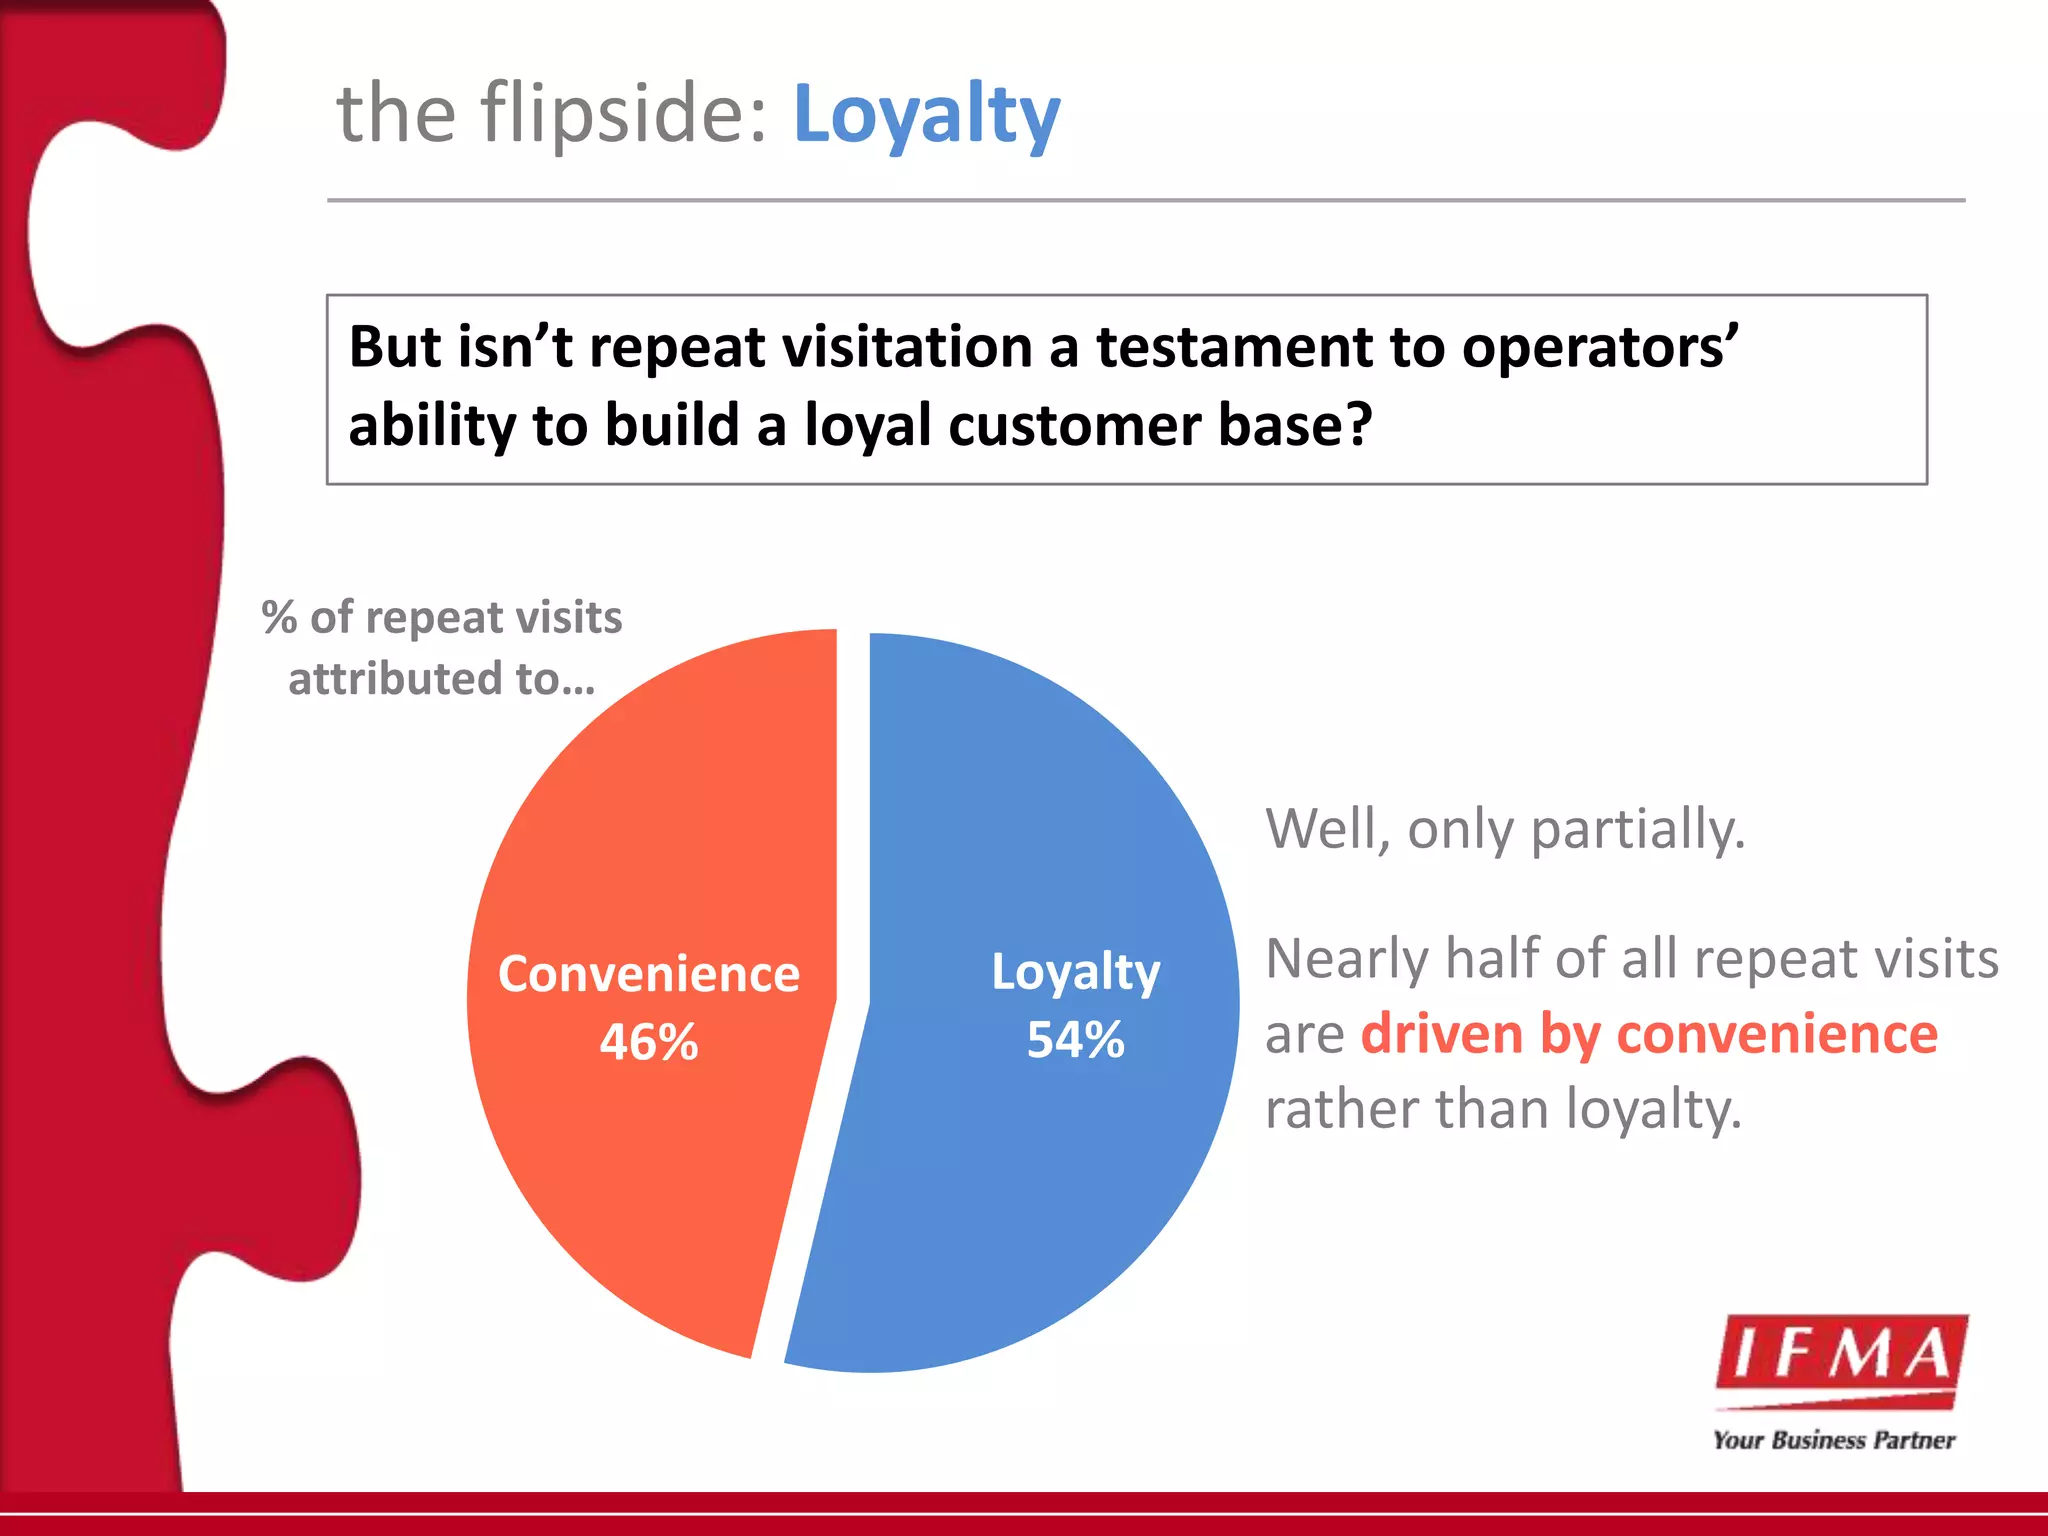
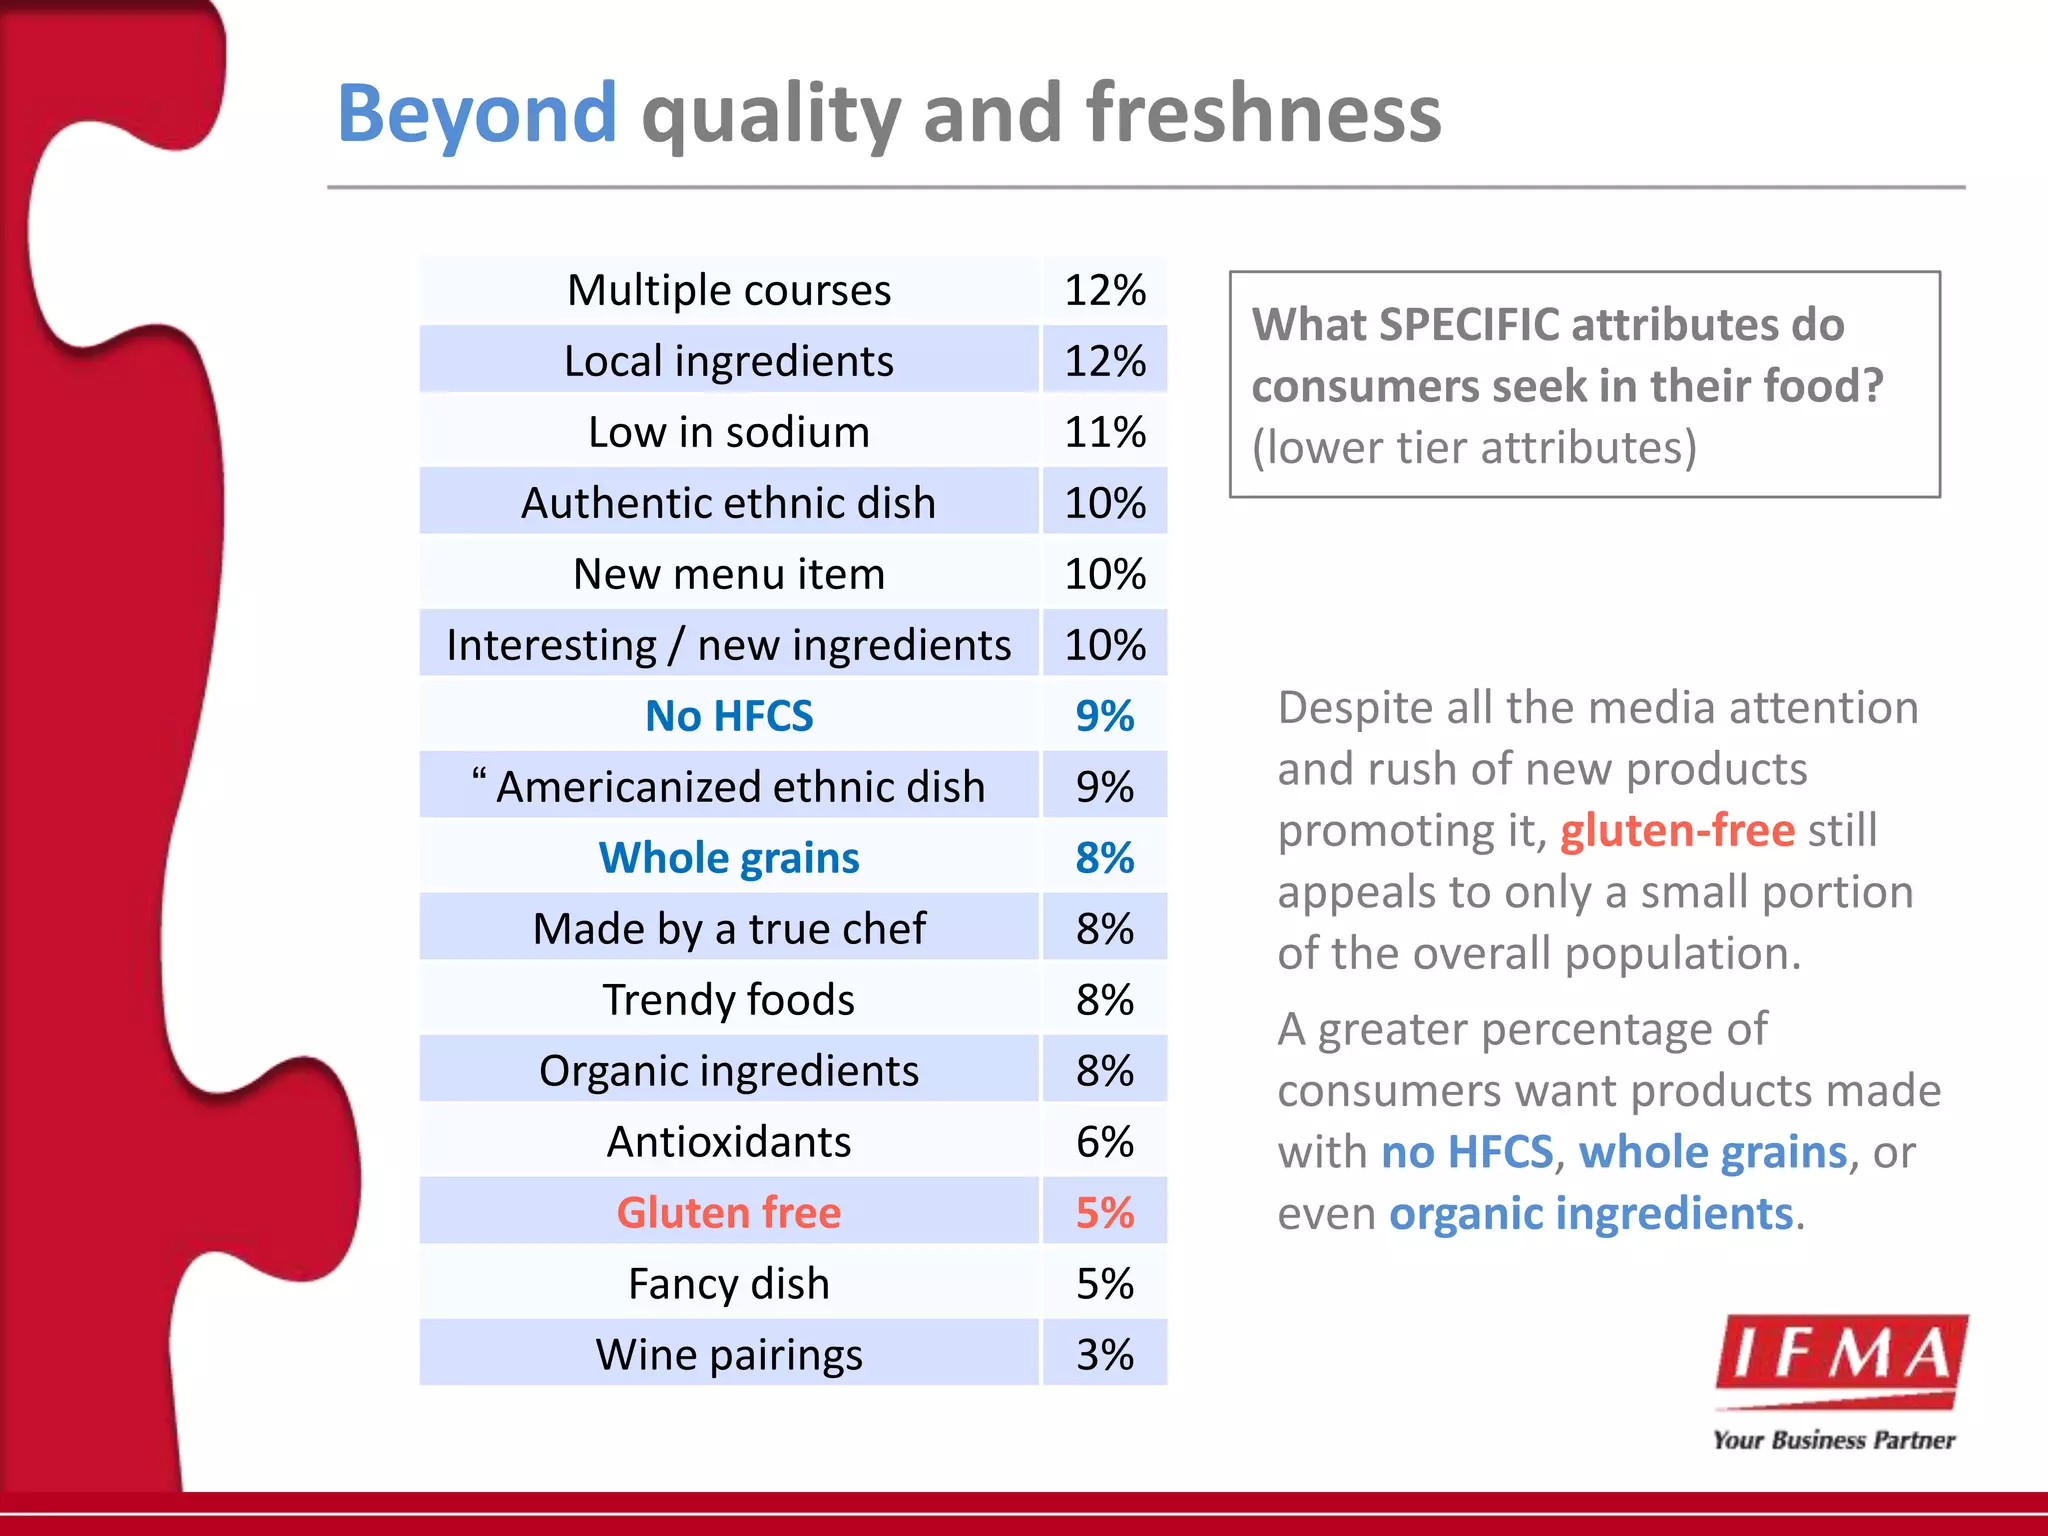
The document summarizes new research on consumer decision factors for away-from-home food choices. The research includes an analysis of consumer behavior, motivations, and solutions through surveys of 12,000 consumers and exploration of 7,000+ menus. It focuses on segments where consumer choice is most relevant, such as quick service restaurants, fast casual dining, and casual dining. The research is guided by an advisory committee and examines how technology, occasions, habits, loyalty, and menus influence consumer decisions.


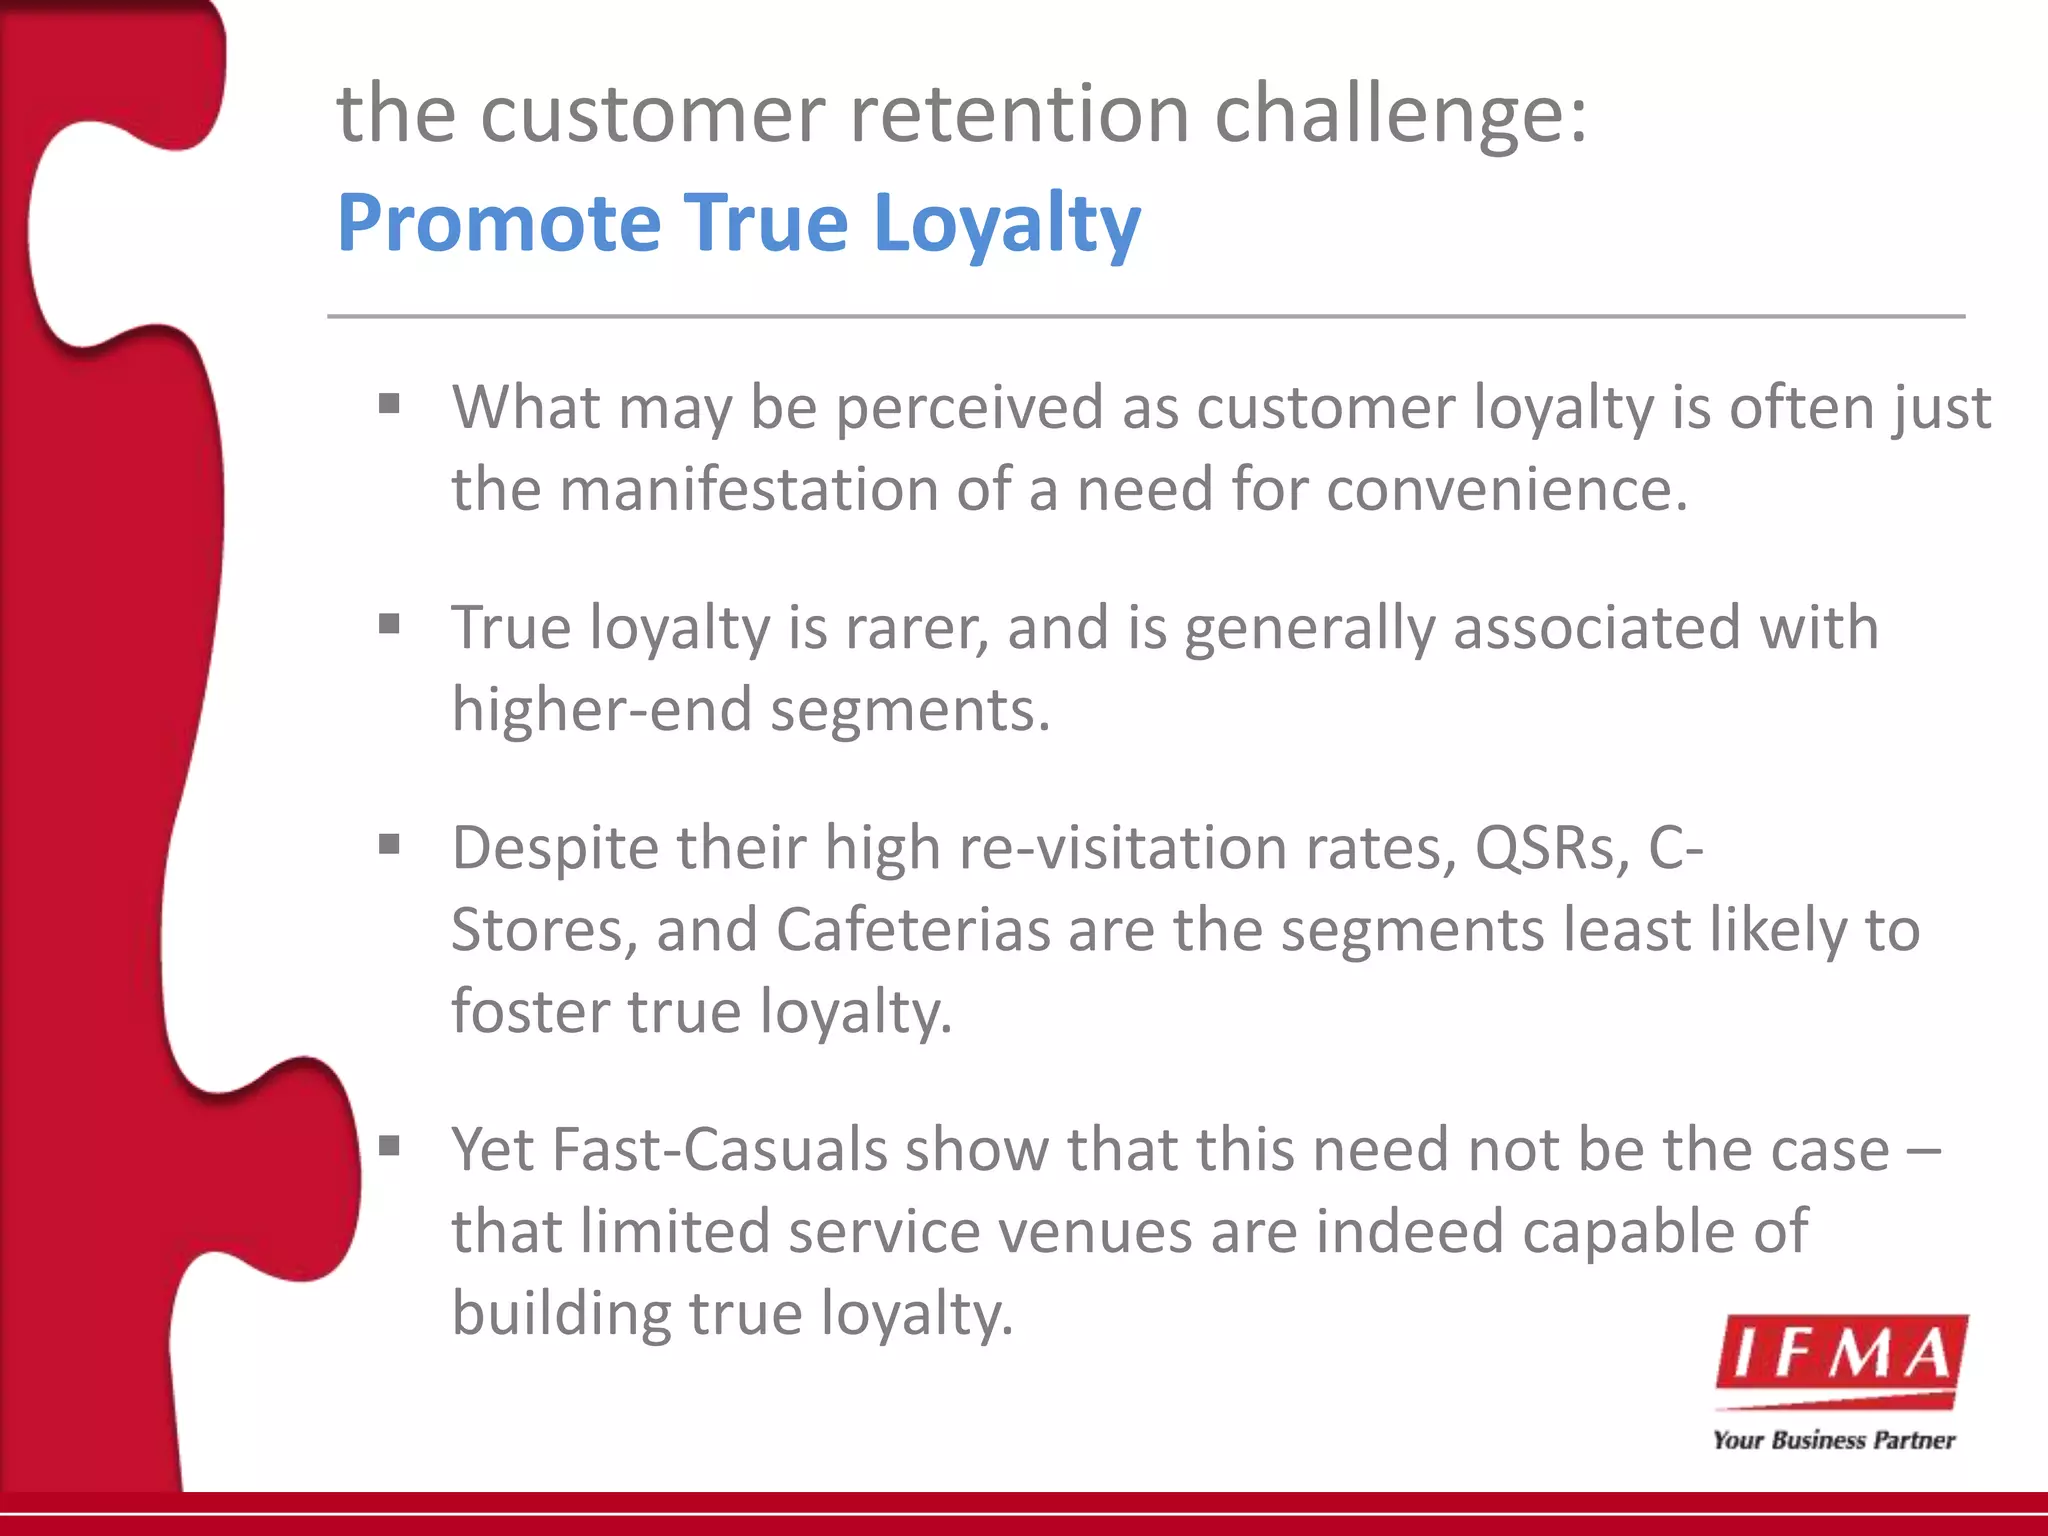
![True loyalty is more common to certain industry segments.
Fast-casuals, for instance, draw far more loyalty traffic than do QSRs.
Fine Dining 80%
Upper Casual 75%
Fast Casual 73%
Casual Dining 64%
Delivery 62%
Coffee Shop 59%
Buffet Restaurant 58%
Midscale 58%
Supermarket deli 53%
[repeat visits]
QSR 48%
% visiting out of
C-Store 40%
Cafeteria 18%
LOYALTY](https://image.slidesharecdn.com/datassentialifmabinderslides-120813111205-phpapp01/75/Datassential-Decision-Making-Factors-Presentation-from-MSLF-15-2048.jpg)
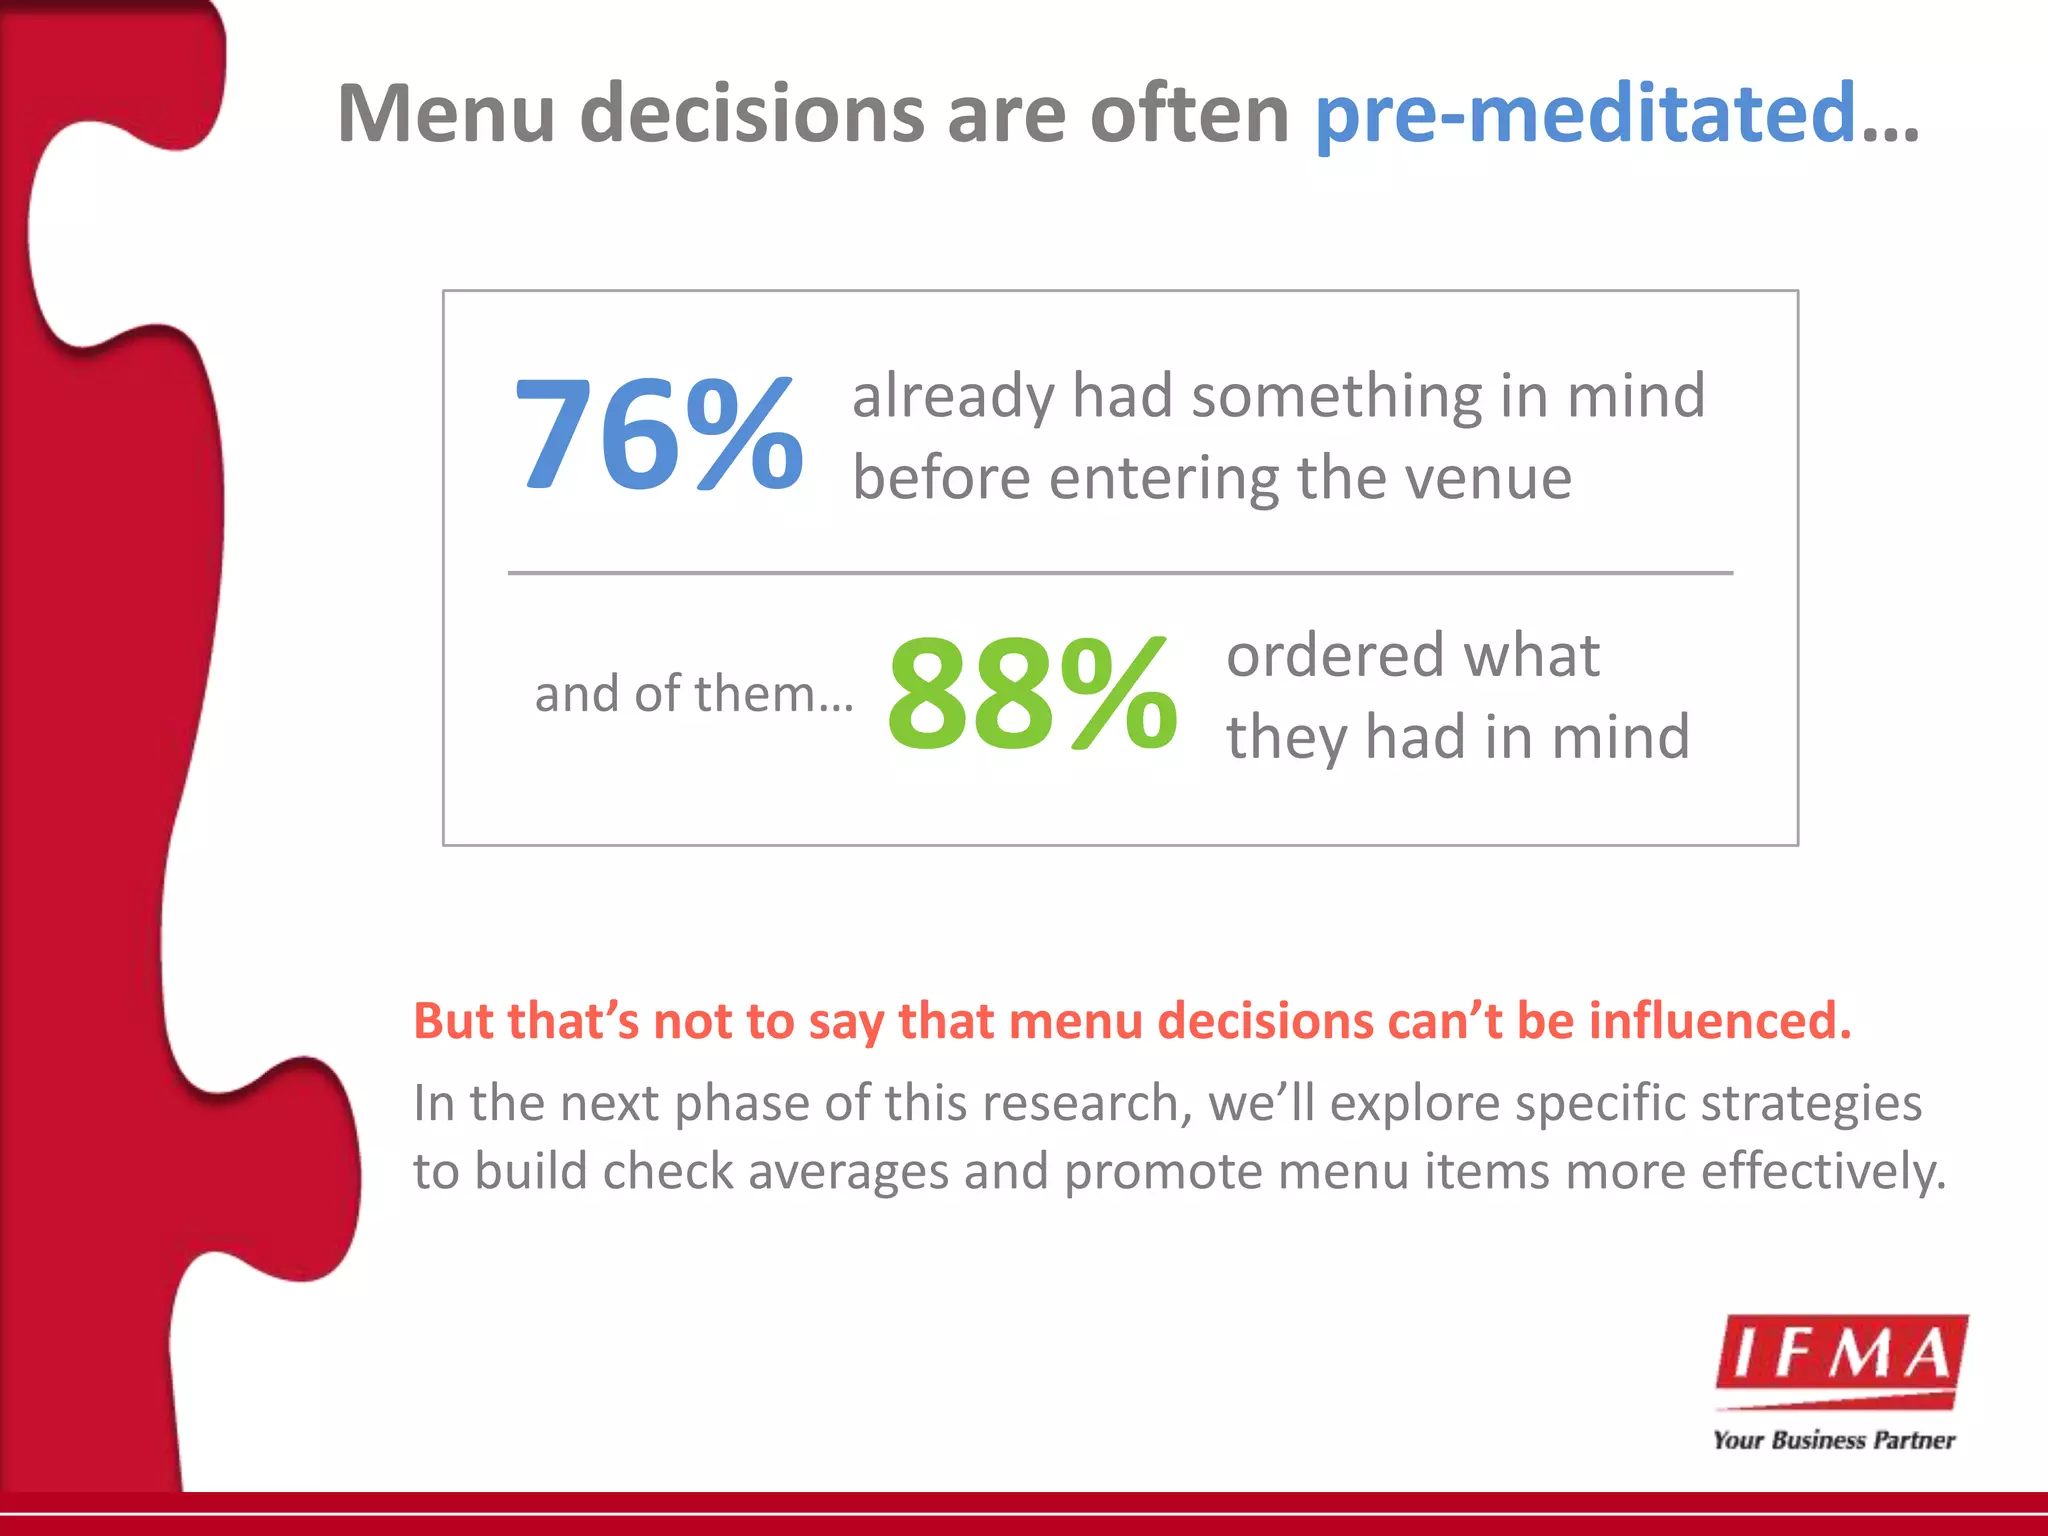
![a little context about the menu
Following several years of
97.9
increase, average menu size 96.4 96.1
began to decrease following
2008’s economic downturn. 93.4 93.3
92.6
During this time, operators 90.3
became more guarded in
their approach to introducing Average Menu Size
new items – often favoring (items per menu)
nostalgic old-time favorites. 82.3 [excludes beverages; “all day menus” only]
2005 2006 2007 2008 2009 2010 2011 2012](https://image.slidesharecdn.com/datassentialifmabinderslides-120813111205-phpapp01/75/Datassential-Decision-Making-Factors-Presentation-from-MSLF-18-2048.jpg)


![Coded Agents – with UiPath SDK + LangGraph [Virtual Hands-on Workshop]](https://cdn.slidesharecdn.com/ss_thumbnails/codedagentsdeck-251215155422-5497c599-thumbnail.jpg?width=640&height=640&fit=bounds)


