
Recommended
Recommended
More Related Content
More from simonithomas47935
More from simonithomas47935 (20)
Recently uploaded
Recently uploaded (20)
DataGulf View CondominiumsNo Gulf View CondominiumsList PriceSale .docx
- 1. DataGulf View CondominiumsNo Gulf View CondominiumsList PriceSale PriceDays to SellList PriceSale PriceDays to Sell61360240242234395807790.1176131126.4154906876.11212 05193.9137962935.122147139.1367332307.1249180167.611537 5360.4186216205.4215545506.935284263.6347554537.4241761 63230943910146225221.4306909889.982185171.520586179928 7268260.8353498491250221214.8366725698.9109196181.5356 351348.5268252248167639606.431281274169506478.71721521 51.852652639.6194169168246962907.249194192.4215267265.7 249413387.8204707687.9185249230.6253742727.283639598.11 05911902.8156468432.993863809.5229931919.8452642491694 51450.5276200189298648648222825792281709655.862485480. 225517493.7129911885.567466455.373547514.2102807803.811 9 MTH410: Portfolio Project Rubric Criteria Meets Expectation Approaches Expectation Below Expectation Limited Evidence Content, Research, and Analysis 53-65 Points 40-52 Points 27-39 Points 14-26 Points Content Demonstrates strong or adequate knowledge of statistics; correctly represents knowledge from
- 2. the readings and sources. Some significant but not major errors or omissions in demonstration of knowledge. Major errors or omissions in demonstration of knowledge. Fails to demonstrate knowledge of the materials. 53-65 Points 40-52 Points 27-39 Points 14-26 Points Requirements The Portfolio includes all of the required components, as specified in the assignment: addresses items 1- 7; report contains all sections and components; Excel file submitted. The Portfolio includes most of the required
- 3. components, as specified in the assignment. The Portfolio includes some of the required components, as specified in the assignment. The Portfolio includes few of the required components, as specified in the assignment. 65-80 Points 49-64 Points 33-48 Points 17-32 Points Synthesis and Evaluation Demonstrates strong or adequate synthesis and evaluation of course concepts in quantitative business analysis. Some significant but not major errors or omissions in synthesis and evaluation.
- 4. Major errors or omissions in synthesis and evaluation. Fails to demonstrate synthesis and evaluation. 65-80 Points 49-64 Points 33-48 Points 17-32 Points Analysis Provides strong or adequate thought, insight and analysis of concepts and applications regarding quantitative analysis for business. Some significant but not major errors or omissions in thought, insight and analysis. Major errors or omissions in thought, insight and analysis. Fails to demonstrate thought, insight
- 5. and analysis. MTH410: Portfolio Project Rubric Mechanics and Writing 17-20 Points 13-16 Points 9-12 Points 5-8 Points Organization Project is clearly organized, well written, and in proper essay format including an introduction, body, and conclusion. Conforms to project requirements. Small number of significant but not major flaws in organization and writing; is in proper essay format. In a minor way does not conform to project requirements. Major problems in organization and writing; does not
- 6. completely follow proper essay format. In a significant way does not conform to project requirements. Project is not well organized or well written and is not in proper essay format. Does not conform to project requirements. 17-20 Points 13-16 Points 9-12 Points 5-8 Points Grammar and Style Strong sentence and paragraph structure; few or no minor errors in grammar and spelling; appropriate writing style; clear and concise with no unsupported comments. Small number of significant but not major errors in grammar and spelling; generally appropriate
- 7. writing. Inconsistent to inadequate sentence and paragraph development; work needed on grammar and spelling; does not meet program expectations. Poor quality; unacceptable in terms of grammar and/or spelling; inappropriate writing style that interferes with clarity. 17-20 Points 13-16 Points 9-12 Points 5-8 Points Demonstrates proper use of APA style Project contains proper APA formatting, according to the CSU-Global Guide to Writing and APA Requirements, with no more than one significant error.
- 8. Few errors in APA formatting, according to the CSU-Global Guide to Writing and APA Requirements, with no more than two to three significant errors. Significant errors in APA formatting, according to the CSU-Global Guide to Writing and APA Requirements, with four to five significant errors. Numerous errors in APA formatting, according to the CSU-Global Guide to Writing and APA Requirements, with more than five significant errors. Total points possible = 350 https://csuglobal.blackboard.com/bbcswebdav/xid-3403141_5 https://csuglobal.blackboard.com/bbcswebdav/xid-3403141_5 https://csuglobal.blackboard.com/bbcswebdav/xid-3403141_5 https://csuglobal.blackboard.com/bbcswebdav/xid-3403141_5
- 9. https://csuglobal.blackboard.com/bbcswebdav/xid-3403141_5 https://csuglobal.blackboard.com/bbcswebdav/xid-3403141_5 https://csuglobal.blackboard.com/bbcswebdav/xid-3403141_5 https://csuglobal.blackboard.com/bbcswebdav/xid-3403141_5 https://csuglobal.blackboard.com/bbcswebdav/xid-3403141_5 https://csuglobal.blackboard.com/bbcswebdav/xid-3403141_5 https://csuglobal.blackboard.com/bbcswebdav/xid-3403141_5 https://csuglobal.blackboard.com/bbcswebdav/xid-3403141_5 DataStudentInvolved in Binge DrinkingAbused Prescription Med. or MarijuanaUsed Illegal DrugsGender1NONONOFemale2YESYESNOFemale3NONOYE SFemale4NONONOFemale5NONONOMale6NONOYESFemale7 NONONOFemale8NOYESNOFemale9NOYESNOMale10NONO YESMale11NONONOMale12NOYESNOFemale13NONONOMal e14YESYESYESFemale15NONONOFemale16NONONOMale17 NONONOFemale18NOYESNOMale19NONONOFemale20NON OYESFemale21NONONOMale22YESNOYESMale23NOYESNO Male24NONONOMale25YESYESYESFemale26NONONOMale2 7YESNONOFemale28NOYESYESMale29NONONOFemale30N ONONOMale31NOYESNOMale32NONONOMale33NONOYES Female34YESNOYESFemale35YESYESNOMale36NOYESNO Male37NONONOMale38NONONOMale39NONONOMale40NO NONOFemale41NONONOMale42NONONOFemale43YESYESY ESMale44NONOYESMale45NONONOFemale46NOYESNOFem ale47YESNONOMale48NONONOFemale49NONOYESFemale5 0YESYESNOFemale51NONONOMale52YESNONOFemale53Y ESNONOMale54YESYESNOMale55NONONOMale56NOYESY ESFemale57NOYESNOFemale58NONONOFemale59NOYESNO Female60NONONOMale61NOYESNOMale62NONOYESMale63 NONONOFemale64NONONOMale65NONONOFemale66NONO NOFemale67NONONOMale68NOYESYESFemale69YESNONO Female70NONONOFemale71NONONOMale72NOYESNOFemal e73YESYESYESFemale74NONONOFemale75NOYESYESFema le76YESNOYESMale77NONOYESFemale78YESNONOMale79 YESYESYESMale80YESYESNOMale81NONOYESFemale82Y
- 10. ESNOYESMale83NONONOFemale84NONONOMale85YESNO NOMale86NONONOMale87NONONOFemale88YESYESYESFe male89NONONOFemale90NONONOMale HEAVENLY CHOCOLATES WEB SALES ANALYSIS (Sample) 8 MTH410 Guide to Writing with Statistics Introduction The purpose of this paper is to provide some general guidance in the writing of papers using statistics and associated tests. The paper provides some general tips for writing and the use of statistics. An example prompt is included, followed by a sample paper. General Tips for Writing a Math Paper: · Organization: · Turn your prompt into headings for paper sections. This will
- 11. help you to make sure you include all of the required information and analysis. It also helps the reader identify the material. · Your paper needs: · A separate title page using APA style requirements (running header, page numbers, course, instructor, your name, date, etc.). · An introduction (often a summary or abstract of the problem). · A body of the paper that answers the questions posed in the problem and includes calculations and graphs associated with this problem. This is where you can turn your prompt into headings. All references need to be properly cited. · A conclusion paragraph that addresses your findings and what you have determined from the data and your analysis. · A separate sheet for references. · There are templates that use APA style that you can insert your material into. If you really struggle with formatting, this may be an option for your first paper or two. If you use a template, remember to double-check it to remove any extra instructions or pages or other elements that weren’t used. · In general, numbers less than 10 are to be written in word form. However, if you have numbers in this range that carry decimals, write them in numeral form. · Never use or interpret a statistic or test that you don’t fully understand. · Target your audience and present as much information as necessary to allow the reader to make an independent interpretation. · Make use of graphs and tables to display information in an easily understood manner. Format them the same throughout, and make sure you don’t manipulate axes. · If you are referring to a statistic that is less commonly used, explain how you calculated it. (It is not necessary to explain mean, but it may be necessary to explain how you set up an ANOVA test.) · Be clear about your sample and its corresponding population. · Be direct in writing descriptive statistics (The mean in Group
- 12. A is 22.9 units.). · Translate the meaning of the statistic for the reader. Write plainly and then back it up with statistical evidence. For example: Men and women scored equally well on this study (t = 0.25, p < 0.01). · For additional resources see the CSU-Global Guide to Writing and APA Requirements or visit https://owl.english.purdue.edu/owl/owlprint/672/ Running head: GUIDE TO WRITING WITH STATISTICS 1 GUIDE TO WRITING WITH STATISTICS 2 Prompt for Sample Paper: Critical Thinking: Heavenly Chocolates Website transactions are an important segment of sales and distribution today. Heavenly Chocolates manufactures and sells quality chocolates at its plant and retail store in Bozeman, MT. Three years ago, the company developed a website and began sales on the internet. Website sales have exceeded expectations and management is now considering strategies to continue to increase its sales. To learn more about its sales, Heavenly Chocolates selected a sample of 50 random transactions from its previous month’s sales. The transaction data shows the day of the week the purchase was made, the type of browser used in the transaction, the time spent on the website, the number of website pages viewed, and the amount spent by the customer. The data is shown in a file named Chocolate. Heavenly Chocolates would like to determine if time spent on the website or the number of pages viewed influence the total purchase. They would also like to examine any effect that day of the week and browser type have on sales. Managerial Report Prepare a report (see below) using the numerical methods of descriptive statistics presented in this module to learn how the variables contribute to the sales of chocolate. Be sure to include the following four (4) items in your report.
- 13. 1. Descriptive statistics (mean, median, range, and standard deviation) for each of the three variables along with an explanation of what the descriptive statistics tell us about the sales. 2. A breakdown using descriptive statistics examining the effect of days of the week on sales. Evaluate the results. 3. A breakdown using descriptive statistics examining the effect of browser type on sales. Evaluate the results. 4. Descriptive statistics (correlation coefficient) showing the relationship between sales (in dollars), and each of the other two variables. Evaluate the relationships between sales (in dollars) and each of the other variables (time spent and pages visited). Use tables, charts, graphs, or visual dashboards to support your conclusions. Make recommendations for continuing to develop sales to the management. Write a report that adheres to the Written Assignment Requirements under the heading “Expectations for CSU-Global Written Assignments” found in the CSU-Global Guide to Writing and APA Requirements. As with all written assignments at CSU-Global, you should have in-text citations and a reference page. Your report must contain the following: · A title page · An introduction · A body of the paper that answers the questions posed in the problem and calculations and graphs associated with this problem. · A conclusion paragraph that addresses your findings and what you have determined from the data and your analysis. Submit your Excel file in addition to your report.
- 14. Note: Prompt adapted from the “Heavenly Chocolate Website Transactions Case Problem 4,” D. Anderson, D. Sweeney, T. Williams, J. Camm, & J. Cochran, 2015, Essentials of statistics for business and economics. (7th ed.), p. 167,168. GUIDE TO WRITING WITH STATISTICS 3 GUIDE TO WRITING WITH STATISTICS 4 The following pages contain the sample paper corresponding to the prompt written above. Read through it for ideas on how to write your own papers. Heavenly Chocolates Web Sales Analysis Student Name MTH410 – Quantitative Business Analysis Instructor Name HEAVENLY CHOCOLATES WEB SALES ANALYSIS (Sample) 1 HEAVENLY CHOCOLATES WEB SALES ANALYSIS (Sample) 5 Date Heavenly Chocolates Web Sales Analysis Website transactions are an important segment of sales and distribution today. Any business developing a market for online sales would be wise to analyze data from both the general marketplace and its own specific customer segment. Analysis of this data can provide insight into further development of sales.
- 15. Heavenly Chocolates data-mined their transactions for the previous month to gather a random sample of 50 customer transactions. The sample recorded the day of the week the purchase was made, the type of browser used in the transaction, the time spent on their website, the number of website pages viewed, and the amount spent by the customer. The purpose of this analysis is to determine if the time spent on the website or the number of pages viewed influences the total purchase. The impact of day of the week and browser type on sales will also be studied. Overview of Online Sales The 50 customers sampled spent a total of $3,406.41 in the previous month. This is an average of $68.10 per customer. The purchases ranged from a $17.80 to $158.50. The average customer spent 12.8 minutes on the website. Time spent on the website ranged from 4.3 minutes to 32.9 minutes. The typical customer viewed almost five pages, with two as the minimum and ten as the maximum. The data set is summarized below in Table 1. Table 1 Summary of Online Sales Sample Time (min) Pages Viewed Amount Spent ($) mean 12.8 4.8 68.1 median 11.4 4.5 62.2 std dev 6.1 2
- 16. 32.3 min 4.3 2 17.8 Table 1 Summary of Online Sales Sample (Continued) Time (min) Pages Viewed Amount Spent ($) max 32.9 10 158.5 range 28.6 8 140.7 SUM ($) 3406.41 Note: Data compiled from the “Heavenly Chocolate Website Transactions Case Problem 4,” D. Anderson, D. Sweeney, T. Williams, J. Camm, & J. Cochran, 2015, Essentials of statistics for business and economics. (7th ed.), p. 167,168. Impact of Day of the Week on Sales The daily sales breakdown reveals some interesting patterns. Sunday is the lowest sales day, from the perspective of both total sales ($218.15) and average sales ($43.60). Monday and Friday were the best days in terms of overall sales performance. Monday had the highest mean (average) sales at $90.40, while Friday had the highest total sales at $945.43 for
- 17. roughly 28% of the sample total. See Table 2 for a complete breakdown of the impact of the day of the week on amount spent, time spent on the website, and number of pages viewed. Table 2 Breakdown of Sales by Day of theWeek Sun Mon Tues Wed Thurs Fri Sat Total Total Sales mean 43.6 90.4 59.3 57 58.8 85.9 54.1 68.1 median 37.2
- 19. 131.8 35.4 62.2 73.8 103.2 50.7 140.7 count 5 9 7 6 5 11 7 50 HEAVENLY CHOCOLATES WEB SALES ANALYSIS (Sample) 2 HEAVENLY CHOCOLATES WEB SALES ANALYSIS (Sample) 3 Table 2 Breakdown of Sales by Day of theWeek (Continued) Sun Mon Tues Wed Thurs Fri Sat Total
- 23. 2 4 2 2 2 3 4 2 max 7 10 7 6 7 10 7 10 range 5 6 5 4 5 7 3 8 Note: Data compiled from the “Heavenly Chocolate Website Transactions Case Problem 4,” D. Anderson, D. Sweeney, T. Williams, J. Camm, & J. Cochran, 2015, Essentials of statistics for business and economics. (7th ed.), p. 167,168. By almost every measure, Monday is the best day for sales. Friday follows closely (see Table 2). It makes logical sense to recommend that the marketing department develop advertising targeted for Monday and Friday. Weekends are subpar and midweek statistics are nearly equivalent. Targeting sales or
- 24. special packages for midweek may produce some increased traffic. If these recommendations are implemented, follow-up analysis is recommended to see if the desired results are being produced. Impact of Browser on Sales There were also sales differences revealed by breaking the data down by browser type. Customers using Internet Explorer to complete their transactions accounted for the highest total sales at $1,656.81; however, this value was achieved on volume (see Table 3). Internet Explorer had the lowest average sale at $61.36 while Firefox customers averaged $76.80 per transaction. Table 3 Breakdown of Sales by Browser Firefox Internet Explorer Other Total mean 76.8 61.36 74.5 68.1 median 68 55.6 67.4 62.2 std dev 38.9 29.2 24.6 32.3 min 27.9 17.8
- 25. 52.2 17.8 max 158.5 126.4 120.3 158.5 range 130.6 108.6 68.1 140.7 count 16 27 7 50 SUM ($) 1,228.21 1,656.81 521.39 3,406.41 Note: Data compiled from the “Heavenly Chocolate Website Transactions Case Problem 4,” D. Anderson, D. Sweeney, T. Williams, J. Camm, & J. Cochran, 2015, Essentials of statistics for business and economics. (7th ed.), p. 167,168. The opportunity here is to target premium packages for advertising specific to Firefox. Value packages could be created for advertising specific to Internet Explorer. This promotion should be combined with the recommendations given regarding days of the week and subjected to a follow-up analysis to check for results. Relationship between Amount Spent and Website Use HEAVENLY CHOCOLATES WEB SALES ANALYSIS (Sample) 4
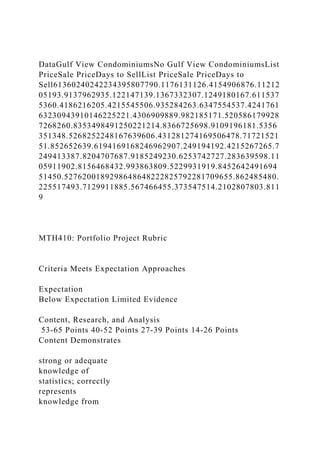
- 26. HEAVENLY CHOCOLATES WEB SALES ANALYSIS (Sample) 5 The other feature of this analysis is to evaluate the relationship between amount spent by customers and how much time they spent on the website with the additional variable of number of pages viewed also taken into account. For this, a correlation analysis was performed. The correlation coefficient between time spent on the website and amount spent in dollars was moderately positive (r = 0.58). A similar moderately positive correlation coefficient (r = 0.60) was found between the variables of time spent on the website and number of pages visited. The strongest correlation was found between number of pages viewed on the website and amount spent. This correlation coefficient (r = 0.72) approaches a strong positive correlation (see Figure 1). This suggests that there may be some merit in trying to guide customers to view more pages. Figure 1. Relationship Between Pages Viewed and Dollars Spent. Data compiled from the “Heavenly Chocolate Website Transactions Case Problem 4,” D. Anderson, D. Sweeney, T. Williams, J. Camm, & J. Cochran, 2015, Essentials of statistics for business and economics. (7th ed.), p. 167,168. HEAVENLY CHOCOLATES WEB SALES ANALYSIS (Sample) 6 A common tactic is to guide customers to pages that have also been viewed by other customers viewing the product on the current page. Another suggestion is to pair pages and suggest that customers who purchased the product on the current page also frequently purchased a product on the linked page. As with previous suggestions, follow-up analysis should be performed to check results. On a cautionary note, this can be overdone. The statement from
- 27. Essentials of Statistics for Business and Economics that correlation is a measure of linear association and not causation should also be duly noted (Anderson, et al., 2015). Conclusion The analysis of this sample of 50 random customer transactions revealed several items to be used in the development of continued growth at Heavenly Chocolate. There is positive correlation between all three variables, but the strongest correlation is between number of pages viewed and amount of sales. There is adequate reason to pursue linking pages and making suggestions for customer purchasing. Monday and Friday are the best sales days. Firefox customers spend the most, but Internet Explorer customers provide the highest volume. Packaging and marketing strategies can be developed using this information. This analysis validates the use of statistical tools to provide insight into new strategies. Follow- up analysis is also mandated to find out if the strategies are producing results. HEAVENLY CHOCOLATES WEB SALES ANALYSIS (Sample) 7 References
- 28. Anderson, D.R., Sweeney, D.J., Williams, T.A., Camm, J.D., & Cochran, J.J. (2015). Essentials of statistics for business and economics. (7th ed.). Stamford, CT: Cengage Learning. Amount Spent ($) 4 6 4 2 4 6 2 6 3 7 6 5 7 10 3 4 7 7 4 5 5 6 3 2 3 2 5 4 10 9 2 8 4 3 5 5 4 4 2 5 4 7 4 7 6 4 2 5 6 3 54.52 94.9 26.68 44.730000000000011 66.27 67.8 36.04 55.960000000000008 70.940000000000026 68.73 54.040000000000006 48.05 64.16 158.51 84.11999999999999 59.2 91.61999999999999 126.4 68.45 32.690000000000012 78.58 74.430000000000007 32.730000000000011 48.660000000000011 54.660000000000011 40.54 34.690000000000012 27.910000000000004 155.30000000000001 120.25 41.2 134.4 37.17 52.09 71.81 59.99 84.169999999999987 55.58 39.06 36.480000000000004 67.440000000000026 60.14 70.38 110.64999999999999 104.23 68.169999999999987 17.840000000000003 103.14999999999999 52.150000000000006 98.75 Pages Viewed Dollars Spent HEAVENLY CHOCOLATES WEB SALES ANALYSIS (Sample) 8
- 29. MTH410 Guide to Writing with Statistics Introduction The purpose of this paper is to provide some general guidance in the writing of papers using statistics and associated tests. The paper provides some general tips for writing and the use of statistics. An example prompt is included, followed by a sample paper. General Tips for Writing a Math Paper: · Organization: · Turn your prompt into headings for paper sections. This will help you to make sure you include all of the required information and analysis. It also helps the reader identify the material. · Your paper needs: · A separate title page using APA style requirements (running header, page numbers, course, instructor, your name, date, etc.). · An introduction (often a summary or abstract of the problem).
- 30. · A body of the paper that answers the questions posed in the problem and includes calculations and graphs associated with this problem. This is where you can turn your prompt into headings. All references need to be properly cited. · A conclusion paragraph that addresses your findings and what you have determined from the data and your analysis. · A separate sheet for references. · There are templates that use APA style that you can insert your material into. If you really struggle with formatting, this may be an option for your first paper or two. If you use a template, remember to double-check it to remove any extra instructions or pages or other elements that weren’t used. · In general, numbers less than 10 are to be written in word form. However, if you have numbers in this range that carry decimals, write them in numeral form. · Never use or interpret a statistic or test that you don’t fully understand. · Target your audience and present as much information as necessary to allow the reader to make an independent interpretation. · Make use of graphs and tables to display information in an easily understood manner. Format them the same throughout, and make sure you don’t manipulate axes. · If you are referring to a statistic that is less commonly used, explain how you calculated it. (It is not necessary to explain mean, but it may be necessary to explain how you set up an ANOVA test.) · Be clear about your sample and its corresponding population. · Be direct in writing descriptive statistics (The mean in Group A is 22.9 units.). · Translate the meaning of the statistic for the reader. Write plainly and then back it up with statistical evidence. For example: Men and women scored equally well on this study (t = 0.25, p < 0.01). · For additional resources see the CSU-Global Guide to Writing and APA Requirements or visit
- 31. https://owl.english.purdue.edu/owl/owlprint/672/ Running head: GUIDE TO WRITING WITH STATISTICS 1 GUIDE TO WRITING WITH STATISTICS 2 Prompt for Sample Paper: Critical Thinking: Heavenly Chocolates Website transactions are an important segment of sales and distribution today. Heavenly Chocolates manufactures and sells quality chocolates at its plant and retail store in Bozeman, MT. Three years ago, the company developed a website and began sales on the internet. Website sales have exceeded expectations and management is now considering strategies to continue to increase its sales. To learn more about its sales, Heavenly Chocolates selected a sample of 50 random transactions from its previous month’s sales. The transaction data shows the day of the week the purchase was made, the type of browser used in the transaction, the time spent on the website, the number of website pages viewed, and the amount spent by the customer. The data is shown in a file named Chocolate. Heavenly Chocolates would like to determine if time spent on the website or the number of pages viewed influence the total purchase. They would also like to examine any effect that day of the week and browser type have on sales. Managerial Report Prepare a report (see below) using the numerical methods of descriptive statistics presented in this module to learn how the variables contribute to the sales of chocolate. Be sure to include the following four (4) items in your report. 1. Descriptive statistics (mean, median, range, and standard deviation) for each of the three variables along with an explanation of what the descriptive statistics tell us about the sales. 2. A breakdown using descriptive statistics examining the effect of days of the week on sales. Evaluate the results.
- 32. 3. A breakdown using descriptive statistics examining the effect of browser type on sales. Evaluate the results. 4. Descriptive statistics (correlation coefficient) showing the relationship between sales (in dollars), and each of the other two variables. Evaluate the relationships between sales (in dollars) and each of the other variables (time spent and pages visited). Use tables, charts, graphs, or visual dashboards to support your conclusions. Make recommendations for continuing to develop sales to the management. Write a report that adheres to the Written Assignment Requirements under the heading “Expectations for CSU-Global Written Assignments” found in the CSU-Global Guide to Writing and APA Requirements. As with all written assignments at CSU-Global, you should have in-text citations and a reference page. Your report must contain the following: · A title page · An introduction · A body of the paper that answers the questions posed in the problem and calculations and graphs associated with this problem. · A conclusion paragraph that addresses your findings and what you have determined from the data and your analysis. Submit your Excel file in addition to your report. Note: Prompt adapted from the “Heavenly Chocolate Website Transactions Case Problem 4,” D. Anderson, D. Sweeney, T. Williams, J. Camm, & J. Cochran, 2015, Essentials of statistics for business and economics. (7th ed.), p. 167,168. GUIDE TO WRITING WITH STATISTICS 3 GUIDE TO WRITING WITH STATISTICS 4
- 33. The following pages contain the sample paper corresponding to the prompt written above. Read through it for ideas on how to write your own papers. Heavenly Chocolates Web Sales Analysis Student Name MTH410 – Quantitative Business Analysis Instructor Name HEAVENLY CHOCOLATES WEB SALES ANALYSIS (Sample) 1 HEAVENLY CHOCOLATES WEB SALES ANALYSIS (Sample) 5 Date Heavenly Chocolates Web Sales Analysis Website transactions are an important segment of sales and distribution today. Any business developing a market for online sales would be wise to analyze data from both the general marketplace and its own specific customer segment. Analysis of this data can provide insight into further development of sales. Heavenly Chocolates data-mined their transactions for the previous month to gather a random sample of 50 customer transactions. The sample recorded the day of the week the purchase was made, the type of browser used in the transaction, the time spent on their website, the number of website pages viewed, and the amount spent by the customer. The purpose of this analysis is to determine if the time spent on the website or
- 34. the number of pages viewed influences the total purchase. The impact of day of the week and browser type on sales will also be studied. Overview of Online Sales The 50 customers sampled spent a total of $3,406.41 in the previous month. This is an average of $68.10 per customer. The purchases ranged from a $17.80 to $158.50. The average customer spent 12.8 minutes on the website. Time spent on the website ranged from 4.3 minutes to 32.9 minutes. The typical customer viewed almost five pages, with two as the minimum and ten as the maximum. The data set is summarized below in Table 1. Table 1 Summary of Online Sales Sample Time (min) Pages Viewed Amount Spent ($) mean 12.8 4.8 68.1 median 11.4 4.5 62.2 std dev 6.1 2 32.3 min 4.3 2 17.8 Table 1
- 35. Summary of Online Sales Sample (Continued) Time (min) Pages Viewed Amount Spent ($) max 32.9 10 158.5 range 28.6 8 140.7 SUM ($) 3406.41 Note: Data compiled from the “Heavenly Chocolate Website Transactions Case Problem 4,” D. Anderson, D. Sweeney, T. Williams, J. Camm, & J. Cochran, 2015, Essentials of statistics for business and economics. (7th ed.), p. 167,168. Impact of Day of the Week on Sales The daily sales breakdown reveals some interesting patterns. Sunday is the lowest sales day, from the perspective of both total sales ($218.15) and average sales ($43.60). Monday and Friday were the best days in terms of overall sales performance. Monday had the highest mean (average) sales at $90.40, while Friday had the highest total sales at $945.43 for roughly 28% of the sample total. See Table 2 for a complete breakdown of the impact of the day of the week on amount spent, time spent on the website, and number of pages viewed. Table 2 Breakdown of Sales by Day of theWeek
- 38. count 5 9 7 6 5 11 7 50 HEAVENLY CHOCOLATES WEB SALES ANALYSIS (Sample) 2 HEAVENLY CHOCOLATES WEB SALES ANALYSIS (Sample) 3 Table 2 Breakdown of Sales by Day of theWeek (Continued) Sun Mon Tues Wed Thurs Fri Sat Total SUM ($) 218.15 813.38 414.86 341.82 294.03 945.43
- 42. 2 max 7 10 7 6 7 10 7 10 range 5 6 5 4 5 7 3 8 Note: Data compiled from the “Heavenly Chocolate Website Transactions Case Problem 4,” D. Anderson, D. Sweeney, T. Williams, J. Camm, & J. Cochran, 2015, Essentials of statistics for business and economics. (7th ed.), p. 167,168. By almost every measure, Monday is the best day for sales. Friday follows closely (see Table 2). It makes logical sense to recommend that the marketing department develop advertising targeted for Monday and Friday. Weekends are subpar and midweek statistics are nearly equivalent. Targeting sales or special packages for midweek may produce some increased traffic. If these recommendations are implemented, follow-up analysis is recommended to see if the desired results are being produced. Impact of Browser on Sales There were also sales differences revealed by breaking the data down by browser type. Customers using Internet Explorer
- 43. to complete their transactions accounted for the highest total sales at $1,656.81; however, this value was achieved on volume (see Table 3). Internet Explorer had the lowest average sale at $61.36 while Firefox customers averaged $76.80 per transaction. Table 3 Breakdown of Sales by Browser Firefox Internet Explorer Other Total mean 76.8 61.36 74.5 68.1 median 68 55.6 67.4 62.2 std dev 38.9 29.2 24.6 32.3 min 27.9 17.8 52.2 17.8 max 158.5 126.4 120.3 158.5
- 44. range 130.6 108.6 68.1 140.7 count 16 27 7 50 SUM ($) 1,228.21 1,656.81 521.39 3,406.41 Note: Data compiled from the “Heavenly Chocolate Website Transactions Case Problem 4,” D. Anderson, D. Sweeney, T. Williams, J. Camm, & J. Cochran, 2015, Essentials of statistics for business and economics. (7th ed.), p. 167,168. The opportunity here is to target premium packages for advertising specific to Firefox. Value packages could be created for advertising specific to Internet Explorer. This promotion should be combined with the recommendations given regarding days of the week and subjected to a follow-up analysis to check for results. Relationship between Amount Spent and Website Use HEAVENLY CHOCOLATES WEB SALES ANALYSIS (Sample) 4 HEAVENLY CHOCOLATES WEB SALES ANALYSIS (Sample) 5 The other feature of this analysis is to evaluate the relationship between amount spent by customers and how much time they spent on the website with the additional variable of
- 45. number of pages viewed also taken into account. For this, a correlation analysis was performed. The correlation coefficient between time spent on the website and amount spent in dollars was moderately positive (r = 0.58). A similar moderately positive correlation coefficient (r = 0.60) was found between the variables of time spent on the website and number of pages visited. The strongest correlation was found between number of pages viewed on the website and amount spent. This correlation coefficient (r = 0.72) approaches a strong positive correlation (see Figure 1). This suggests that there may be some merit in trying to guide customers to view more pages. Figure 1. Relationship Between Pages Viewed and Dollars Spent. Data compiled from the “Heavenly Chocolate Website Transactions Case Problem 4,” D. Anderson, D. Sweeney, T. Williams, J. Camm, & J. Cochran, 2015, Essentials of statistics for business and economics. (7th ed.), p. 167,168. HEAVENLY CHOCOLATES WEB SALES ANALYSIS (Sample) 6 A common tactic is to guide customers to pages that have also been viewed by other customers viewing the product on the current page. Another suggestion is to pair pages and suggest that customers who purchased the product on the current page also frequently purchased a product on the linked page. As with previous suggestions, follow-up analysis should be performed to check results. On a cautionary note, this can be overdone. The statement from Essentials of Statistics for Business and Economics that correlation is a measure of linear association and not causation should also be duly noted (Anderson, et al., 2015). Conclusion The analysis of this sample of 50 random customer transactions revealed several items to be used in the development of continued growth at Heavenly Chocolate. There is positive
- 46. correlation between all three variables, but the strongest correlation is between number of pages viewed and amount of sales. There is adequate reason to pursue linking pages and making suggestions for customer purchasing. Monday and Friday are the best sales days. Firefox customers spend the most, but Internet Explorer customers provide the highest volume. Packaging and marketing strategies can be developed using this information. This analysis validates the use of statistical tools to provide insight into new strategies. Follow- up analysis is also mandated to find out if the strategies are producing results. HEAVENLY CHOCOLATES WEB SALES ANALYSIS (Sample) 7 References Anderson, D.R., Sweeney, D.J., Williams, T.A., Camm, J.D., & Cochran, J.J. (2015). Essentials of statistics for business and economics. (7th ed.). Stamford, CT: Cengage Learning.
- 47. Amount Spent ($) 4 6 4 2 4 6 2 6 3 7 6 5 7 10 3 4 7 7 4 5 5 6 3 2 3 2 5 4 10 9 2 8 4 3 5 5 4 4 2 5 4 7 4 7 6 4 2 5 6 3 54.52 94.9 26.68 44.730000000000011 66.27 67.8 36.04 55.960000000000008 70.940000000000026 68.73 54.040000000000006 48.05 64.16 158.51 84.11999999999999 59.2 91.61999999999999 126.4 68.45 32.690000000000012 78.58 74.430000000000007 32.730000000000011 48.660000000000011 54.660000000000011 40.54 34.690000000000012 27.910000000000004 155.30000000000001 120.25 41.2 134.4 37.17 52.09 71.81 59.99 84.169999999999987 55.58 39.06 36.480000000000004 67.440000000000026 60.14 70.38 110.64999999999999 104.23 68.169999999999987 17.840000000000003 103.14999999999999 52.150000000000006 98.75 Pages Viewed Dollars Spent