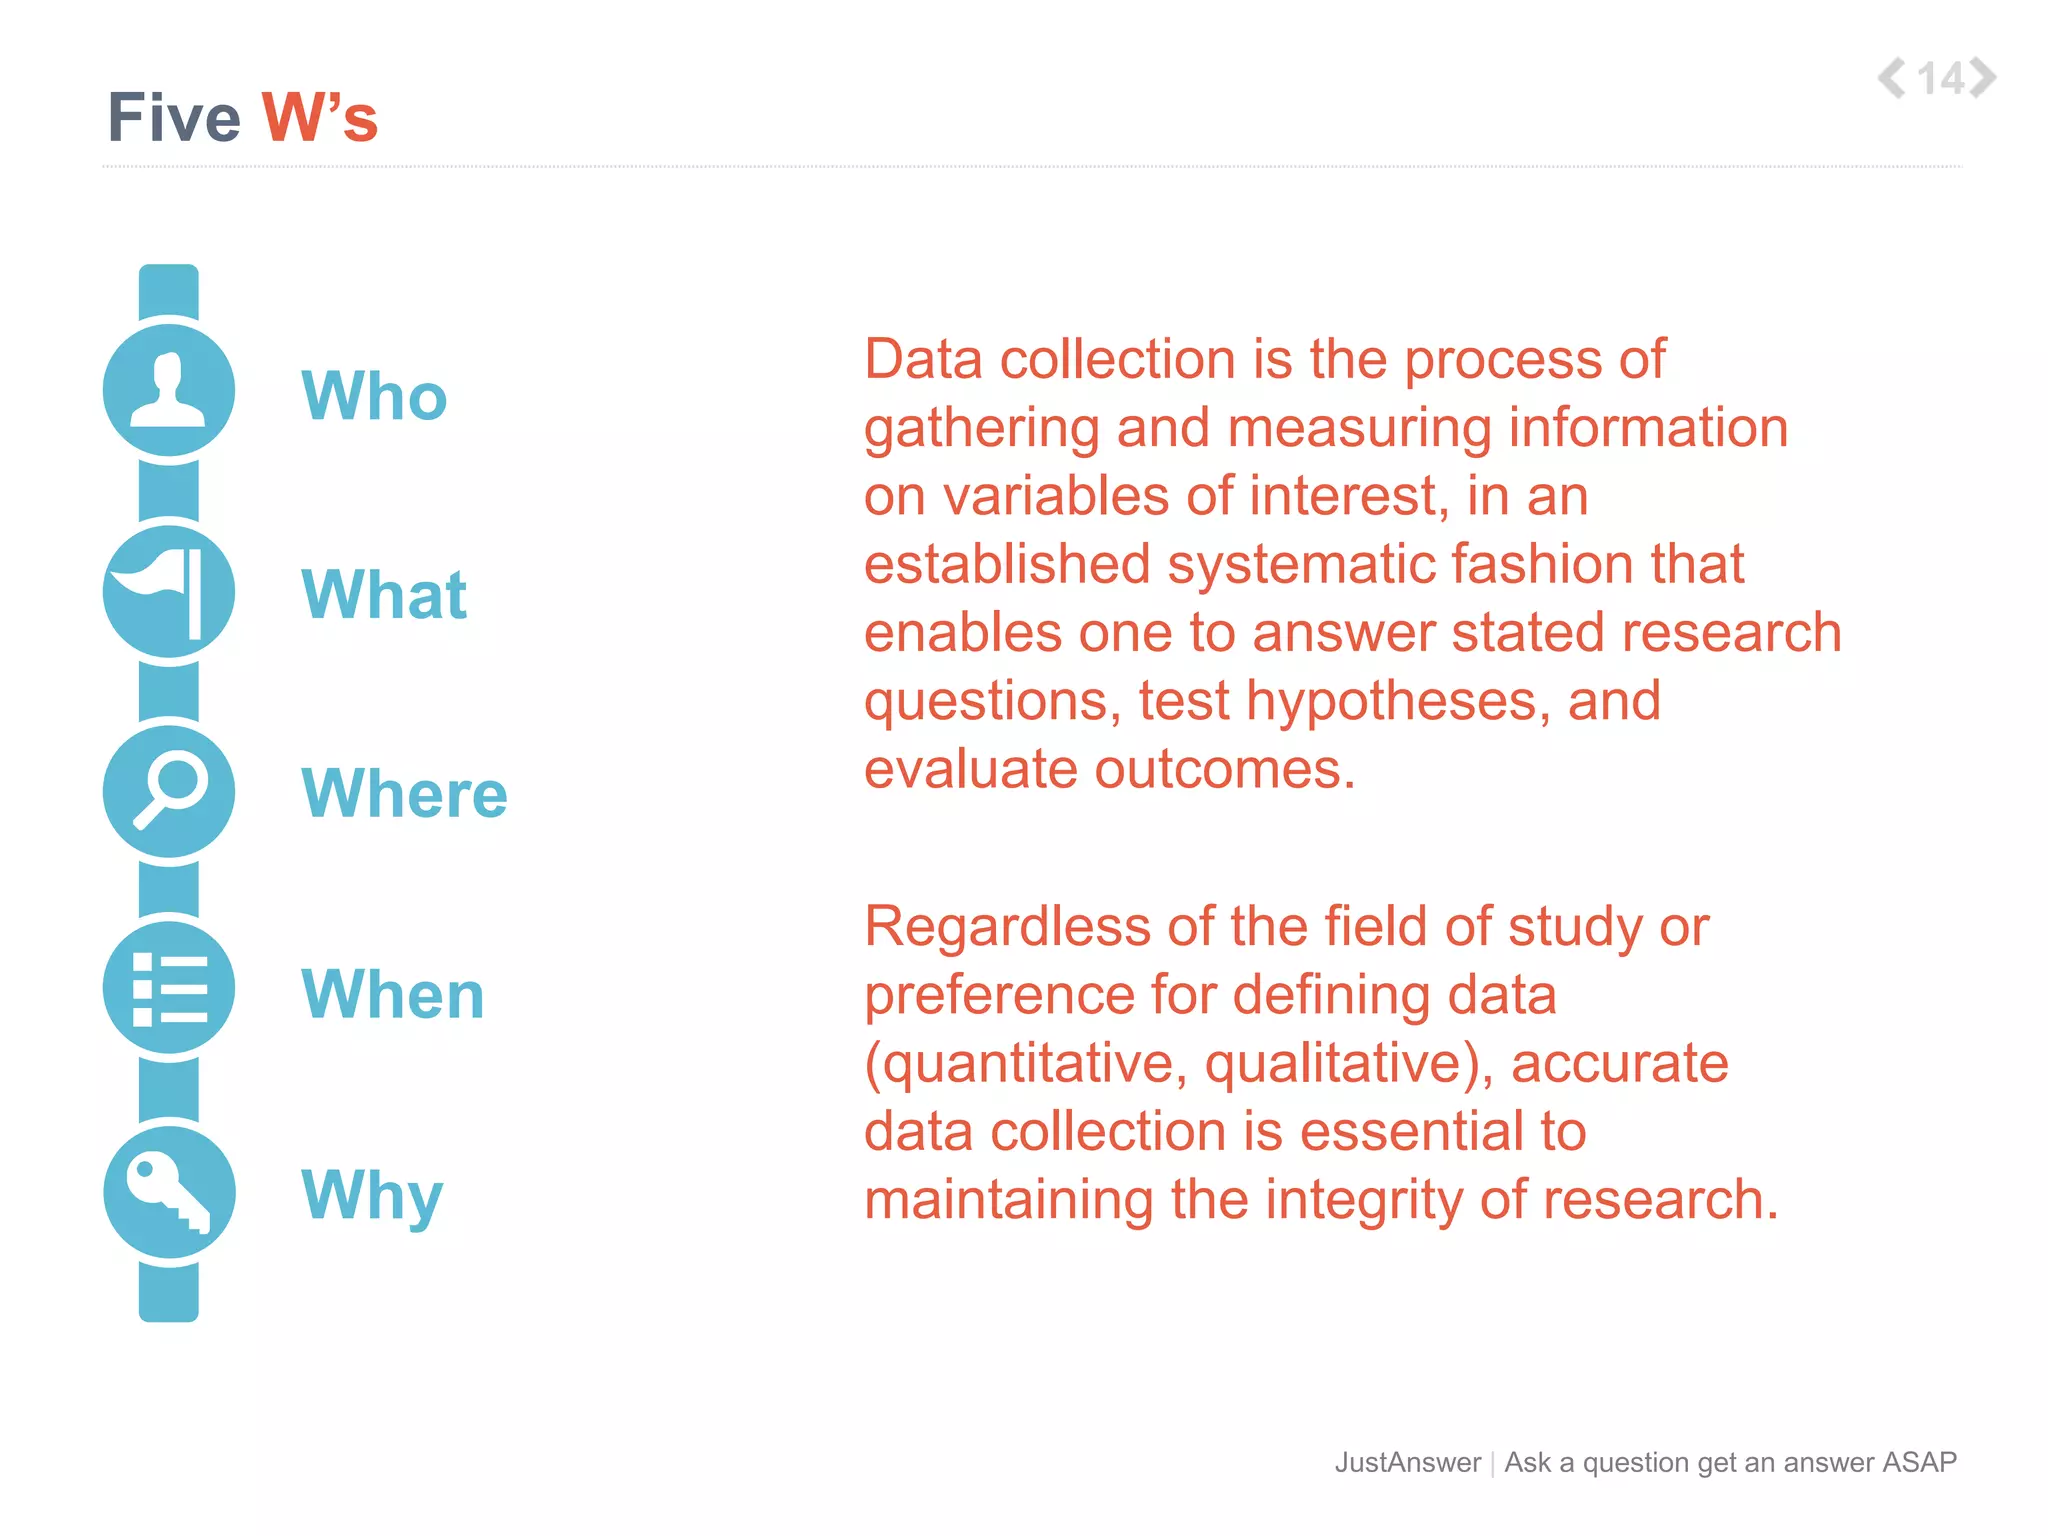
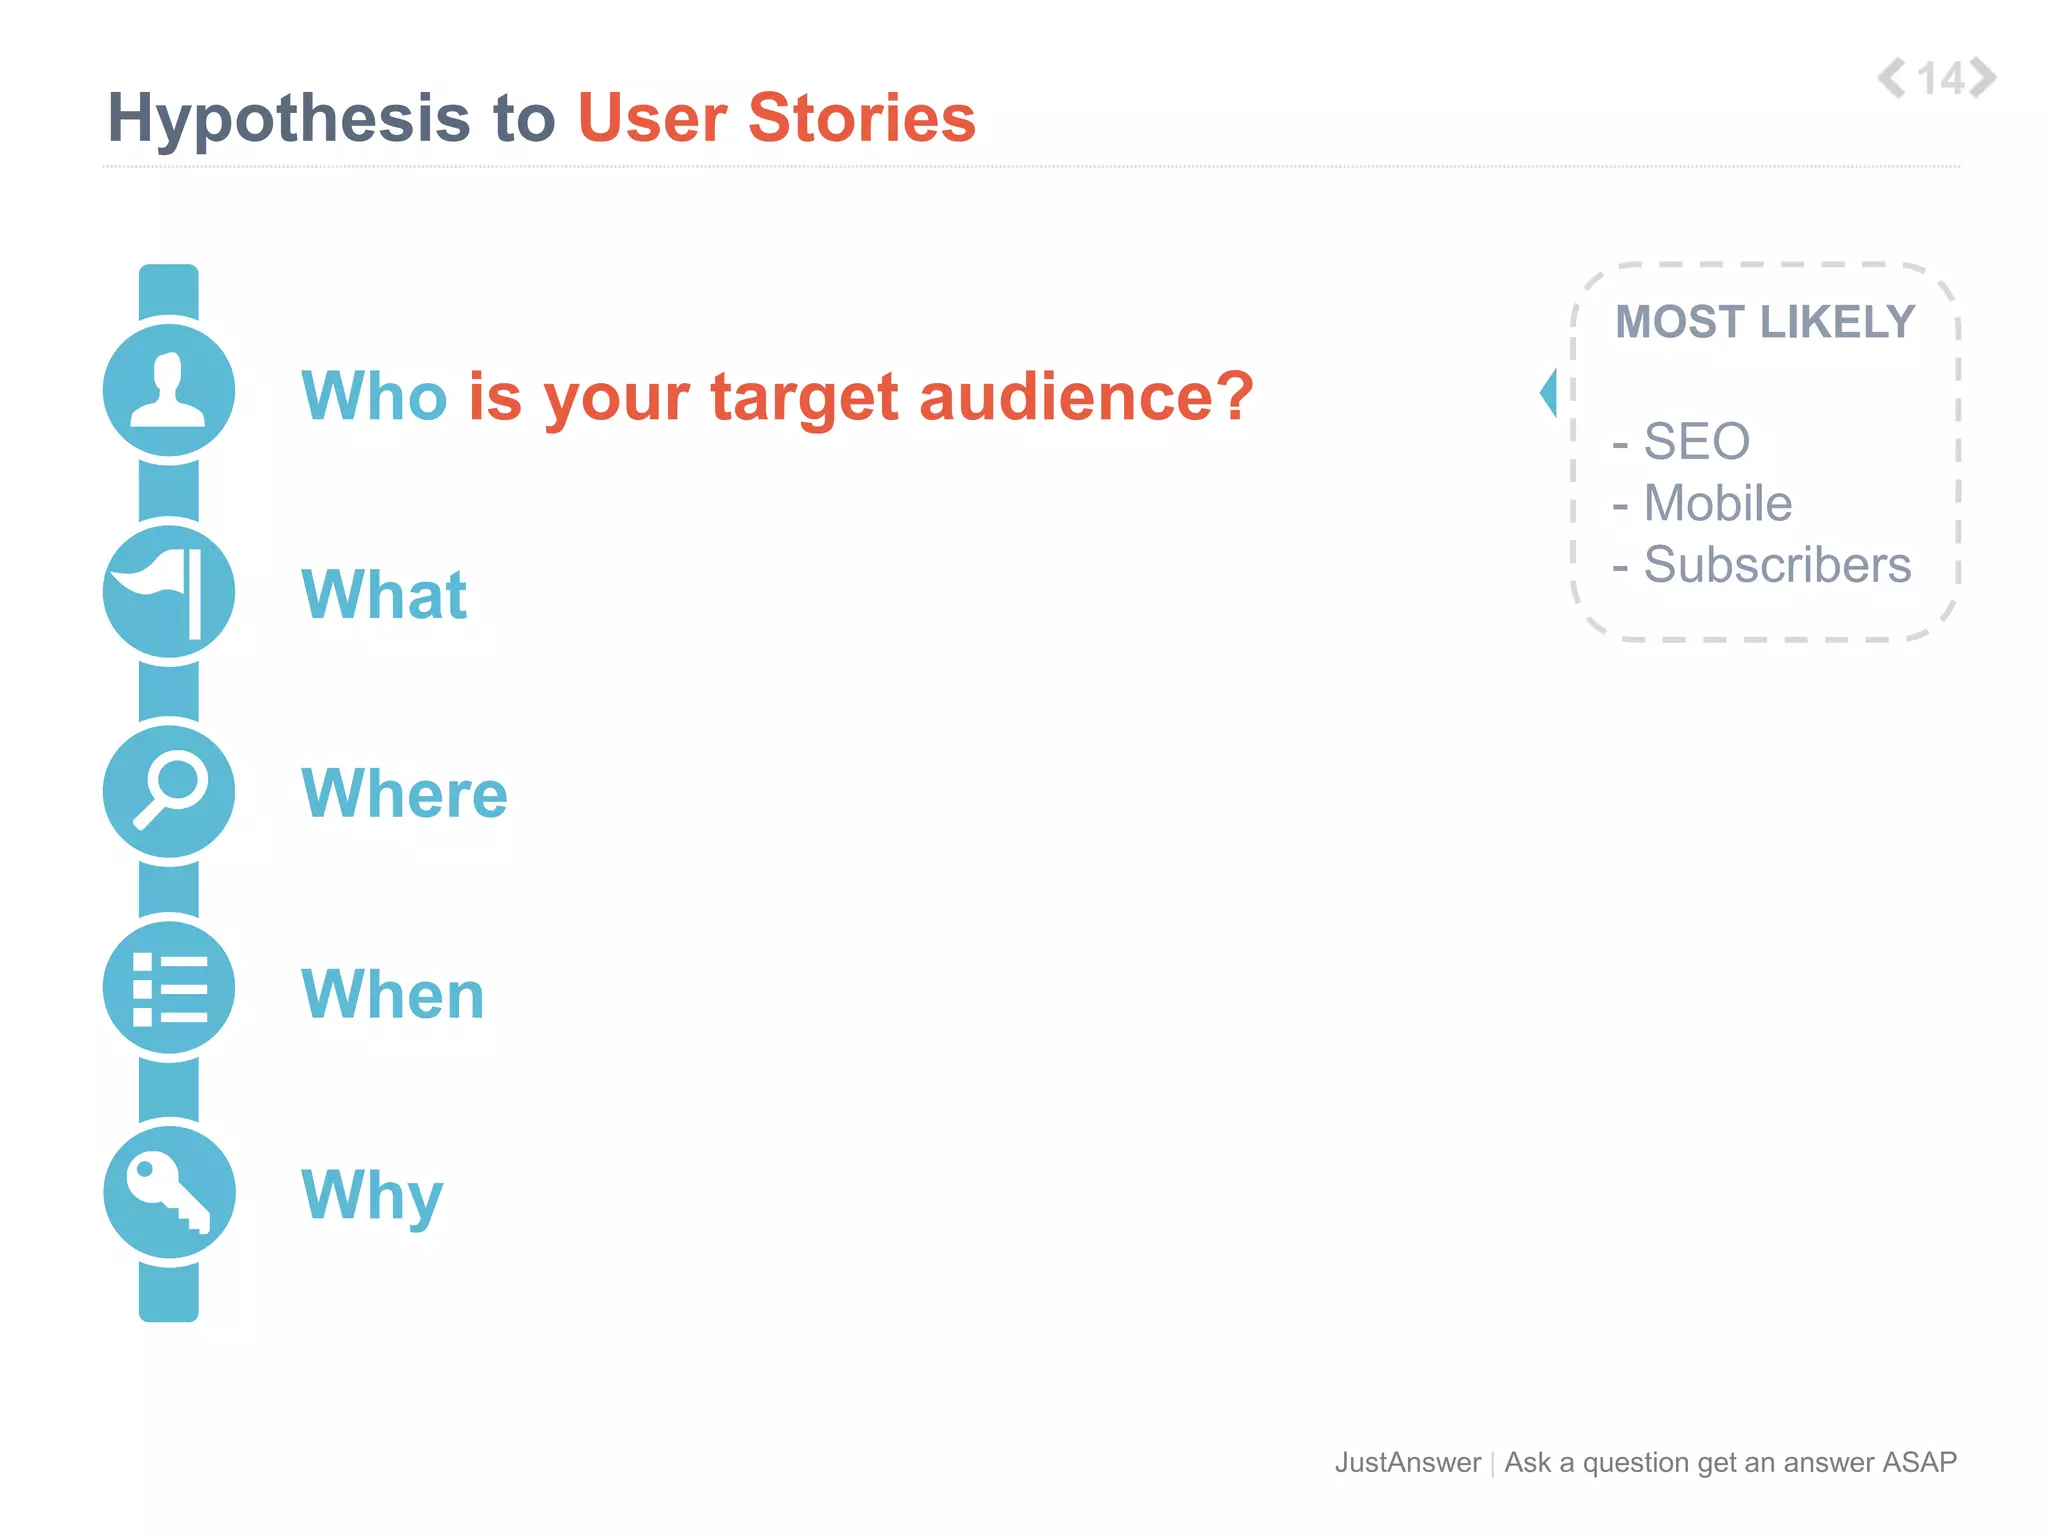
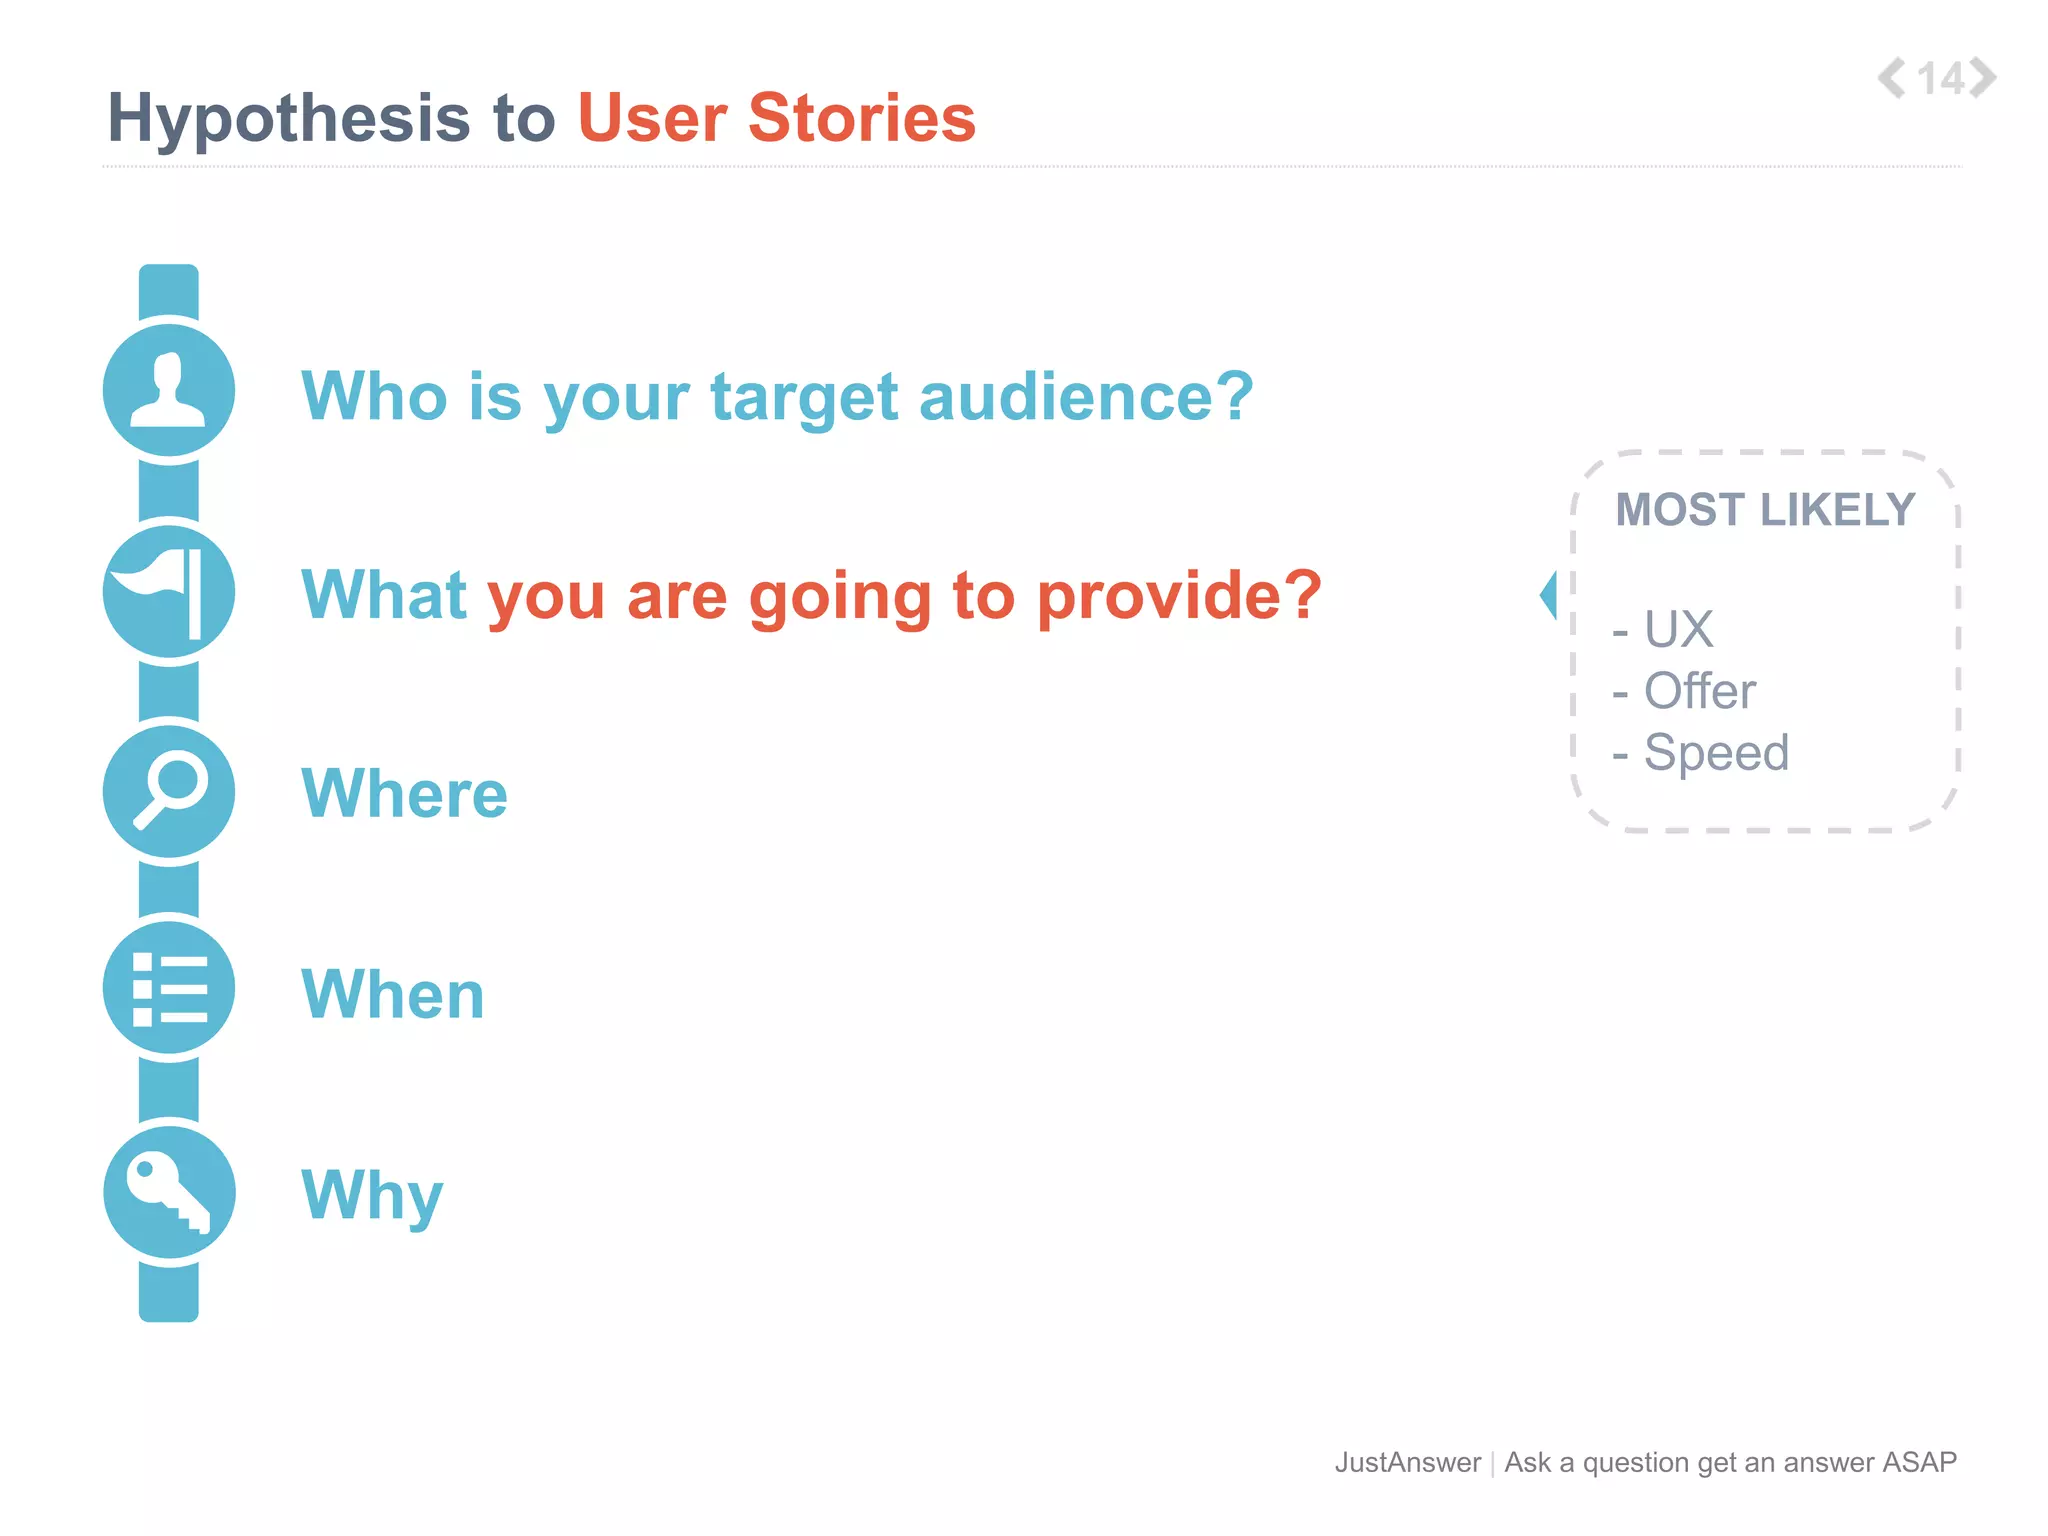
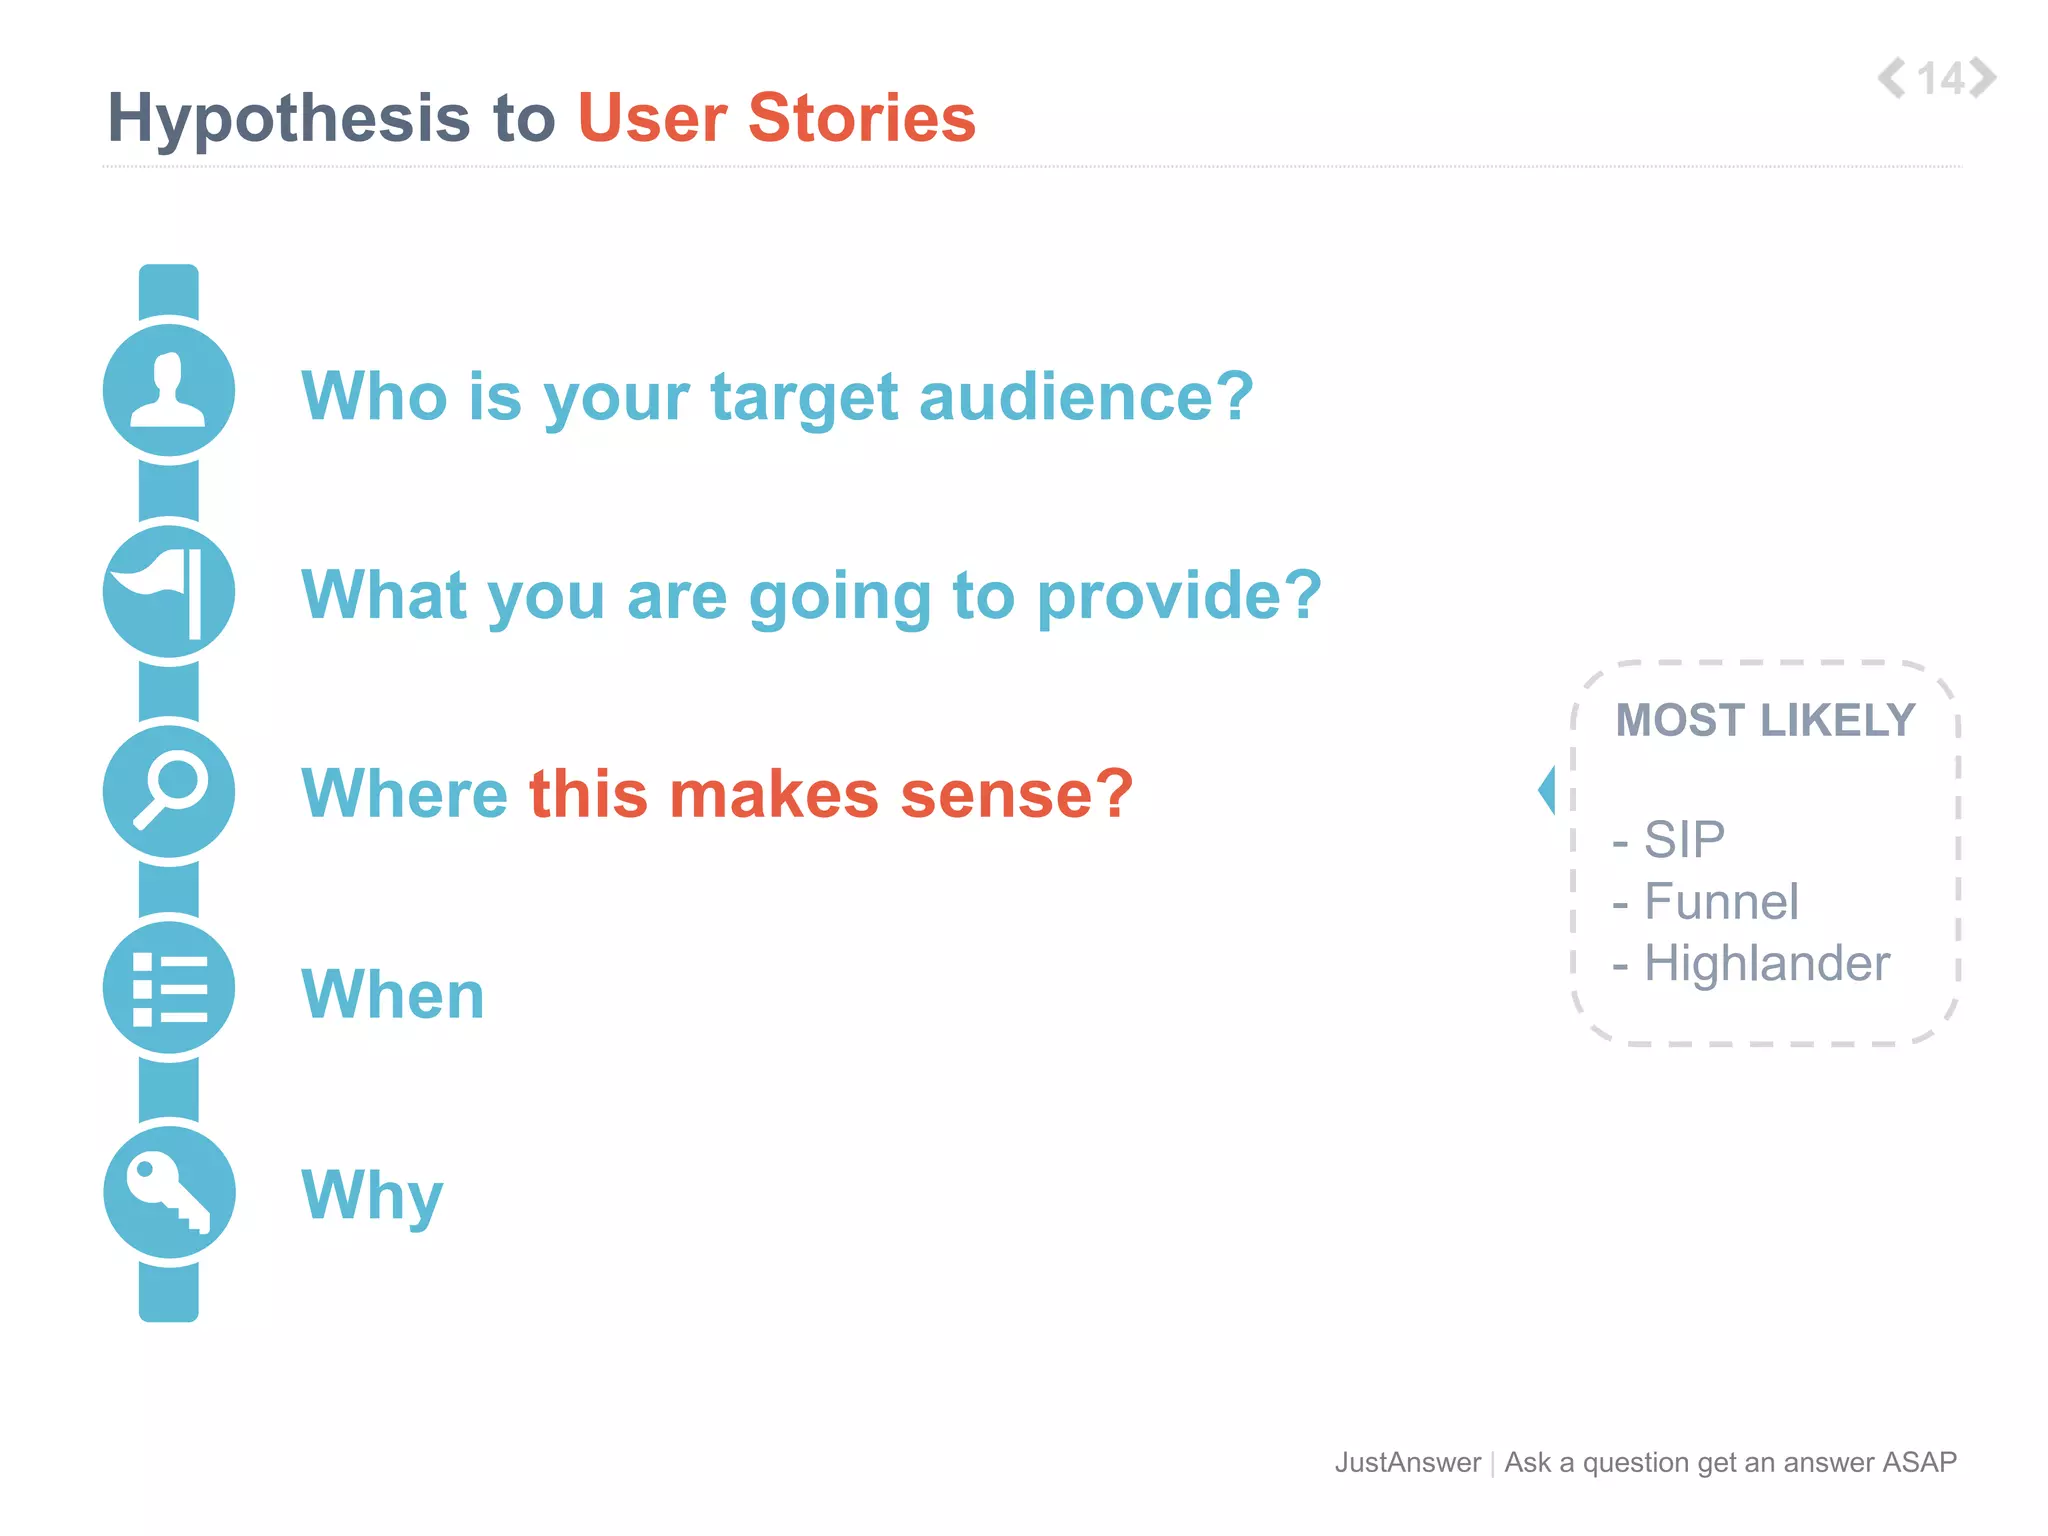
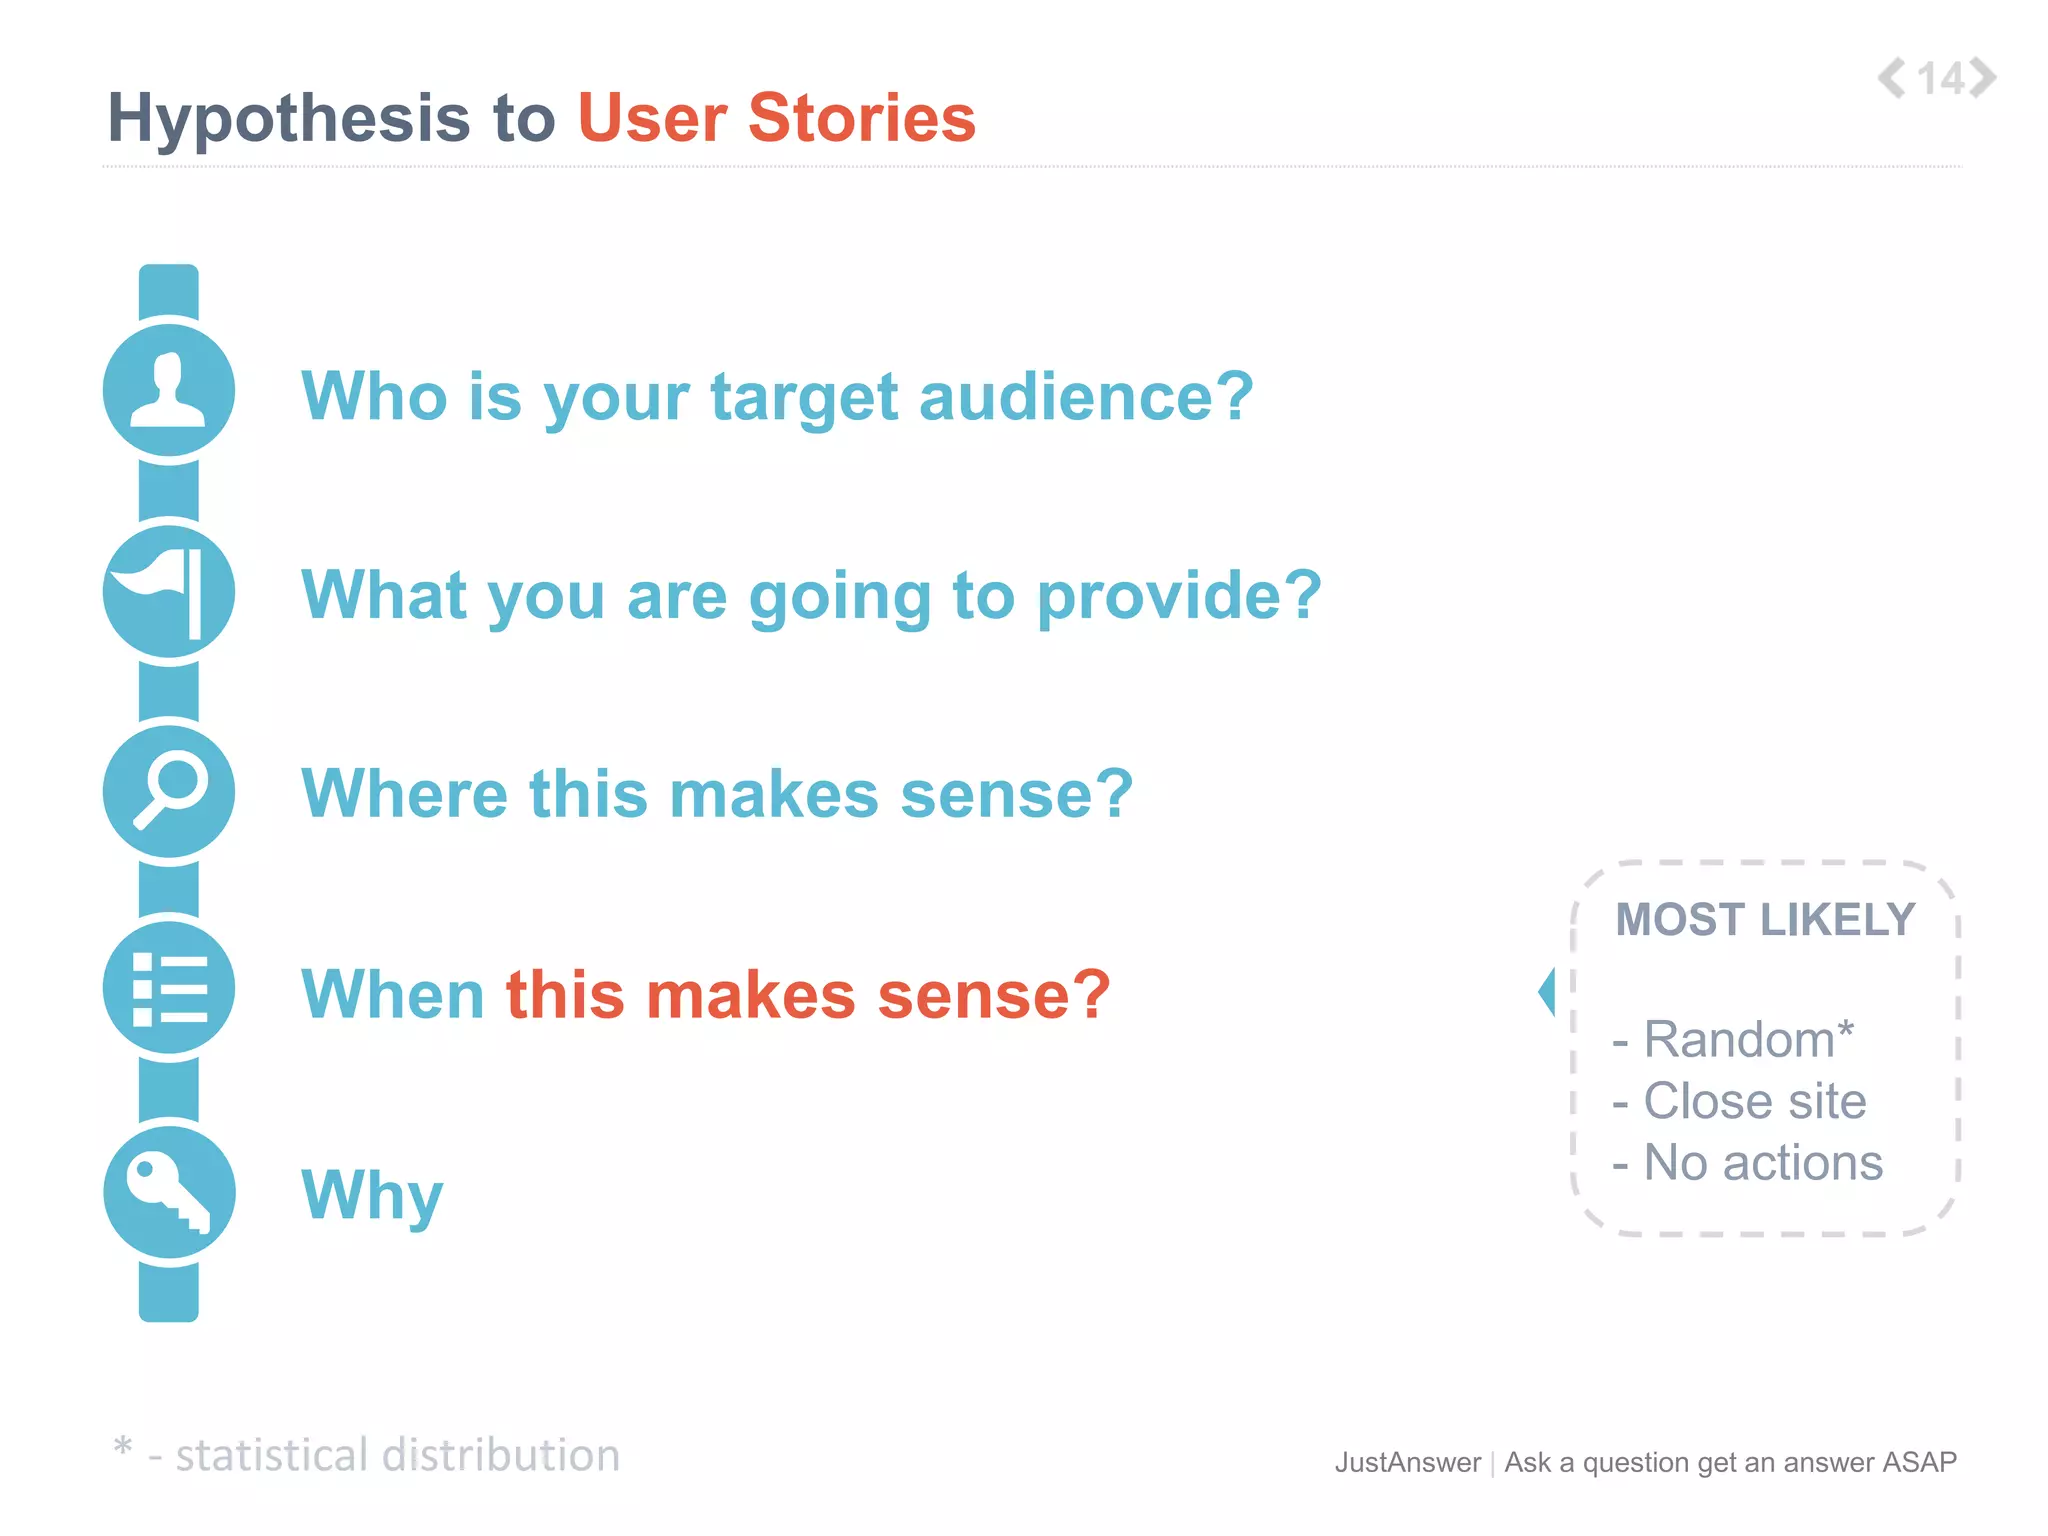
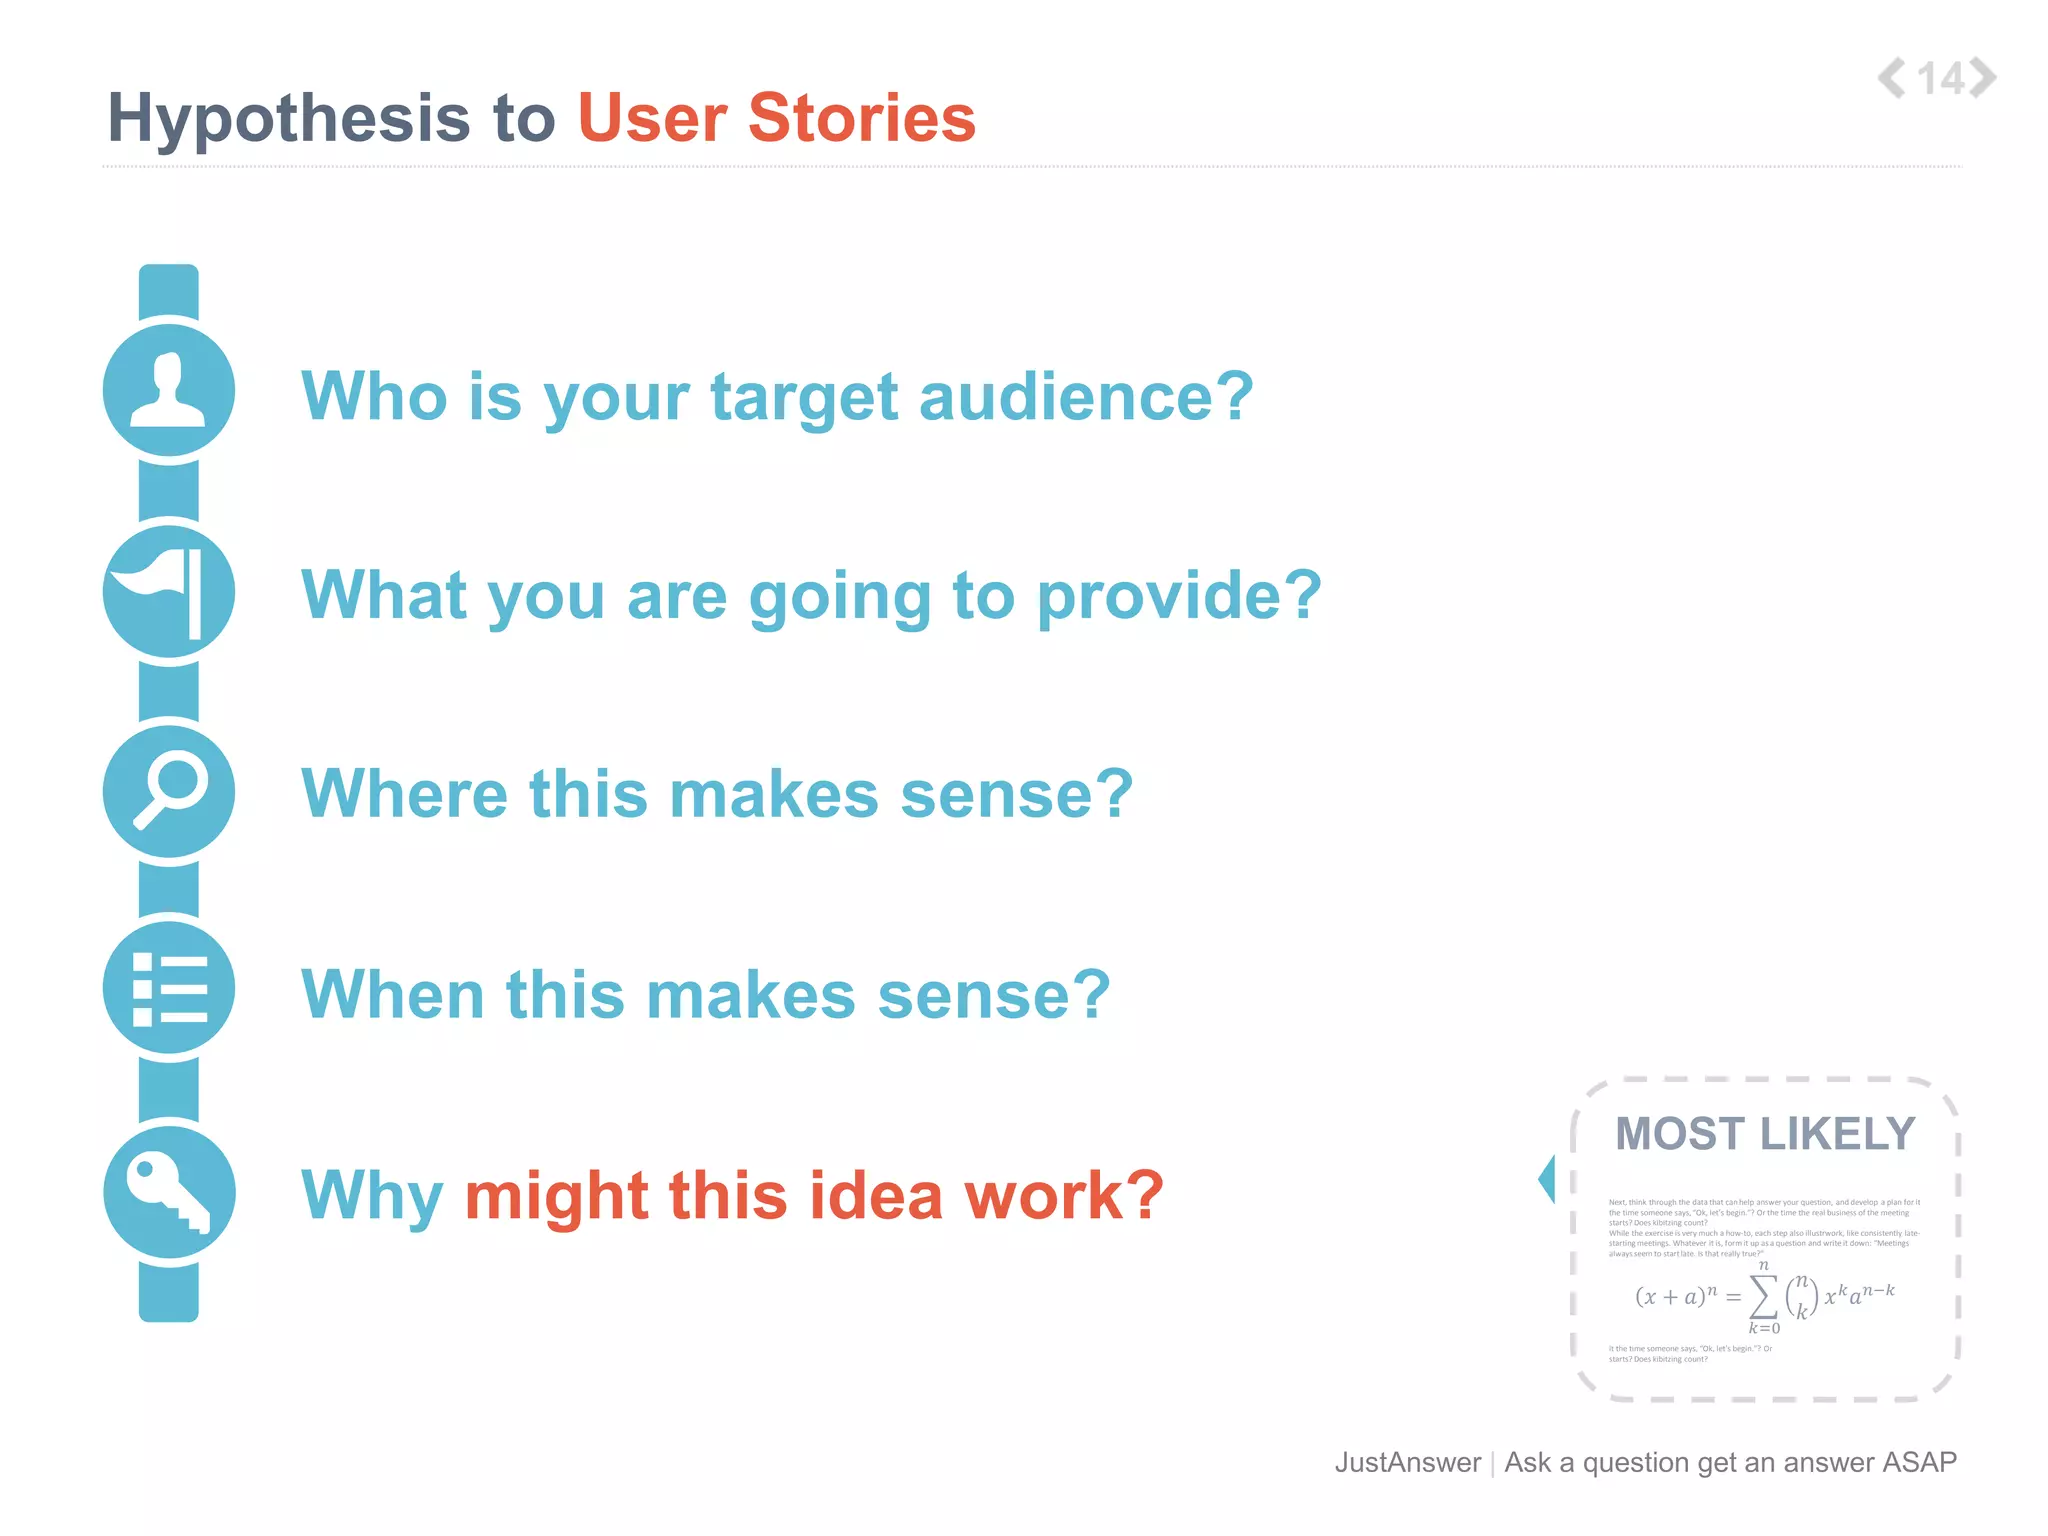
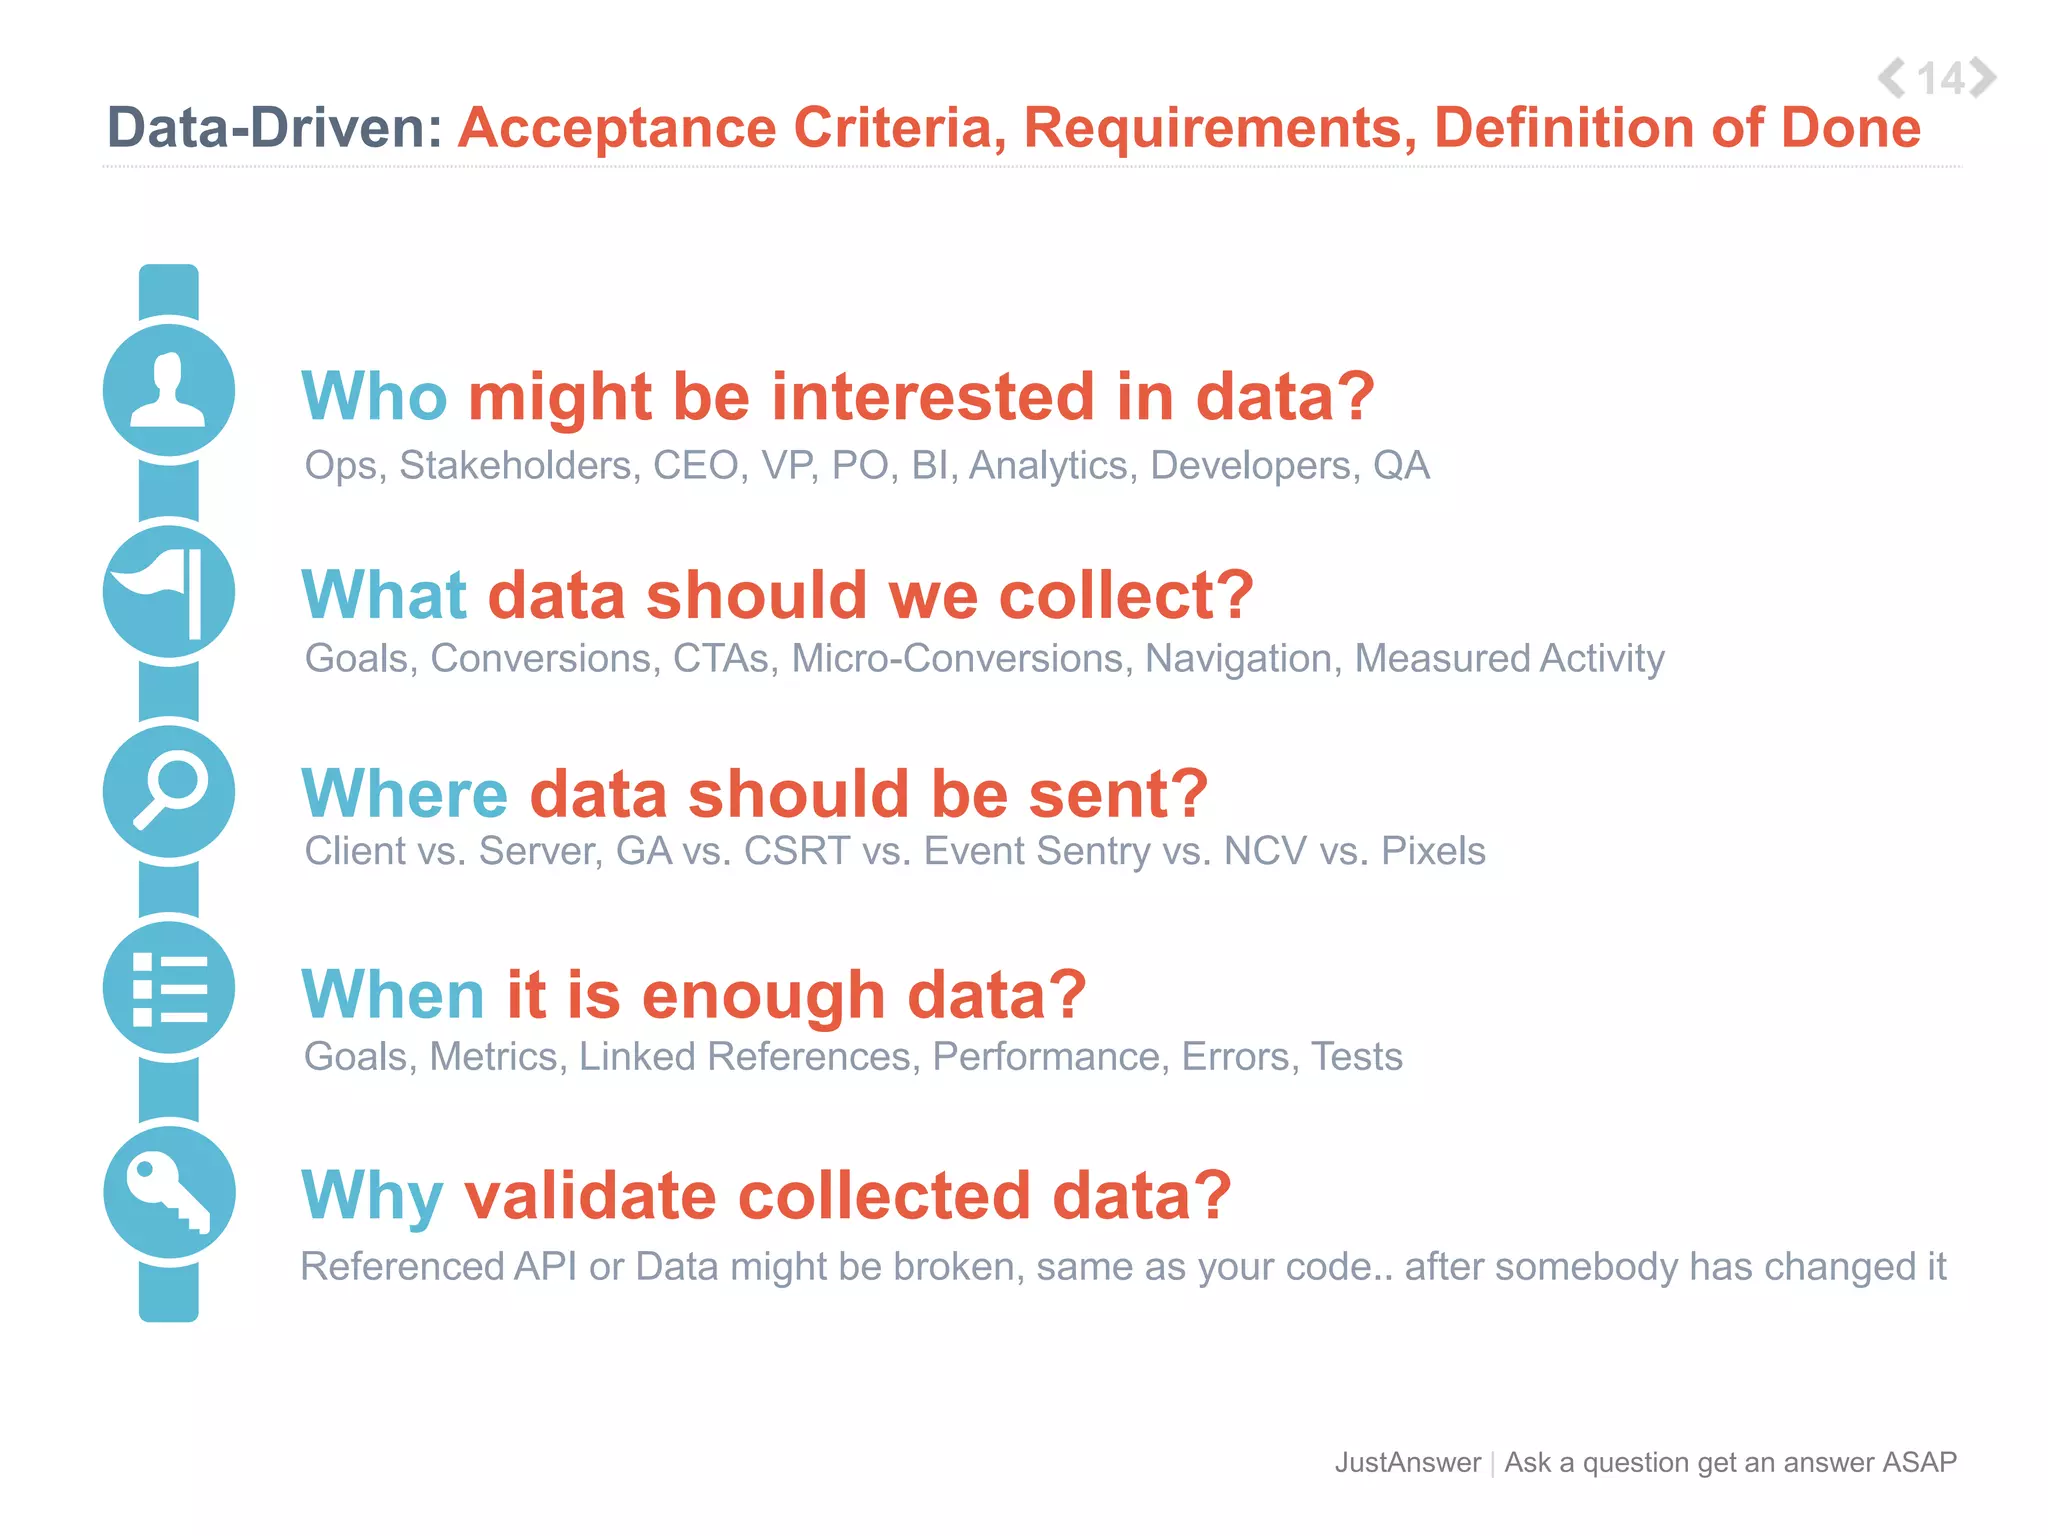
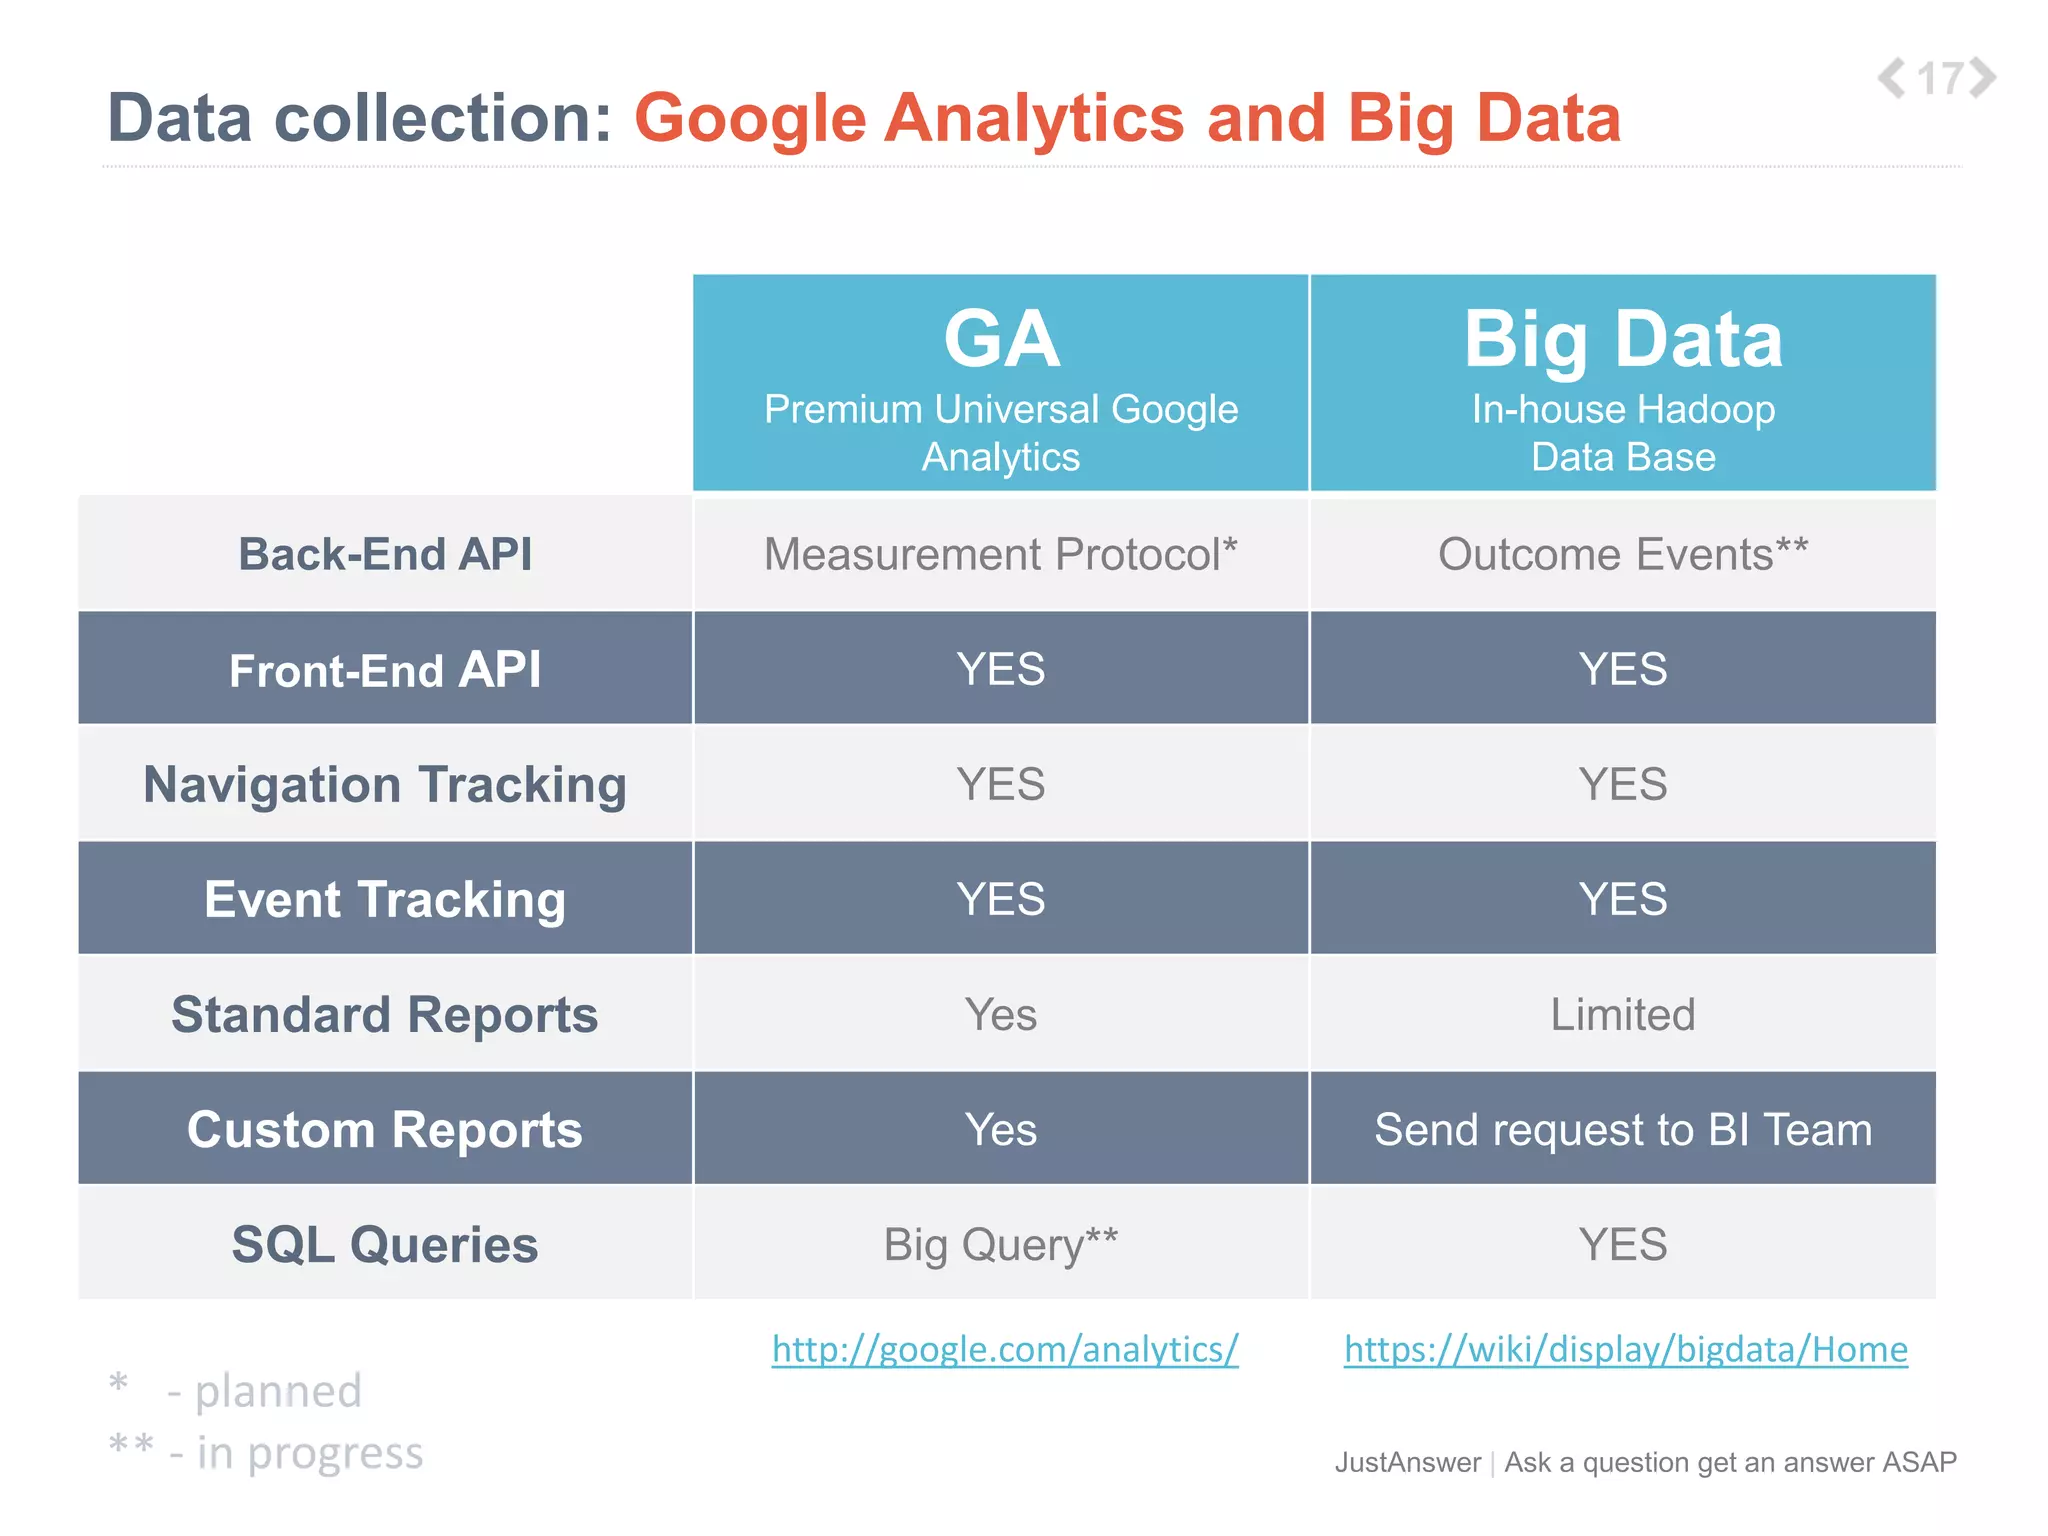
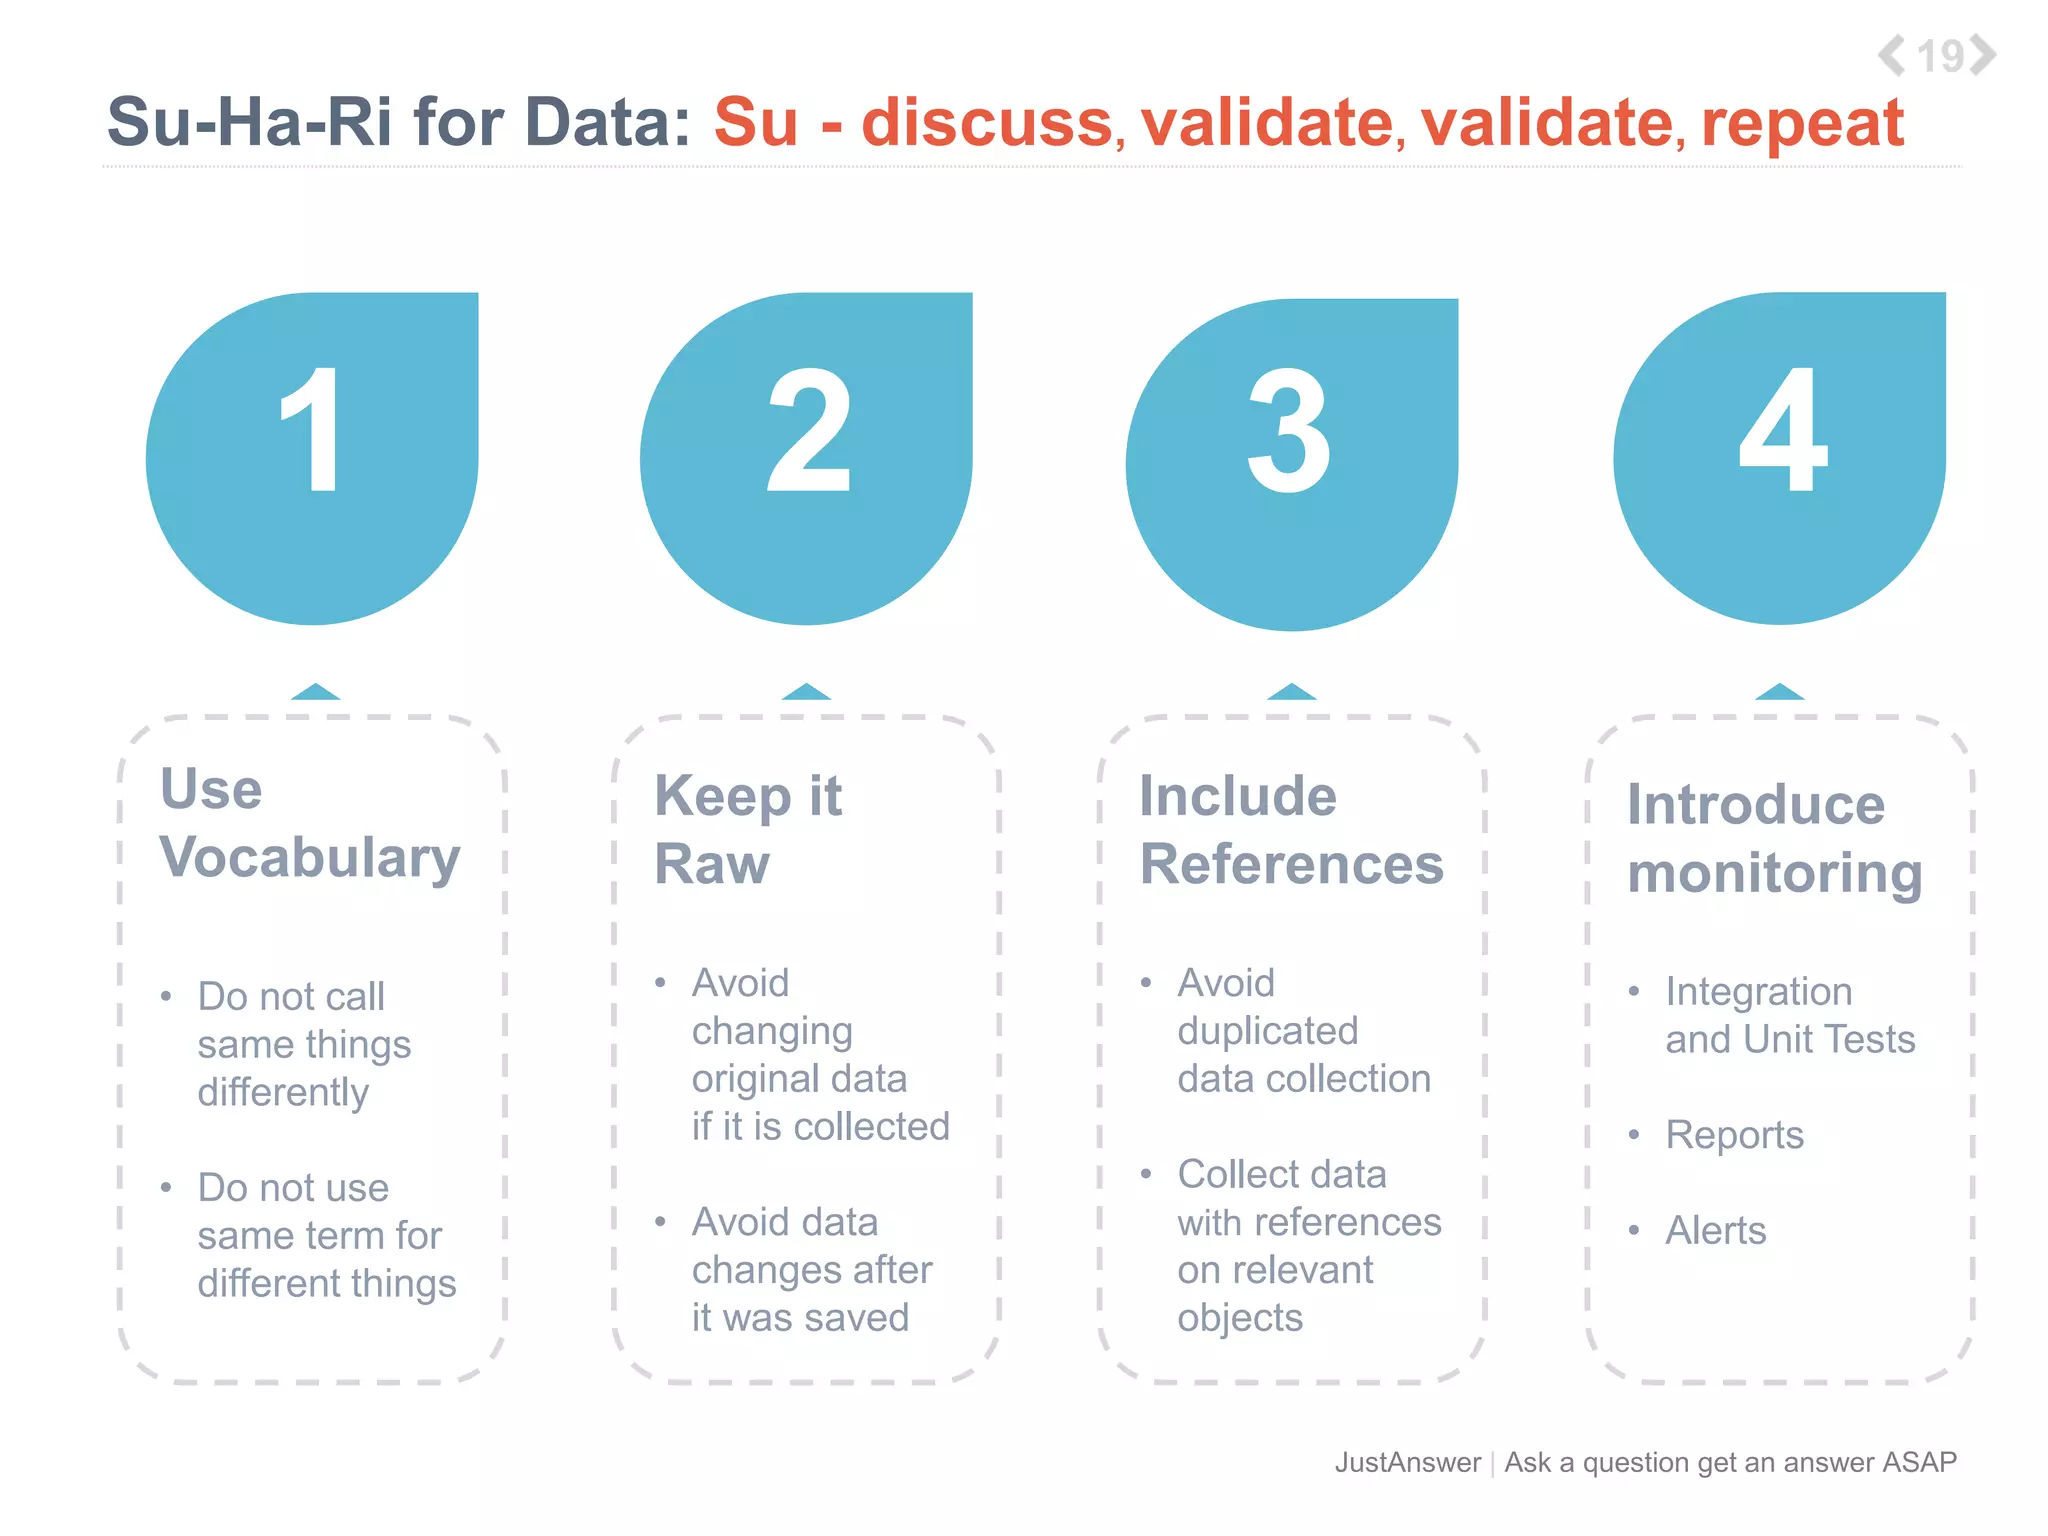
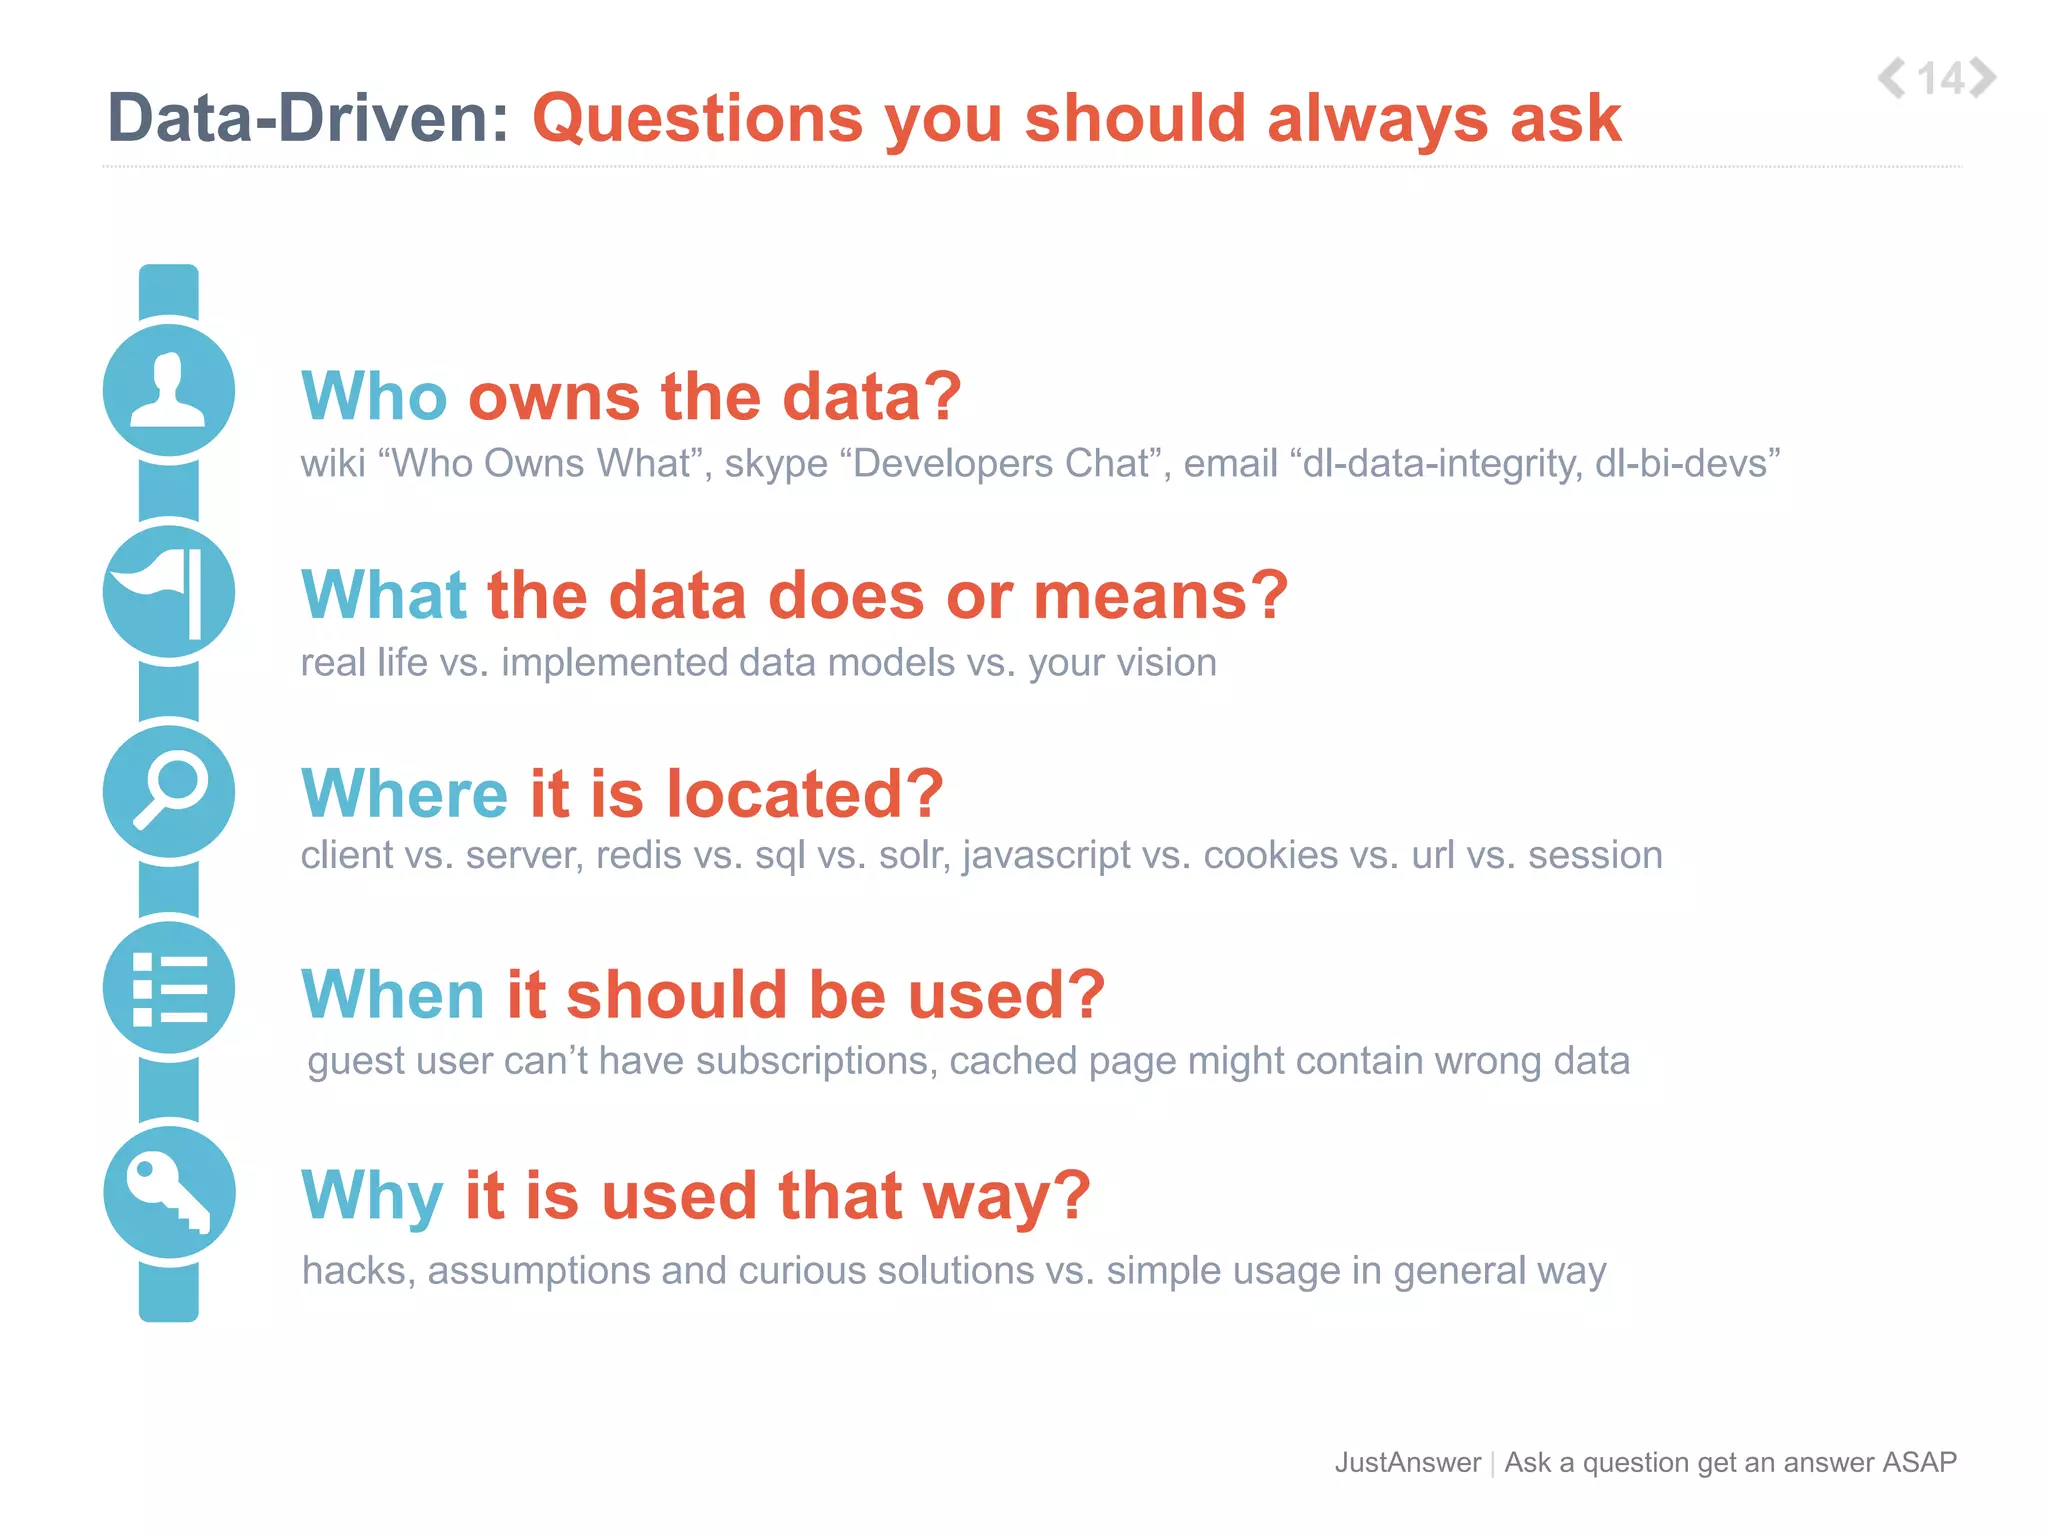
Process of switching to Data-Driven Requirements for User-Story creation. It has information about internal JA tools, which isn't useful for anyone outside the company.
Agile Analytics: The Secret to Test, Improve, Fail & Succeed Quickly.Venveo
The document discusses agile analytics and its benefits for businesses. Agile analytics involves rapidly testing hypotheses, analyzing results, and making improvements to gain a better understanding of customers, get results more quickly, and reduce risks. It recommends businesses focus on a single problem, develop small testable hypotheses, iterate testing every 2-4 weeks with specific changes, and use findings to direct the next round of improvements. Practicing agile analytics allows organizations to test, improve, fail, and succeed quickly.
Pat Wallwork, Partner and Media Director at McKee Wallwork & Company (an integrated marketing agency), shares her thoughts on the early benefits of visualizing data. Benefits include:
- More confident in decision-making
- See and remember patterns
- Powerful with vendor negotiations
This document discusses applied data science and machine learning. It begins by introducing the author and then discusses machine learning concepts like learning from data and choosing the best predictive model. It explains that data science is about creating value from data using machine learning, analytics, and visualization. However, many companies struggle to operationalize data science projects and end up with only prototypes instead of production systems. The document outlines three common hurdles - oversimplifying requirements, focusing only on model accuracy instead of practicality, and having insufficient data engineering skills. It advocates for taking a more holistic, business-focused approach to applied data science.
H2O World - What you need before doing predictive analysis - Keen.ioSri Ambati
This document provides guidance on setting up predictive analytics. It recommends being proactive rather than reactive, understanding how to acquire and analyze the right data, and creating a diverse team that includes various domain expertise. It also stresses the importance of performance, knowing your tools, and addressing challenges like deciding which analytics tools to use, combining data sources, and collecting data while maintaining privacy and integrity. The goal is to figure out what the existing data reveals, agree on business problems, identify useful predictions, and build an iterative pipeline to feed predictive algorithms.
The Biggest Growth Opportunity is Right Under Your NoseSean Ellis
These slides were used for a webinar about driving growth by improving the conversion performance of your website. The slides focus on identifying why someone visits your website and uncovering the key issues that prevent conversions. The webinar was presented by Qualaroo CEO Sean Ellis and UserTesting CEO Darrell Benatar about
Focusing on the right aggressive growth goals can dramatically increase your company's overall growth rate, moving your team from random ideation to creative problem solving. In these slides, Sean explains how to set and achieve high impact growth goals. You’ll learn how to determine the ideal target and time frame for each growth goal and how to rally your team around a proven growth hacking process for achieving the goals.
The document summarizes the journey of four engineers who went through Stanford's Lean LaunchPad class to develop an MVP for a startup idea. Over nine weeks, they tested several hypotheses through customer interviews but were unable to find product-market fit. Their final idea involved personalized recipe recommendations but they determined it was not a viable business due to high customer acquisition costs and an unproven revenue model. They learned important lessons about customer discovery, competition, and the importance of prioritizing revenue.
Agile Marketing Meetup: Moving Beyond the Marketing Plan So You Remain RelevantSean Ellis
Annual marketing plans can't keep up with the rapidly changing landscape of digital marketing acquisition channels and tactics. To remain relevant, CMOs and marketing teams need to completely rethink their marketing/growth approach. This presentation highlights the agile process that today's fastest growing companies are adopting - from building the right team to executing an agile marketing process.
Acceptance, accessible, actionable and auditableAlban Gérôme
Many a stakeholder presented with actionable insight have expressed doubts about data quality, its relevance or potential impact. In other cases, the stakeholders will want a data analyst who also commands knowledge of the business or a similar unicorn. The web analytics practitioners would rise to the challenge, and the stakeholders will then want their own Hans Rosling and his dazzling data visualisation and raconteur sills. Your stakeholders are silently experiencing the data transformation like a conservatorship. How can you help them perceive your efforts like a temporary guardianship from which they will emerge as ready to face your data-driven competitors?
The document provides an overview of the radical analytics approach which embraces agile principles and premises like never asking and always proposing, viewing DMAIC as a friend, and analysts being change agents. It discusses objectives, critical thinking, and defining a realistic roadmap. Key aspects covered include embracing agile development, conducting pilot projects to reduce risks, viewing analysts as change agents, and emphasizing a breadth of understanding and enabling business outcomes through data-driven insights and recommendations.
H2O World - Advanced Analytics at Macys.com - Daqing ZhaoSri Ambati
The document discusses advanced analytics at Macys.com. It outlines the challenges of big data predictive modeling such as scaling models, ensuring timely models, integrating models, and testing models. It describes Macys.com's advanced analytics team which includes data scientists with backgrounds in quantitative fields. The team works on projects such as personalized site recommendations, response propensity models, customer acquisition/retention modeling, and experimentation platforms. It provides examples of Macys.com's real-time site personalization and customer segmentation work.
Startupfest 2015: SEAN ELLIS (GrowthHackers.com) - "How to" StageStartupfest
How to build a high performance growth team
Growth teams across Silicon Valley and beyond are driving unprecedented results. But contrary to popular mythology, their results are not based on a grab bag of secret growth hacks. Instead, these growth teams are applying a rigorous process of testing and analysis to uncover and optimize sustainable and scalable growth drivers. Sean’s presentation will explain how and when to implement this proven growth process at your startup.
Pdf analytics-and-witch-doctoring -why-executives-succumb-to-the-black-box-me...OrateTeam
This document discusses common issues ("pathologies") that organizations face when adopting analytics and data-driven approaches. It summarizes these pathologies in 3 sentences or less:
Organizations often treat analytics as a "black box" without understanding how it works due to the technical nature of analytics and lack of transparency in algorithms and methods. Many projects fail because organizations jump into analytics without properly preparing their data, validating results, or planning how insights will be implemented and drive business changes. To successfully adopt analytics, organizations must ask critical questions about data quality, intended use cases, and consequences of results in order to focus efforts and avoid wasting resources on initiatives that do not provide value.
This document discusses how analytics and data science projects can benefit from adopting agile principles and methods. It notes that analytics problems are often non-linear like scientific problems, requiring an agile approach with rapid experimentation and refinement of models and insights over time based on feedback. Adapting agile practices like user stories and incremental improvements can help analytics teams discover valuable insights and continuously learn from their work and data. The document also promotes the use of new technologies like data lakes and data virtualization to help provision agile data architectures that support rapid analytics experimentation.
This document discusses data lakes and how they can help companies analyze large amounts of raw data from various sources. It describes how a data lake differs from a data warehouse in its structure and ability to support different types of users. The document then shares one company's experience using a data lake to better distribute tasks, measure team member efficiency, improve task estimates, reduce repeated mistakes, and address issues like breaking service level agreements. It concludes by identifying remaining questions, opportunities to improve the data being collected, and takeaways for getting started with a data lake.
Data Lakes in Real Life: Analyzing Analysts to Improve Process Efficiency, Su...Mariia Bocheva
This document discusses data lakes and describes a company's experience using one. It outlines the key benefits of data lakes such as their ability to store raw data in a cost effective way and make it accessible to various users. However, it also notes challenges the company faced with insufficient task distribution, a lack of efficiency measurements, incorrect estimates and repetitive mistakes. Their data lake solution helped address these issues by providing detailed workload analytics and automation guides. Going forward, they aim to integrate additional data sources to get a more holistic view and answer remaining business questions.
The document discusses some of the risks and challenges of data visualization and analytics programs in organizations. It argues that while complex data visualizations can work, they are difficult to implement successfully from scratch. Additionally, stakeholders may claim the benefits from outside ideas while only superficially complying with analytics recommendations. The document provides steps for organizations to truly realize change through data-driven insights, such as having leadership buy-in and starting with small, test-based implementations.
How Truly Effective CRO Requires Great UXGiles Thomas
How Truly Effective CRO Requires Great UX - How CRO is about profits not conversions. How an effective CRO process requires qualitative and quantitative data analysis for test hypothesis ideas and big profit lifts.
The document outlines five rules for transforming big data into decisions: 1) Start with the question, not the data, 2) Write down your fitness function, 3) Experiment by launching and learning, 4) Respect and empower your customers, and 5) Embrace transparency. It also suggests collaborating with people and machines as a bonus rule. The document proposes a thought experiment about what could be done with all of Google's data and concludes by emphasizing making the implicit explicit.
H2O World - Translating Advanced Analytics for Business Users - Conor JensenSri Ambati
The document discusses developing advanced analytics for business users. It recommends four key steps: 1) Identify the intended analytics consumer, 2) Hire analytics talent with both technical skills and business knowledge, 3) Develop the analytics collaboratively with end users, and 4) Present the data in a way that tells a compelling story tailored to the audience. The role of business users is to interpret and apply analytic results, so they must understand what to trust in a model and where their own judgment is needed. Presenting analytics is about communicating insights effectively rather than showing off complex visualizations.
Getting Started with Product Analytics - A 101 Implementation Guide for Begin...Vishrut Shukla
The document provides an overview of a workshop on getting started with product analytics for beginner and aspiring product managers, outlining why analytics is important for product development, how to plan an implementation by gathering requirements from stakeholders and choosing tools, and important considerations like backing up your primary analytics with a secondary implementation. It also includes examples, activities, and "commandments" or best practices for setting up an effective product analytics system.
This presentation, originally delivered as a webinar, outlined the latest in thinking around employee feedback programs, specifically looking at pulse surveys and innovative ways organisations can use them.
Optimize Everything : A framework for solving your BIGGEST Problems Through O...Optimizely
What problem are you trying to solve? In this session we'll introduce a supremely simple & road tested framework for achieving desired outcomes in every part of your business through data. The framework, called Problem Solution Mapping (PSM) will be brought to life using real-world examples that were ultimately delivered and validated through testing & personalization.
Product Driven Growth from Lean Product MeetupSean Ellis
The competition for acquiring customers gets more intense every year. These slides show the four requirements for creating an agile growth organization needed to realize your company's full growth potential.
Delivering on the KCS promise and empowering people by tracking the evolution...KM Chicago
The document discusses key concepts of the Knowledge Centered Support (KCS) methodology for improving knowledge management. It outlines 6 metrics that can be used to track the success of a KCS implementation: 1) session usage, 2) content usage, 3) published content and user reputation, 4) user flagged content gaps and activities, 5) category usage, and 6) intent coverage. Case studies are presented showing returns on investment for companies that achieved improvements in operational efficiency, agent proficiency, and self-service capabilities through adopting KCS practices.
This document discusses techniques for optimizing a landing page to reduce its file size. It begins by showing the file size reduction achieved by splitting the page into three parts that load sequentially. Images were compressed in Photoshop, and corners/gradients were replaced with CSS. HTML tags and content were rearranged and unnecessary tags were removed. A live demo compares the original and optimized pages and shows improved loading performance after these optimizations.
Universal Google Analytics: Event TrackingVlad Mysla
This document discusses using Google Analytics event tracking to track user interactions and transactions on a website. It provides examples of event tracking code for different types of events like a question being posted, a popup being visible, or a validation error. It also discusses setting up event tracking for specific elements like a chat popup or button clicks. Finally, it mentions being able to view tracking reports and segments in Google Analytics to analyze tracked user events.
The document discusses what characterizes a professional developer. It argues that professionalism is about using best practices and disciplines, such as test-driven development, clean code, and continuous learning, even when under pressure. Writing unreadable or defective code is never acceptable for a professional. A professional developer maintains high standards for code quality and chooses best tools and practices for the job.
A workshop presenting tools to define what is success for you Kanban system and how to get there using Continuous Improvements.
This material was first presented at the Lean Kanban North America conference 2016 in San Diego
Spotify - staying lean from small start-up through rapid growthJoakim Sundén
In a few years Spotify has grown from a small startup in Sweden to a pretty big company with more than 30 engineering teams in four different development offices on two different continents. And we have no intention of slowing down. Such rapid growth carries big challenges. How can we continue to improve our product at great speed, while growing the number of users, employees and supported platforms and devices? How do we stay lean and agile when we grow from a small startup to a big corporation? In this talk we will present how Spotify is addressing these challenges. We will talk about autonomous squads, tribes, retrospective gatherings, guilds, hack weeks, system owner days, and a lot of other ideas we’re experimenting with.
Practical intro to kanban- Joakim SundenAGILEMinds
This document provides an introduction to Kanban, a lean methodology for software development. It discusses Kanban principles like limiting work-in-progress and visualizing the workflow. The document recommends starting with an existing workflow like a Scrum board and adding more detail. It then demonstrates setting work-in-progress limits and showing how items flow through each step of the visualized process from backlog to completion. The key aspects of Kanban covered are visualizing the workflow, limiting work-in-progress, and focusing on continuous flow to reduce lead times.
- The team transitioned from Scrum to a Kanban system with no iterations to address issues like lack of continuous delivery and pressure to complete all work by the end of each sprint.
- They implemented Kanban practices like limiting work in progress, just-in-time planning, and decoupling demos from sprints. This improved focus and flow of work.
- Over time, new challenges emerged as the team grew and split into two teams, and business stakeholders had different preferences around estimating work. The engagement ended as the teams refined their Kanban approach to maintenance further.
Scaling Agile at Spotify (representation)Vlad Mysla
This presentation is about real-life example of Software Company, which's design is based on Agile principles and can be scaled for huge companies.
References:
1. Evolution of Networks: The Stages of Human Organization
By Jessica Lipnack and Jeffrey Stamps
2. Scaling Agile @ Spotifywith
By Henrik Kniberg and Anders Ivarsson
Brent Summers, Director of Marketing at Digital Telepathy Using Data and Design toDrive Your Business June 25, 2015
Data is All Around You 1
Quantitative Data Sales Reports Data is All Around
Quantitative Data Application Performance Data Data is All Around You Quantitative Data Search Engine Optimization Data is All Around
Quantitative Web Analytics Data is All Around You
Qualitative Data Customer Surveys Data is All Around You Qualitative Data Customer Interviews Data is All Around You Get more info at: goo.gl/Jeol7v
Qualitative Data Personas Data is All Around You Get more info at: goo.gl/UW8mgQ
Observation Heat Mapping & Scroll Mapping Data is All Around You Observation User Behavior Data is All Around You
Data Already 
 Informs Design 2
A/B Testing Optimize for conversions. Data Already Informs Design
Eye Tracking People read in F-Shaped Pa erns Data Already Informs Design
Eye Tracking People look where people look. Data Already Informs Design h
Vertical Rhythm There’s a reason paper is ruled. Data Already Informs Design
Color Psychology What does your brand color say about your business?
The Golden Ratio 1.618 —
Consider the Entire 
 User Journey 3
Identify the Friction Evaluate sentiment/friction at each stage of the user journey. Consider the Entire User Journey
Designing for
 Business Objectives 4
Identify the Friction Where can you make the biggest impact? Designing for Business Objectives
User Journey Consideration
Landing Pages Incremental improvements can drive exponential results.
Be er Social Sharing Social sharing + content performance insights.
Animations Scroll is the new click.
Change Language Try different value proposition, calls to action, etc.
Change Layout Use behavior patterns to drive decisions.
User Journey Conversion: The act of purchasing a product or service through self service or a sales process.
Content Marketing Share knowledge to establish trust. Onboarding Step-by-step walkthroughs for new users.
Get the First Click Break through psychological barriers. User Journey Retention: Post-purchase. Activities that drive further product engagement, adoption and upgrades. Designing for Business Objectives
Reduce cognitive load: hide data until a user requests it.
Simplify your user interface for experienced users
Testimonials “Who doesn’t love social proof?” - Brent Summers
Prioritizing Your Backlog
Keep Track of Experiments Practical Advice Use a formula to assess which experiments to do first.
Sample Experiments Which of these experiments should be implemented Paid conversions
What does the data tell you? Identify where can design make the biggest impact.
Rounding Out the Process Your implementation method is unique. Measure the results. Repeat.
Measuring Success 6
Good Design is Great for Business Design lead firms out-perform the S&P 500 by 228%. Measuring Success
Optimizely building your_data_dna_e_booktthhciciedeng
This document provides guidance on how to build a company's data DNA by establishing key metrics, gathering both quantitative and qualitative data, and using that information to optimize business performance through experimentation and A/B testing. It emphasizes the importance of identifying a single "guiding light" metric that defines business goals and can be used to prioritize optimization efforts. The document also outlines how to map customer journeys and core conversion funnels in order to determine high-value areas of a website or product to test. It recommends using qualitative user research to identify major roadblocks or weaknesses before developing hypotheses for A/B tests aimed at improving conversion rates and the guiding metric.
Master the Essentials of Conversion Optimizationjoshuapaulharper
This document outlines the essential steps for conversion optimization, including gathering data through analytics, surveys, mouse tracking and heatmaps, user testing. It discusses analyzing this data to form hypotheses and prioritize tests. The key steps are testing hypotheses through A/B testing, learning from both successful and failed tests, and continually iterating to improve conversions. The overall message is that conversion optimization requires following a process of data collection, analysis, testing and learning from results.
Training Taster: Leading the way to become a data-driven organizationGoDataDriven
The document discusses becoming a data-driven organization. It provides an overview of the value chain of data science and an analytics maturity journey. The value chain of data science shows how data can be measured, optimized, used to generate predictions and insights, and ultimately create value. It emphasizes starting with the desired value and working backwards to the necessary data. The analytics maturity journey outlines four phases - initialization, continuous experimentation, enterprise empowerment, and data democratization - with different focuses at each stage to build analytical capabilities and business adoption of data and analytics. Key roles in a minimal viable data science team are also outlined.
This document summarizes a discussion between Christy Gilchrist from Wellspan Health and Todd Tullis from goBalto on using site intelligence and predictive analytics to improve clinical trial feasibility assessments, site selection, startup, and performance evaluation. Some key points discussed include:
1) Using data analysis of electronic health records and epidemiological models to better predict patient enrollment expectations and feasibility at sites.
2) Measuring site and sponsor responsiveness to startup tasks in real-time to facilitate faster resolution of issues.
3) Evaluating site performance against enrollment goals, compliance goals, and business goals to help sites improve for future trials.
4) Sharing post-study performance data with sites to build
1) The document is a presentation about using data to drive insights and experiences. It discusses defining objectives, assessing relevant data sources, and generating insights and data outputs.
2) A key point is that data alone is not valuable - insights create meaning from data. Insights should challenge conventions and uncover underlying motivations.
3) Measurement is important to optimize performance and should be tied to objectives through KPIs and diagnostics. Tagging data properly allows tracing activities to understand what works.
Going Beyond ‘What Success Looks Like’ – Using Data to Achieve Successful Pro...Jamie Clouting (CSPO)
Delivering value is at the heart of the Business Analyst role, but how easy is it to identify tangible value and prove the success of a project or program?
In agile projects we’ll often define a “definition of done” or ask the question “what does success look like”. At LateRooms.com, we’ve developed a toolkit for our Business Analysts to support the business in using data to define what success looks like, and track it throughout the project lifecycle.
This presentation will look at the ways LateRooms.com collects, analyses and uses data to better define the problem space, setup up KPI driven Critical Success Factors and present Benefits Realisation.
This document provides a beginner's guide to understanding web analytics. It discusses defining business objectives and key performance indicators to measure according to the business model. It recommends choosing 2 metrics each for acquisition, behavior, and outcomes for owned and rented digital properties, for a total of 24 metrics. Frameworks from Avinash Kaushik and Eric Peterson are presented for determining which metrics to track. General advice includes starting small and focusing on actionable analysis over perfecting data. Common web analytics tools are also mentioned.
Learning Analytics Primer: Getting Started with Learning and Performance Anal...Watershed
Navigating the scope of disruptive analytics solutions to deliver maximum impact. Learn more about the importance of scalable learning in organizations that want to embrace an environment of continuous improvement. Mike Rustici provides a workshop on the five steps to get started with learning and performance analytics. Ranging from gathering your data using methods like experience API, to setting metrics and evaluating impact of learning programs.
Executives are still waiting on our “Big Data Deep Insights”. Many of us are down the path of collecting, extracting, and analyzing our ever-growing data in Hadoop environments. We are building our data science expertise and expanding data governance. Yet still we are not getting what we are waiting for.This talk is about:
1. Getting to the right questions
2. Setting expectations with the executive team
3. The unintentional consequence of suddenly having lots of data
4. Framing the boundaries of our data science
5. Pragmatic data governance
6. Looking outside your data to 3rd party data
An overview of the quantitative and qualitative data provided by live chat, and how to measure the sales, marketing, and customer support ROI of a chat widget.
Converge 2014: BREAKOUT SESSION 2B (DAVIDSON)
Digital Analytics - Getting Leadership Buy-in
SHELBY THAYER
Everyone knows that digital analytics can help optimize websites and show the effectiveness of marketing campaigns. To do this efficiently and effectively takes resources—time, money, and people—but, more often than not, we just can't seem to make the case to get those resources. So, how do we get leadership buy-in?
KEY TAKEAWAYS:
Know when to ask for resources
Tell stories with their data
Get leadership buy-in to get the resources they need
The document provides guidance on best practices for creating online surveys. It recommends that surveys have a clear objective, be short (under 10 minutes), use closed-ended questions for easy analysis of results, ask one question per topic, avoid biased or ambiguous wording, have a logical flow of questions, and be tested before widespread distribution. The document also provides tips on question order, required fields, and avoiding mutually exclusive answers. The overall aim is to collect useful data from respondents in the most efficient and effective way possible.
The document discusses using Tableau to drive insights that lead to strategic and operational changes. It emphasizes that insights are more memorable and engaging than linear solutions and can drive systemic change by changing how people think. The document provides guidance on tailoring insights for executives versus operations, focusing on different types of questions, levels of detail, and timeframes. It also outlines design principles for facilitating insights, including showing comparisons, causality, multivariate data, and integrating evidence. The key takeaways are to identify stakeholder goals and questions, relate questions to goals, create dashboards presenting insights as opportunities, and simplify visualizations.
An overview of Google Analytics from setup and installation to terminology, campaign tagging, and how to use Google Analytics to answer business questions such as who your visitors are and what they're doing on your site.
How to Start Thinking Like a Data ScientistTanayKarnik1
This document summarizes steps for thinking like a data scientist, including posing questions, collecting relevant data, analyzing the data through visualizations and statistics, interpreting the results, and communicating conclusions. It emphasizes that data literacy is important for business managers to effectively collaborate with data scientists and uncover metrics to improve performance. The process of thinking with a data-driven mindset will help managers in India stay competitive as data becomes more integral to decision making across industries.
Similar to Data-Driven Requirements for User-Stories on JustAnswer (20)
Maruthi Prithivirajan, Head of ASEAN & IN Solution Architecture, Neo4j
Get an inside look at the latest Neo4j innovations that enable relationship-driven intelligence at scale. Learn more about the newest cloud integrations and product enhancements that make Neo4j an essential choice for developers building apps with interconnected data and generative AI.
“An Outlook of the Ongoing and Future Relationship between Blockchain Technologies and Process-aware Information Systems.” Invited talk at the joint workshop on Blockchain for Information Systems (BC4IS) and Blockchain for Trusted Data Sharing (B4TDS), co-located with with the 36th International Conference on Advanced Information Systems Engineering (CAiSE), 3 June 2024, Limassol, Cyprus.
Climate Impact of Software Testing at Nordic Testing DaysKari Kakkonen
My slides at Nordic Testing Days 6.6.2024
Climate impact / sustainability of software testing discussed on the talk. ICT and testing must carry their part of global responsibility to help with the climat warming. We can minimize the carbon footprint but we can also have a carbon handprint, a positive impact on the climate. Quality characteristics can be added with sustainability, and then measured continuously. Test environments can be used less, and in smaller scale and on demand. Test techniques can be used in optimizing or minimizing number of tests. Test automation can be used to speed up testing.
Removing Uninteresting Bytes in Software FuzzingAftab Hussain
Imagine a world where software fuzzing, the process of mutating bytes in test seeds to uncover hidden and erroneous program behaviors, becomes faster and more effective. A lot depends on the initial seeds, which can significantly dictate the trajectory of a fuzzing campaign, particularly in terms of how long it takes to uncover interesting behaviour in your code. We introduce DIAR, a technique designed to speedup fuzzing campaigns by pinpointing and eliminating those uninteresting bytes in the seeds. Picture this: instead of wasting valuable resources on meaningless mutations in large, bloated seeds, DIAR removes the unnecessary bytes, streamlining the entire process.
In this work, we equipped AFL, a popular fuzzer, with DIAR and examined two critical Linux libraries -- Libxml's xmllint, a tool for parsing xml documents, and Binutil's readelf, an essential debugging and security analysis command-line tool used to display detailed information about ELF (Executable and Linkable Format). Our preliminary results show that AFL+DIAR does not only discover new paths more quickly but also achieves higher coverage overall. This work thus showcases how starting with lean and optimized seeds can lead to faster, more comprehensive fuzzing campaigns -- and DIAR helps you find such seeds.
- These are slides of the talk given at IEEE International Conference on Software Testing Verification and Validation Workshop, ICSTW 2022.
Introducing Milvus Lite: Easy-to-Install, Easy-to-Use vector database for you...Zilliz
Join us to introduce Milvus Lite, a vector database that can run on notebooks and laptops, share the same API with Milvus, and integrate with every popular GenAI framework. This webinar is perfect for developers seeking easy-to-use, well-integrated vector databases for their GenAI apps.
Unlocking Productivity: Leveraging the Potential of Copilot in Microsoft 365, a presentation by Christoforos Vlachos, Senior Solutions Manager – Modern Workplace, Uni Systems
Observability Concepts EVERY Developer Should Know -- DeveloperWeek Europe.pdfPaige Cruz
Monitoring and observability aren’t traditionally found in software curriculums and many of us cobble this knowledge together from whatever vendor or ecosystem we were first introduced to and whatever is a part of your current company’s observability stack.
While the dev and ops silo continues to crumble….many organizations still relegate monitoring & observability as the purview of ops, infra and SRE teams. This is a mistake - achieving a highly observable system requires collaboration up and down the stack.
I, a former op, would like to extend an invitation to all application developers to join the observability party will share these foundational concepts to build on:
Securing your Kubernetes cluster_ a step-by-step guide to success !KatiaHIMEUR1
Today, after several years of existence, an extremely active community and an ultra-dynamic ecosystem, Kubernetes has established itself as the de facto standard in container orchestration. Thanks to a wide range of managed services, it has never been so easy to set up a ready-to-use Kubernetes cluster.
However, this ease of use means that the subject of security in Kubernetes is often left for later, or even neglected. This exposes companies to significant risks.
In this talk, I'll show you step-by-step how to secure your Kubernetes cluster for greater peace of mind and reliability.
Pushing the limits of ePRTC: 100ns holdover for 100 daysAdtran
At WSTS 2024, Alon Stern explored the topic of parametric holdover and explained how recent research findings can be implemented in real-world PNT networks to achieve 100 nanoseconds of accuracy for up to 100 days.
Alt. GDG Cloud Southlake #33: Boule & Rebala: Effective AppSec in SDLC using ...James Anderson
Effective Application Security in Software Delivery lifecycle using Deployment Firewall and DBOM
The modern software delivery process (or the CI/CD process) includes many tools, distributed teams, open-source code, and cloud platforms. Constant focus on speed to release software to market, along with the traditional slow and manual security checks has caused gaps in continuous security as an important piece in the software supply chain. Today organizations feel more susceptible to external and internal cyber threats due to the vast attack surface in their applications supply chain and the lack of end-to-end governance and risk management.
The software team must secure its software delivery process to avoid vulnerability and security breaches. This needs to be achieved with existing tool chains and without extensive rework of the delivery processes. This talk will present strategies and techniques for providing visibility into the true risk of the existing vulnerabilities, preventing the introduction of security issues in the software, resolving vulnerabilities in production environments quickly, and capturing the deployment bill of materials (DBOM).
Speakers:
Bob Boule
Robert Boule is a technology enthusiast with PASSION for technology and making things work along with a knack for helping others understand how things work. He comes with around 20 years of solution engineering experience in application security, software continuous delivery, and SaaS platforms. He is known for his dynamic presentations in CI/CD and application security integrated in software delivery lifecycle.
Gopinath Rebala
Gopinath Rebala is the CTO of OpsMx, where he has overall responsibility for the machine learning and data processing architectures for Secure Software Delivery. Gopi also has a strong connection with our customers, leading design and architecture for strategic implementations. Gopi is a frequent speaker and well-known leader in continuous delivery and integrating security into software delivery.
Goodbye Windows 11: Make Way for Nitrux Linux 3.5.0!SOFTTECHHUB
As the digital landscape continually evolves, operating systems play a critical role in shaping user experiences and productivity. The launch of Nitrux Linux 3.5.0 marks a significant milestone, offering a robust alternative to traditional systems such as Windows 11. This article delves into the essence of Nitrux Linux 3.5.0, exploring its unique features, advantages, and how it stands as a compelling choice for both casual users and tech enthusiasts.
A tale of scale & speed: How the US Navy is enabling software delivery from l...sonjaschweigert1
Rapid and secure feature delivery is a goal across every application team and every branch of the DoD. The Navy’s DevSecOps platform, Party Barge, has achieved:
- Reduction in onboarding time from 5 weeks to 1 day
- Improved developer experience and productivity through actionable findings and reduction of false positives
- Maintenance of superior security standards and inherent policy enforcement with Authorization to Operate (ATO)
Development teams can ship efficiently and ensure applications are cyber ready for Navy Authorizing Officials (AOs). In this webinar, Sigma Defense and Anchore will give attendees a look behind the scenes and demo secure pipeline automation and security artifacts that speed up application ATO and time to production.
We will cover:
- How to remove silos in DevSecOps
- How to build efficient development pipeline roles and component templates
- How to deliver security artifacts that matter for ATO’s (SBOMs, vulnerability reports, and policy evidence)
- How to streamline operations with automated policy checks on container images
Encryption in Microsoft 365 - ExpertsLive Netherlands 2024Albert Hoitingh
In this session I delve into the encryption technology used in Microsoft 365 and Microsoft Purview. Including the concepts of Customer Key and Double Key Encryption.
GraphSummit Singapore | The Future of Agility: Supercharging Digital Transfor...Neo4j
Leonard Jayamohan, Partner & Generative AI Lead, Deloitte
This keynote will reveal how Deloitte leverages Neo4j’s graph power for groundbreaking digital twin solutions, achieving a staggering 100x performance boost. Discover the essential role knowledge graphs play in successful generative AI implementations. Plus, get an exclusive look at an innovative Neo4j + Generative AI solution Deloitte is developing in-house.
Cosa hanno in comune un mattoncino Lego e la backdoor XZ?Speck&Tech
ABSTRACT: A prima vista, un mattoncino Lego e la backdoor XZ potrebbero avere in comune il fatto di essere entrambi blocchi di costruzione, o dipendenze di progetti creativi e software. La realtà è che un mattoncino Lego e il caso della backdoor XZ hanno molto di più di tutto ciò in comune.
Partecipate alla presentazione per immergervi in una storia di interoperabilità, standard e formati aperti, per poi discutere del ruolo importante che i contributori hanno in una comunità open source sostenibile.
BIO: Sostenitrice del software libero e dei formati standard e aperti. È stata un membro attivo dei progetti Fedora e openSUSE e ha co-fondato l'Associazione LibreItalia dove è stata coinvolta in diversi eventi, migrazioni e formazione relativi a LibreOffice. In precedenza ha lavorato a migrazioni e corsi di formazione su LibreOffice per diverse amministrazioni pubbliche e privati. Da gennaio 2020 lavora in SUSE come Software Release Engineer per Uyuni e SUSE Manager e quando non segue la sua passione per i computer e per Geeko coltiva la sua curiosità per l'astronomia (da cui deriva il suo nickname deneb_alpha).
TrustArc Webinar - 2024 Global Privacy SurveyTrustArc
How does your privacy program stack up against your peers? What challenges are privacy teams tackling and prioritizing in 2024?
In the fifth annual Global Privacy Benchmarks Survey, we asked over 1,800 global privacy professionals and business executives to share their perspectives on the current state of privacy inside and outside of their organizations. This year’s report focused on emerging areas of importance for privacy and compliance professionals, including considerations and implications of Artificial Intelligence (AI) technologies, building brand trust, and different approaches for achieving higher privacy competence scores.
See how organizational priorities and strategic approaches to data security and privacy are evolving around the globe.
This webinar will review:
- The top 10 privacy insights from the fifth annual Global Privacy Benchmarks Survey
- The top challenges for privacy leaders, practitioners, and organizations in 2024
- Key themes to consider in developing and maintaining your privacy program
Data-Driven Requirements for User-Stories on JustAnswer
1. JustAnswer | Ask a question get an answer ASAP
Data-Driven
User
Stories
VLAD MYSLA
2. Data collection is the process of
gathering and measuring information
on variables of interest, in an
established systematic fashion that
enables one to answer stated research
questions, test hypotheses, and
evaluate outcomes.
JustAnswer | Ask a question get an answer ASAP
Five W’s
1
Who
What
Where
When
Why
Regardless of the field of study or
preference for defining data
(quantitative, qualitative), accurate
data collection is essential to
maintaining the integrity of research.
3. JustAnswer | Ask a question get an answer ASAP
Hypothesis to User Stories
2
Who is your target audience?
What
Where
When
Why
MOST LIKELY
- SEO
- Mobile
- Subscribers
4. JustAnswer | Ask a question get an answer ASAP
Hypothesis to User Stories
3
Who is your target audience?
What you are going to provide?
Where
When
Why
MOST LIKELY
- UX
- Offer
- Speed
5. JustAnswer | Ask a question get an answer ASAP
Hypothesis to User Stories
4
Who is your target audience?
What you are going to provide?
Where this makes sense?
When
Why
MOST LIKELY
- SIP
- Funnel
6. JustAnswer | Ask a question get an answer ASAP
Hypothesis to User Stories
5
Who is your target audience?
What you are going to provide?
Where this makes sense?
When this makes sense?
Why
MOST LIKELY
- Random*
- Close site
- No actions
* - statistical distribution
7. 푛
JustAnswer | Ask a question get an answer ASAP
Hypothesis to User Stories
6
Who is your target audience?
What you are going to provide?
Where this makes sense?
When this makes sense?
Why might this idea work?
MOST LIKELY
Next, think through the data that can help answer your question, and develop a plan for it
the time someone says, “Ok, let’s begin.”? Or the time the real business of the meeting
starts? Does kibitzing count?
While the exercise is very much a how-to, each step also illustrwork, like consistently late-starting
meetings. Whatever it is, form it up as a question and write it down: “Meetings
always seem to start late. Is that really true?”
푥 + 푎 푛 =
푘=0
푛
푘
푥푘푎푛−푘
it the time someone says, “Ok, let’s begin.”? Or
starts? Does kibitzing count?
9. 8
Data-Driven: Acceptance Criteria, Requirements, Definition of Done
Who might be interested in data?
Ops, Stakeholders, CEO, VP, PO, BI, Analytics, Developers, QA
Goals, Conversions, CTAs, Micro-Conversions, Navigation, Measured Activity
Client vs. Server, GA vs. CSRT vs. Event Sentry vs. NCV vs. Pixels
Goals, Metrics, Linked References, Performance, Errors, Tests
JustAnswer | Ask a question get an answer ASAP
What data should we collect?
Where data should be sent?
When it is enough data?
Why validate collected data?
Referenced API or Data might be broken, same as your code.. after somebody has changed it
10. Data collection: Google Analytics and Big Data
JustAnswer | Ask a question get an answer ASAP
GA
Premium Universal Google
Analytics
Big Data
In-house Hadoop
Data Base
Back-End API Measurement Protocol Outcome Events
Front-End API YES YES
Navigation Tracking YES YES
Event Tracking YES YES
Standard Reports Yes Yes
Custom Reports Yes By Request
SQL Queries Big Query YES
9
11. Su-Ha-Ri for Data: Su - discuss, validate, validate, repeat
JustAnswer | Ask a question get an answer ASAP
Use
Vocabulary
• Do not call
same things
differently
• Do not use
same term for
different things
Introduce
monitoring
• Integration
and Unit Tests
• Reports
• Alerts
Keep it
Raw
• Avoid
changing
original data
if it is collected
• Avoid data
changes after
it was saved
Include
References
• Avoid
duplicated
data collection
• Collect data
with references
on relevant
objects
10
1 2 3 4
12. Data-Driven: Questions you should always ask
11
client vs. server, redis vs. sql vs. solr, javascript vs. cookies vs. url vs. session
guest user can’t have subscriptions, cached page might contain wrong data
JustAnswer | Ask a question get an answer ASAP
Who owns the data?
“Who Owns What”, skype Chats, email BI team
What the data does or means?
real life vs. implemented data models vs. your vision
Where it is located?
When it should be used?
Why it is used that way?
hacks, assumptions and curious solutions vs. simple usage in general way