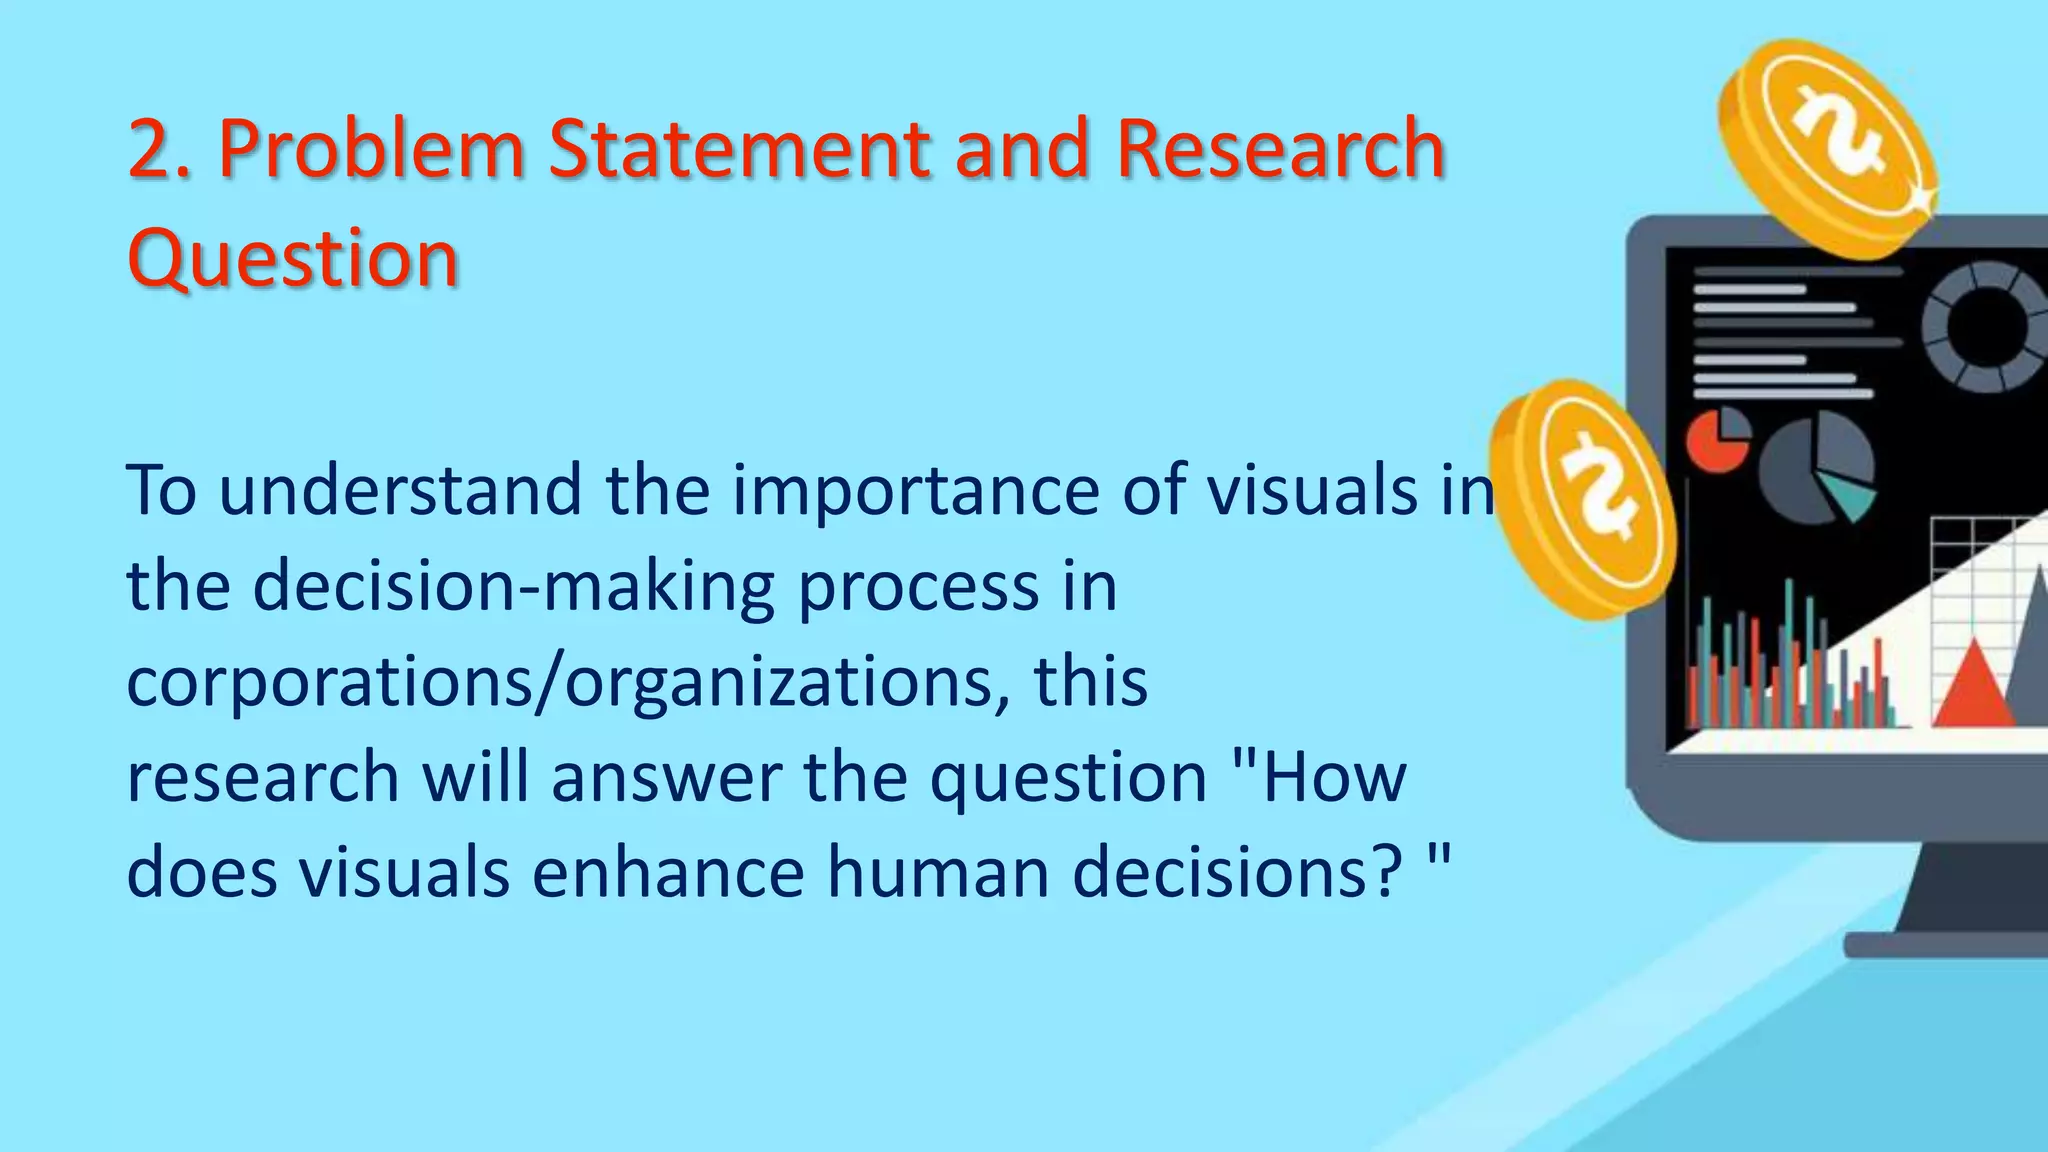
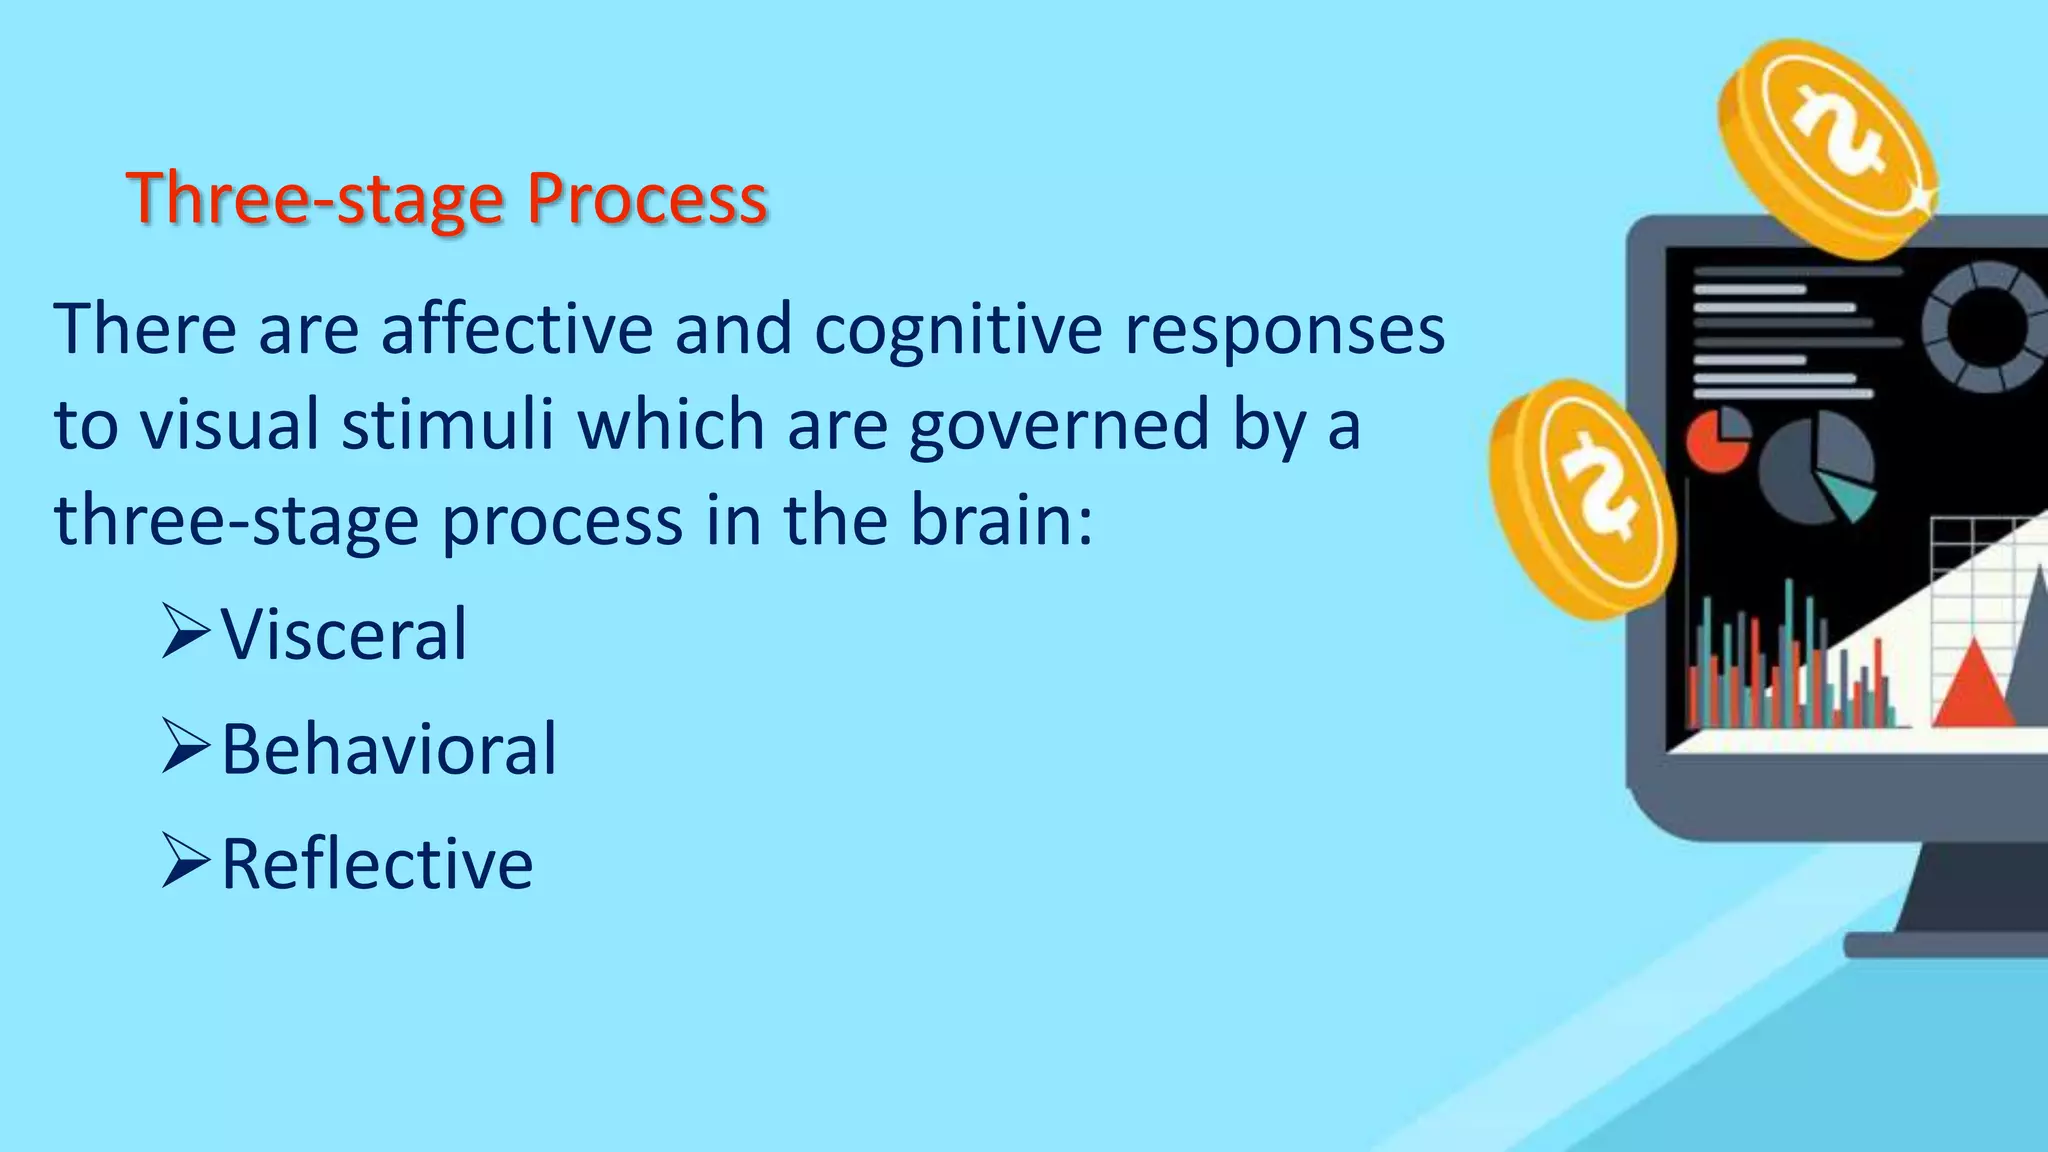
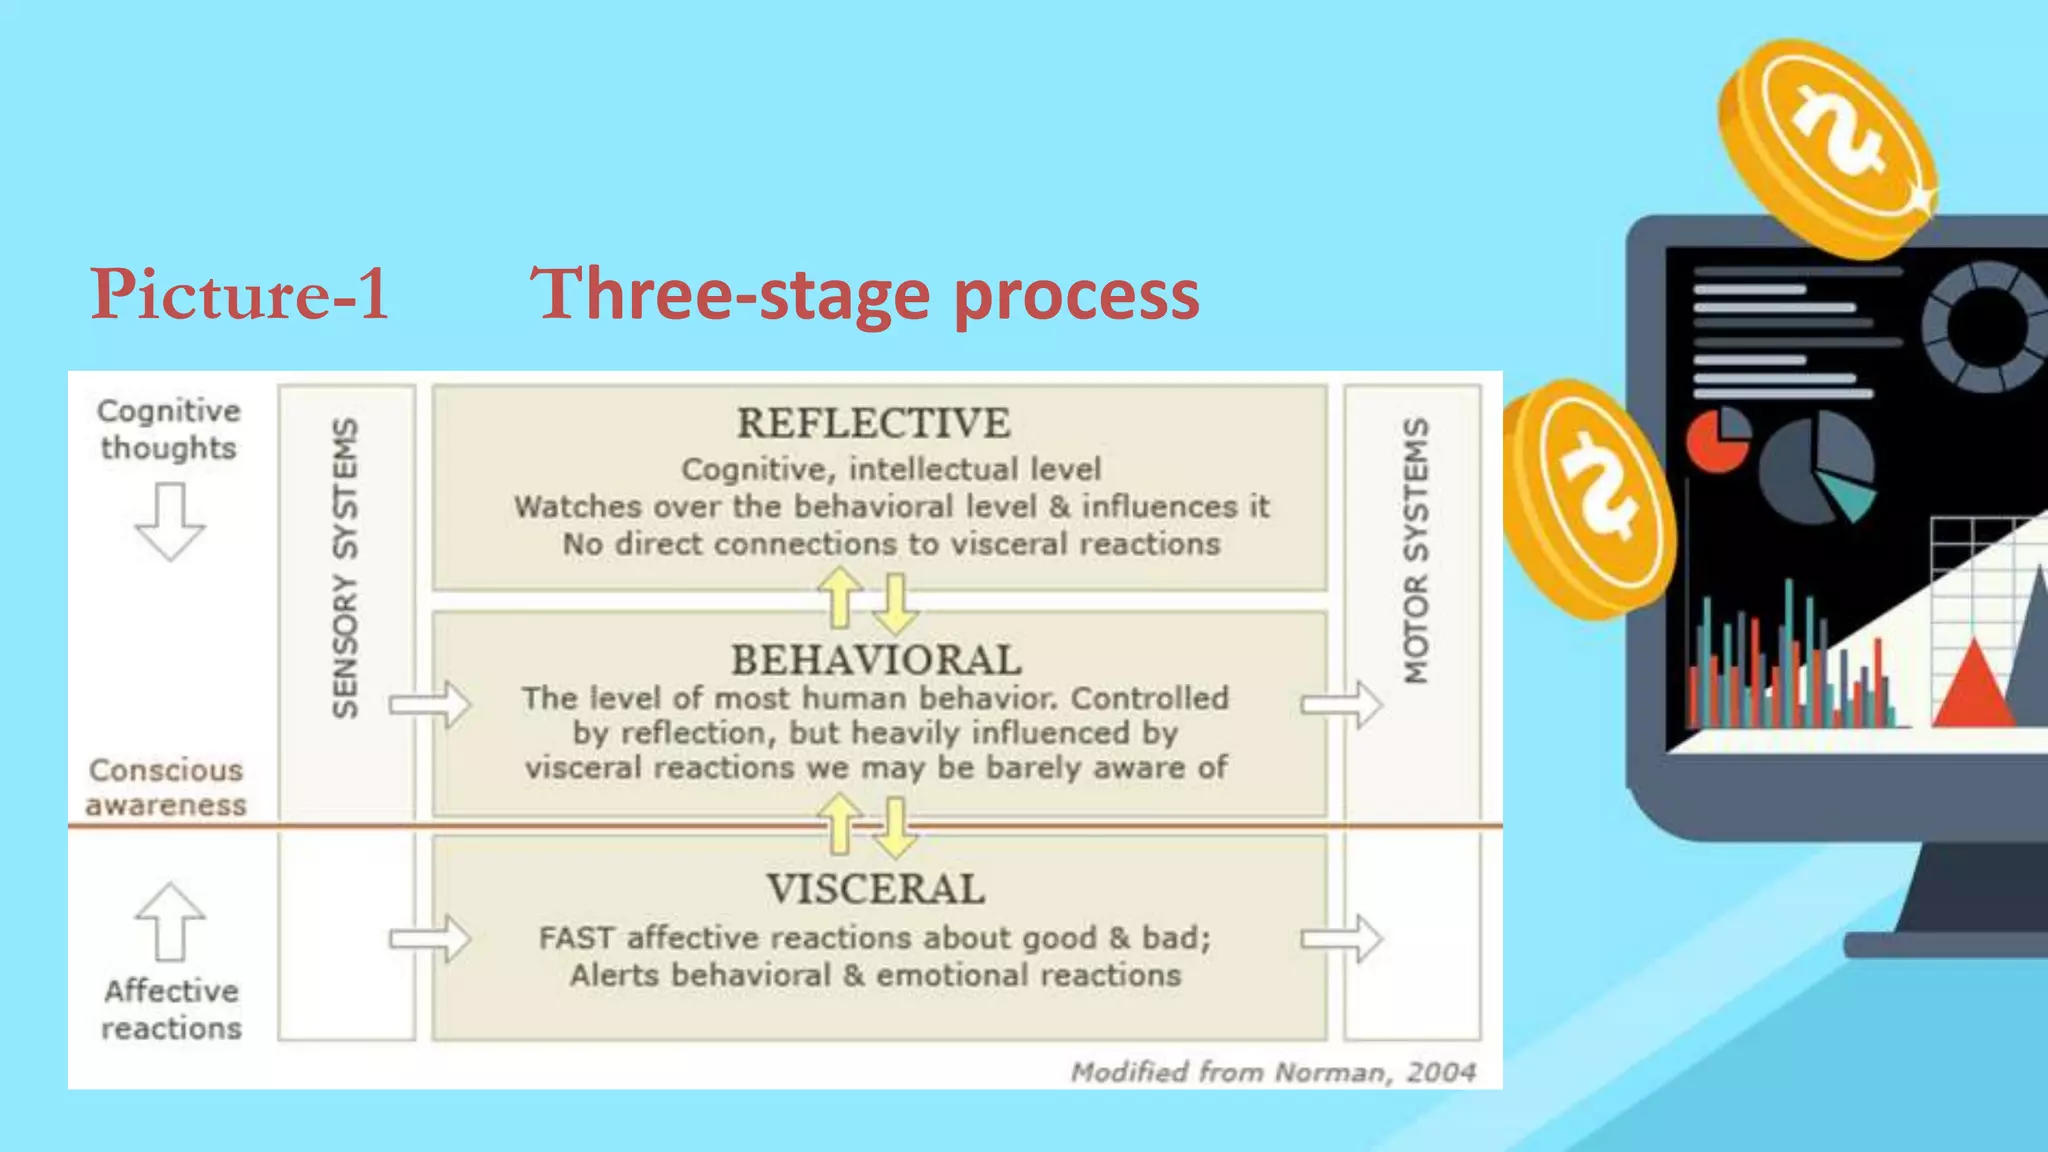
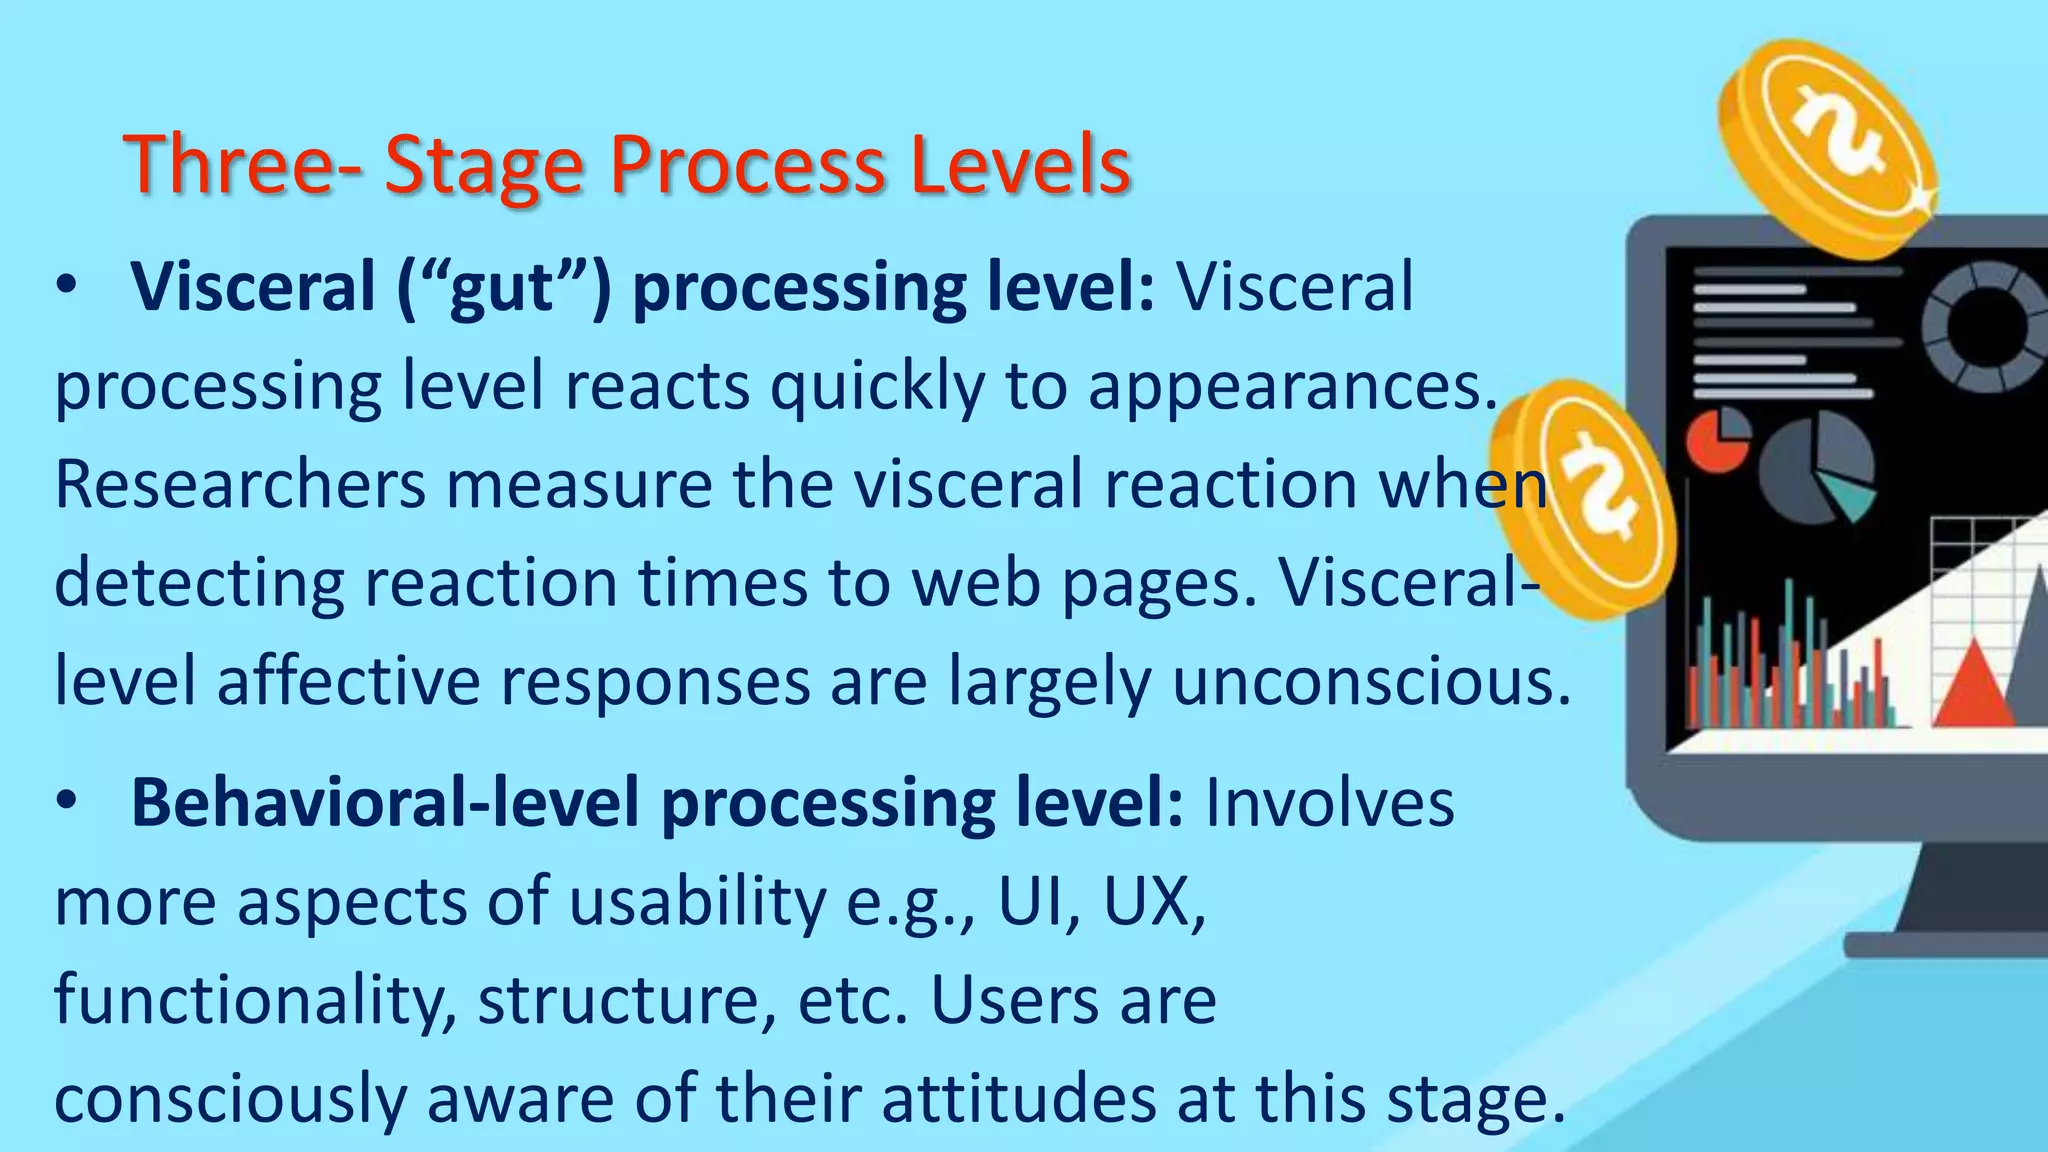
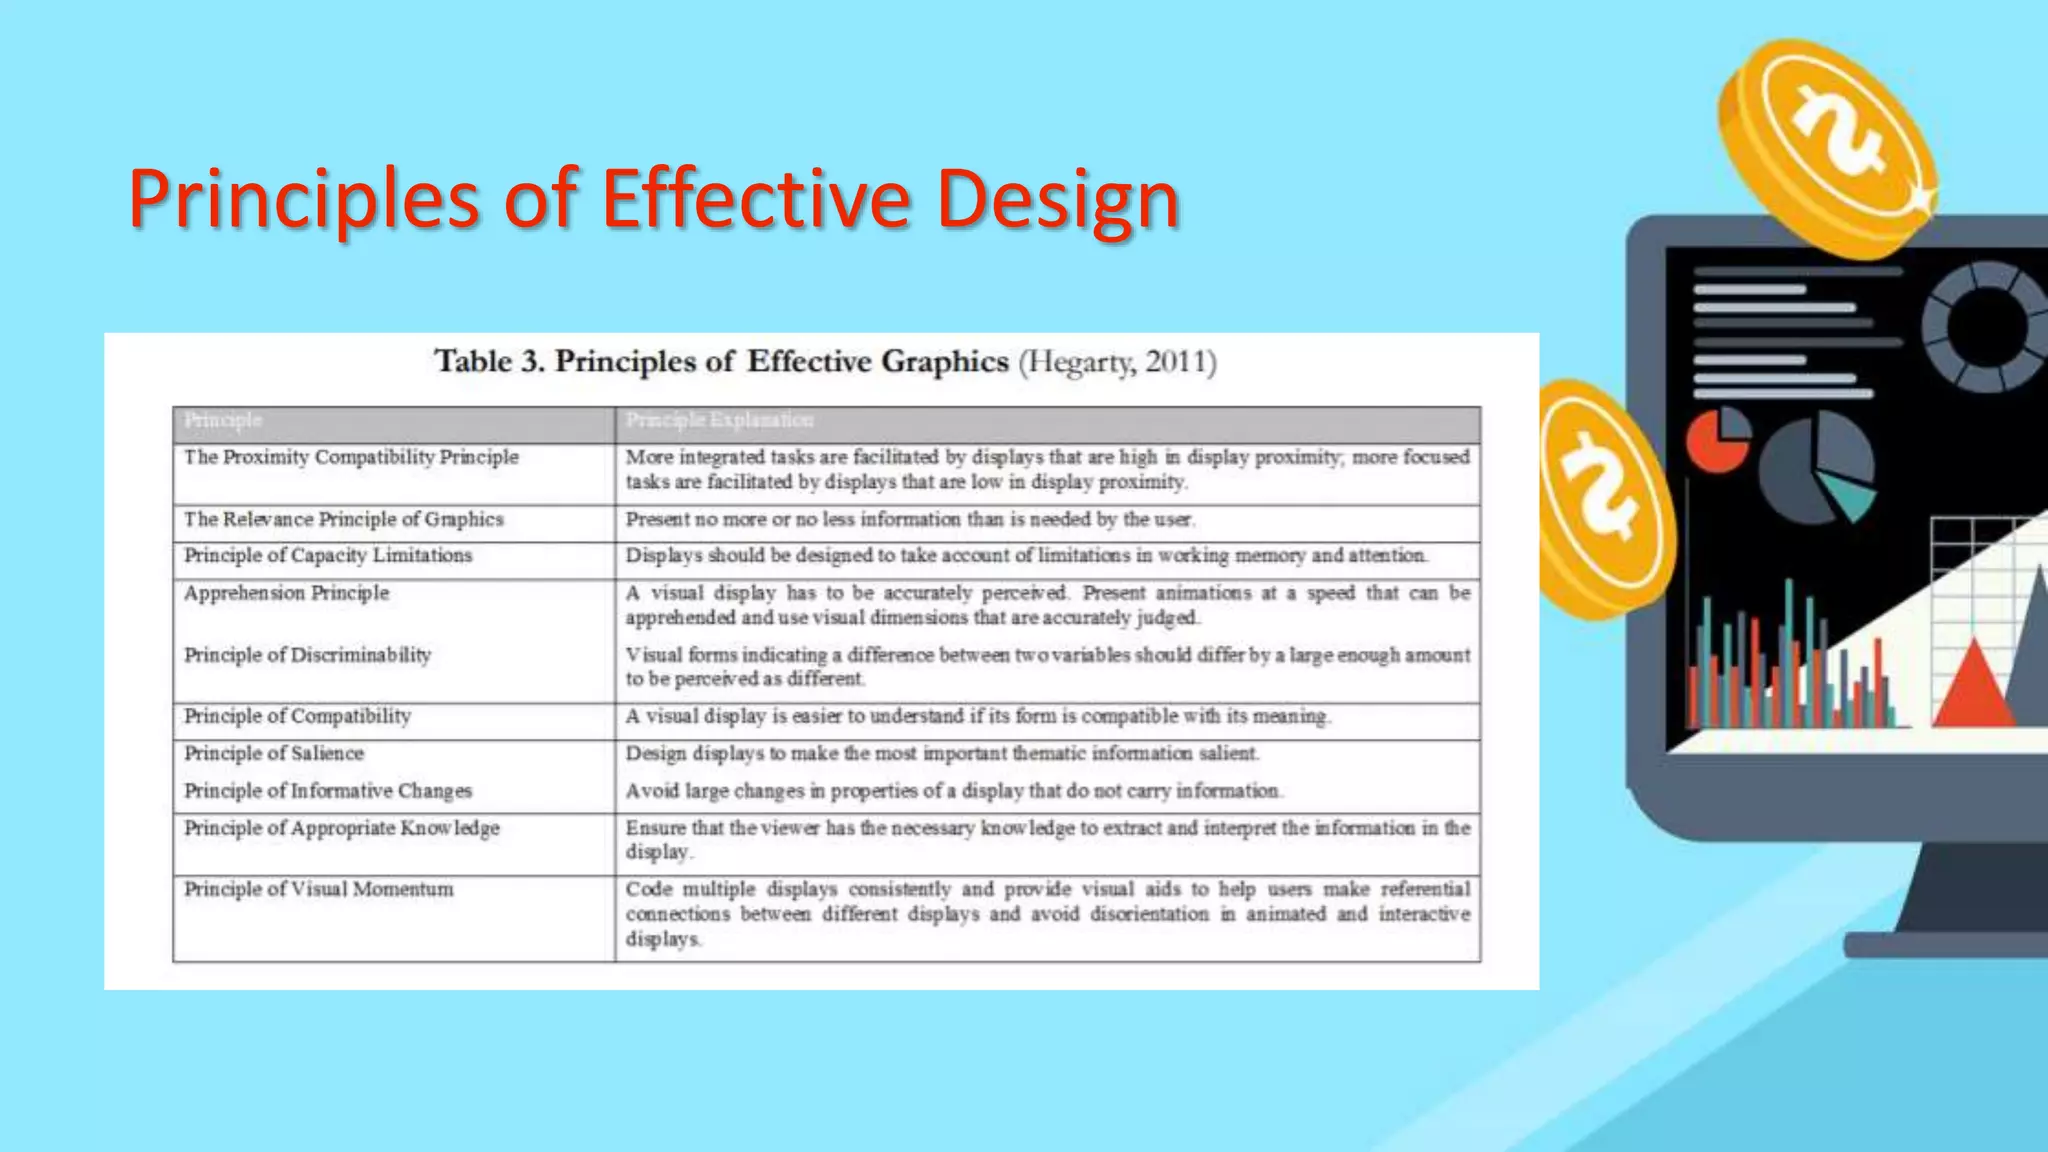
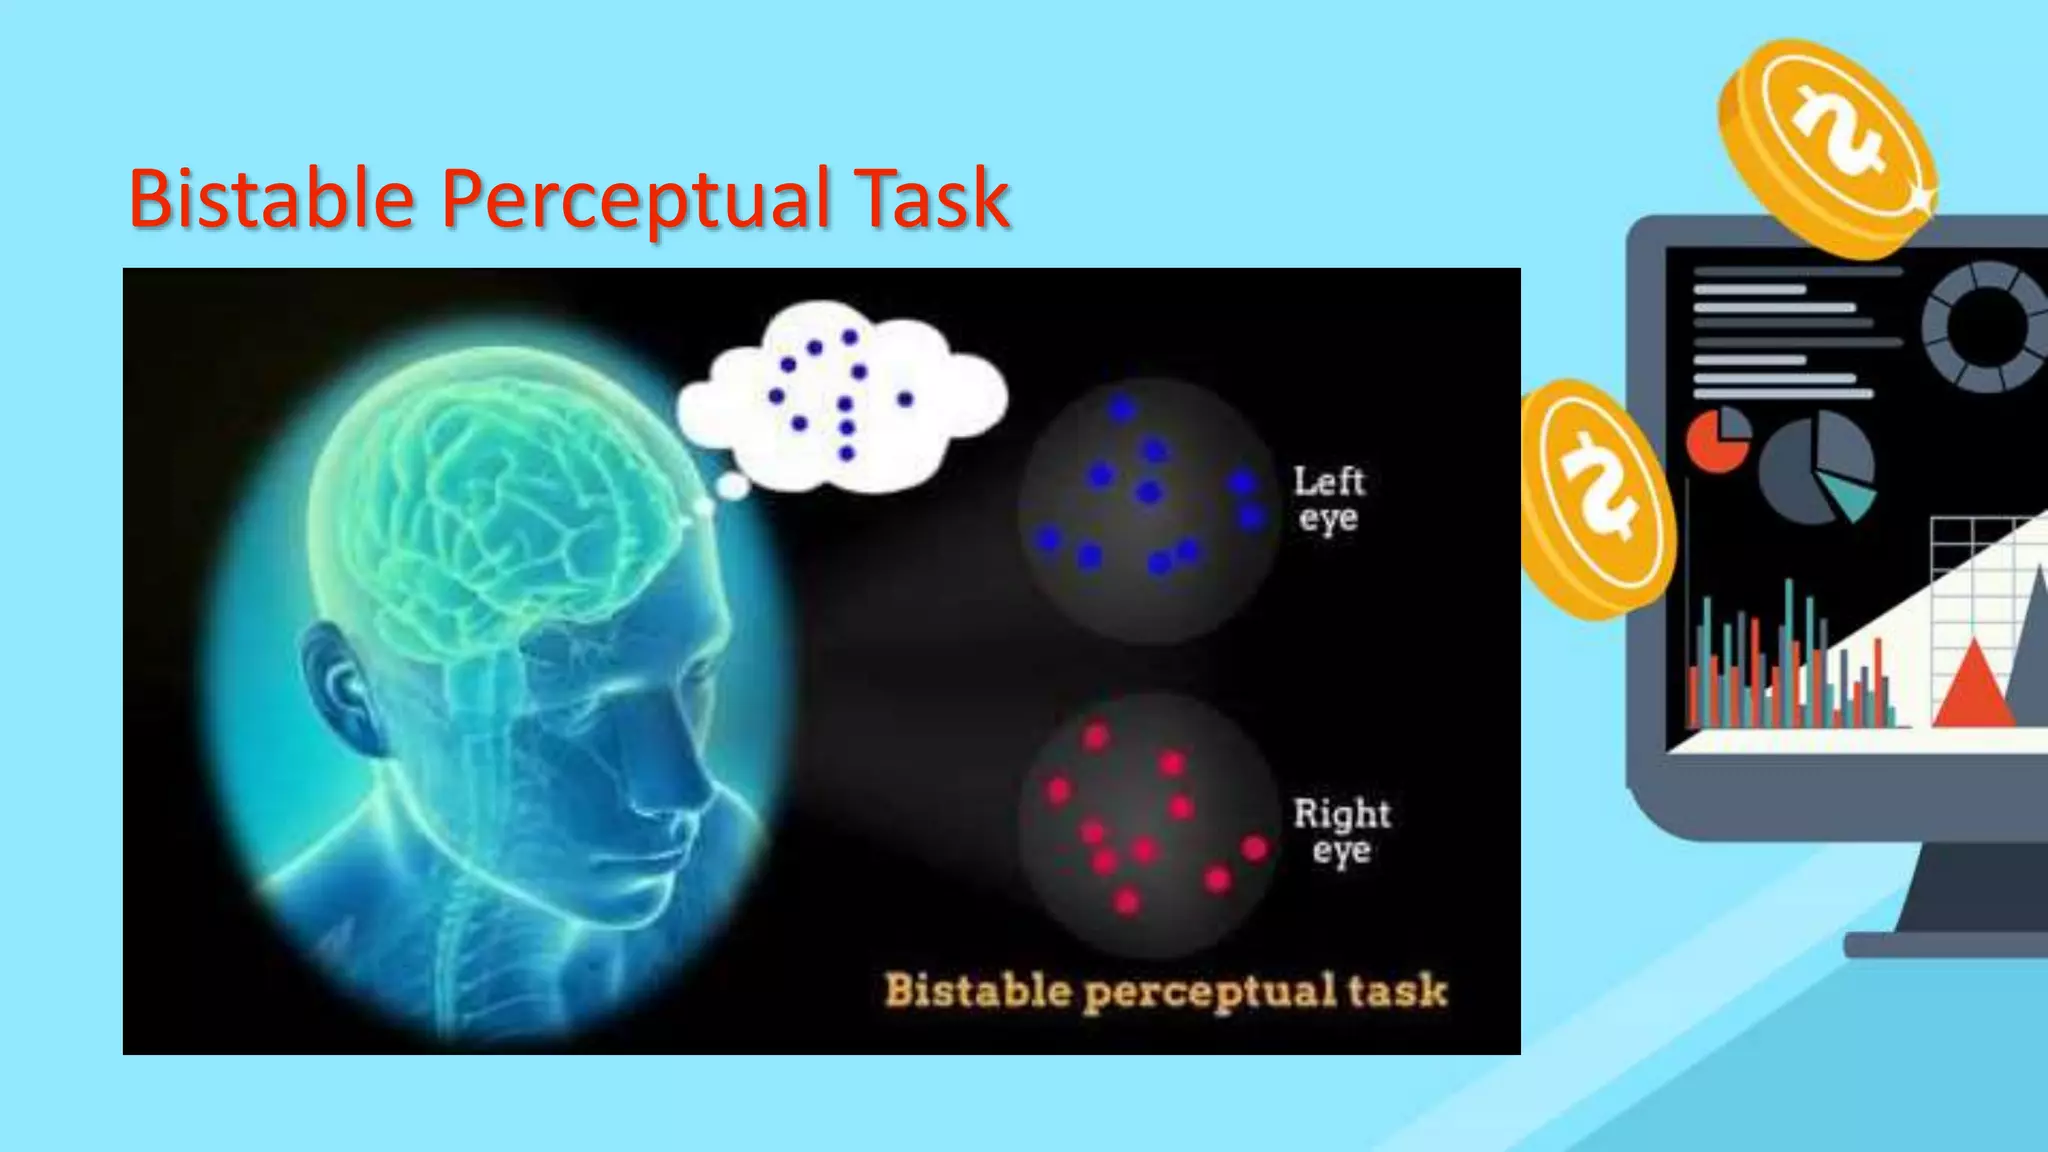
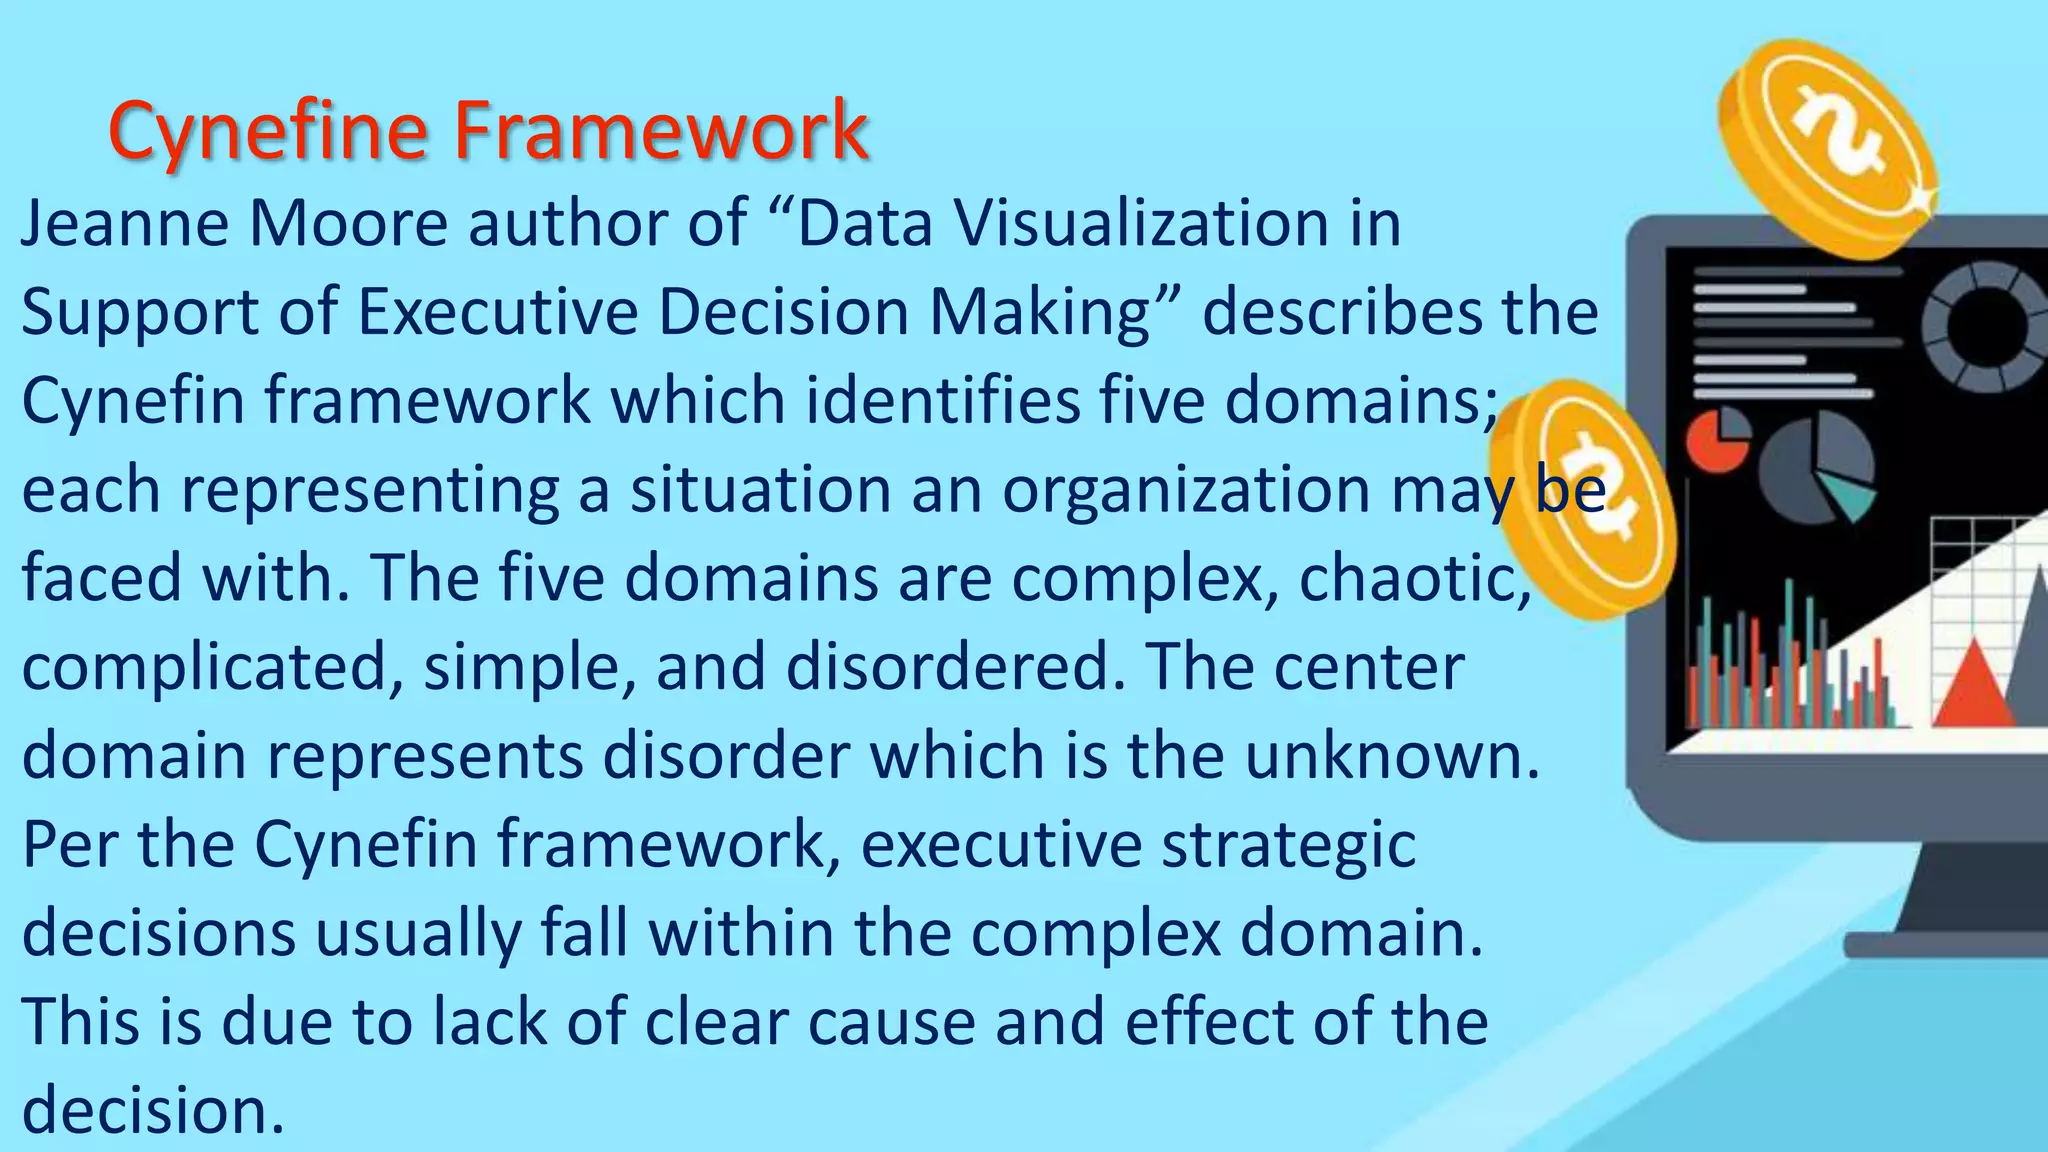
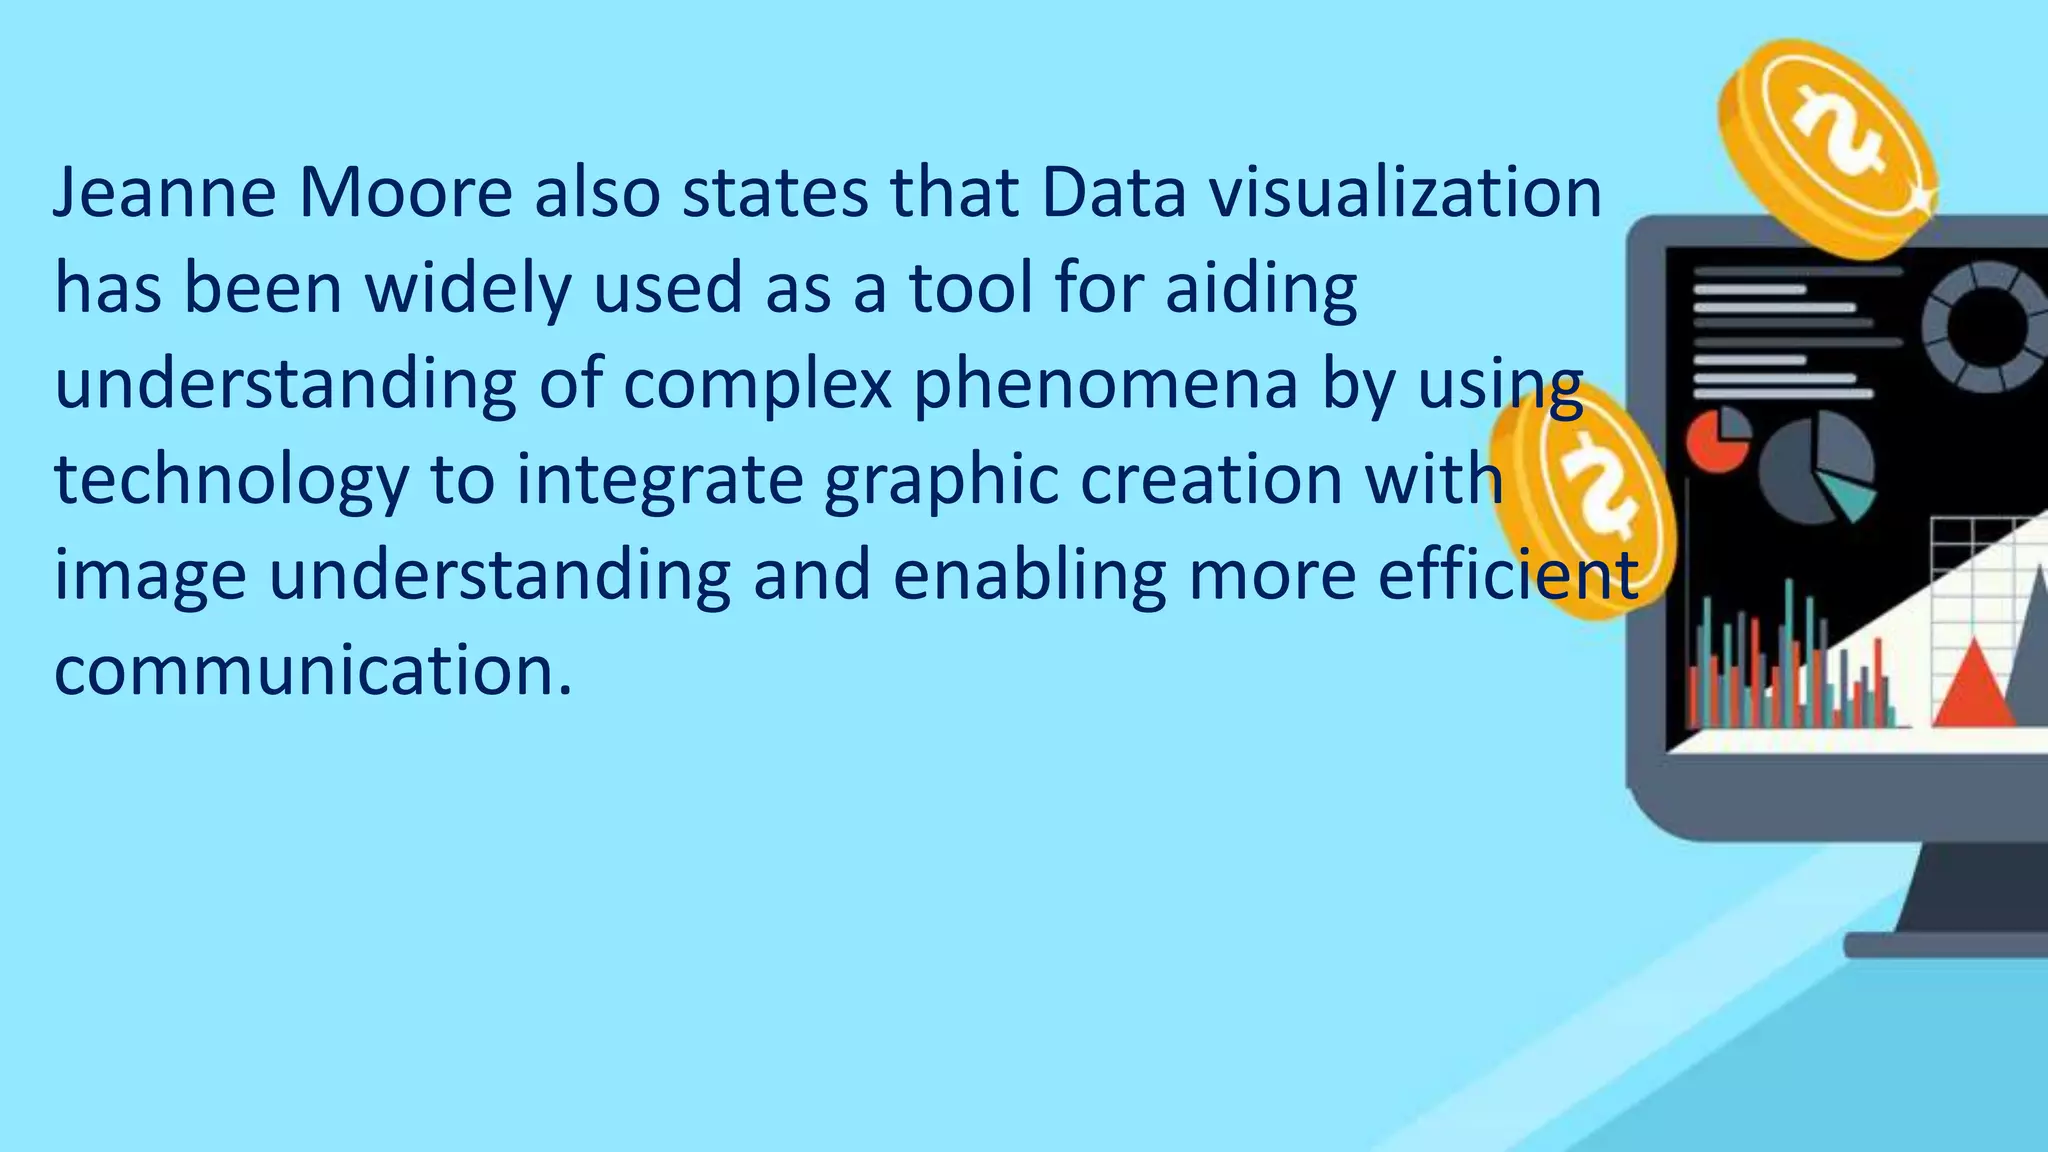
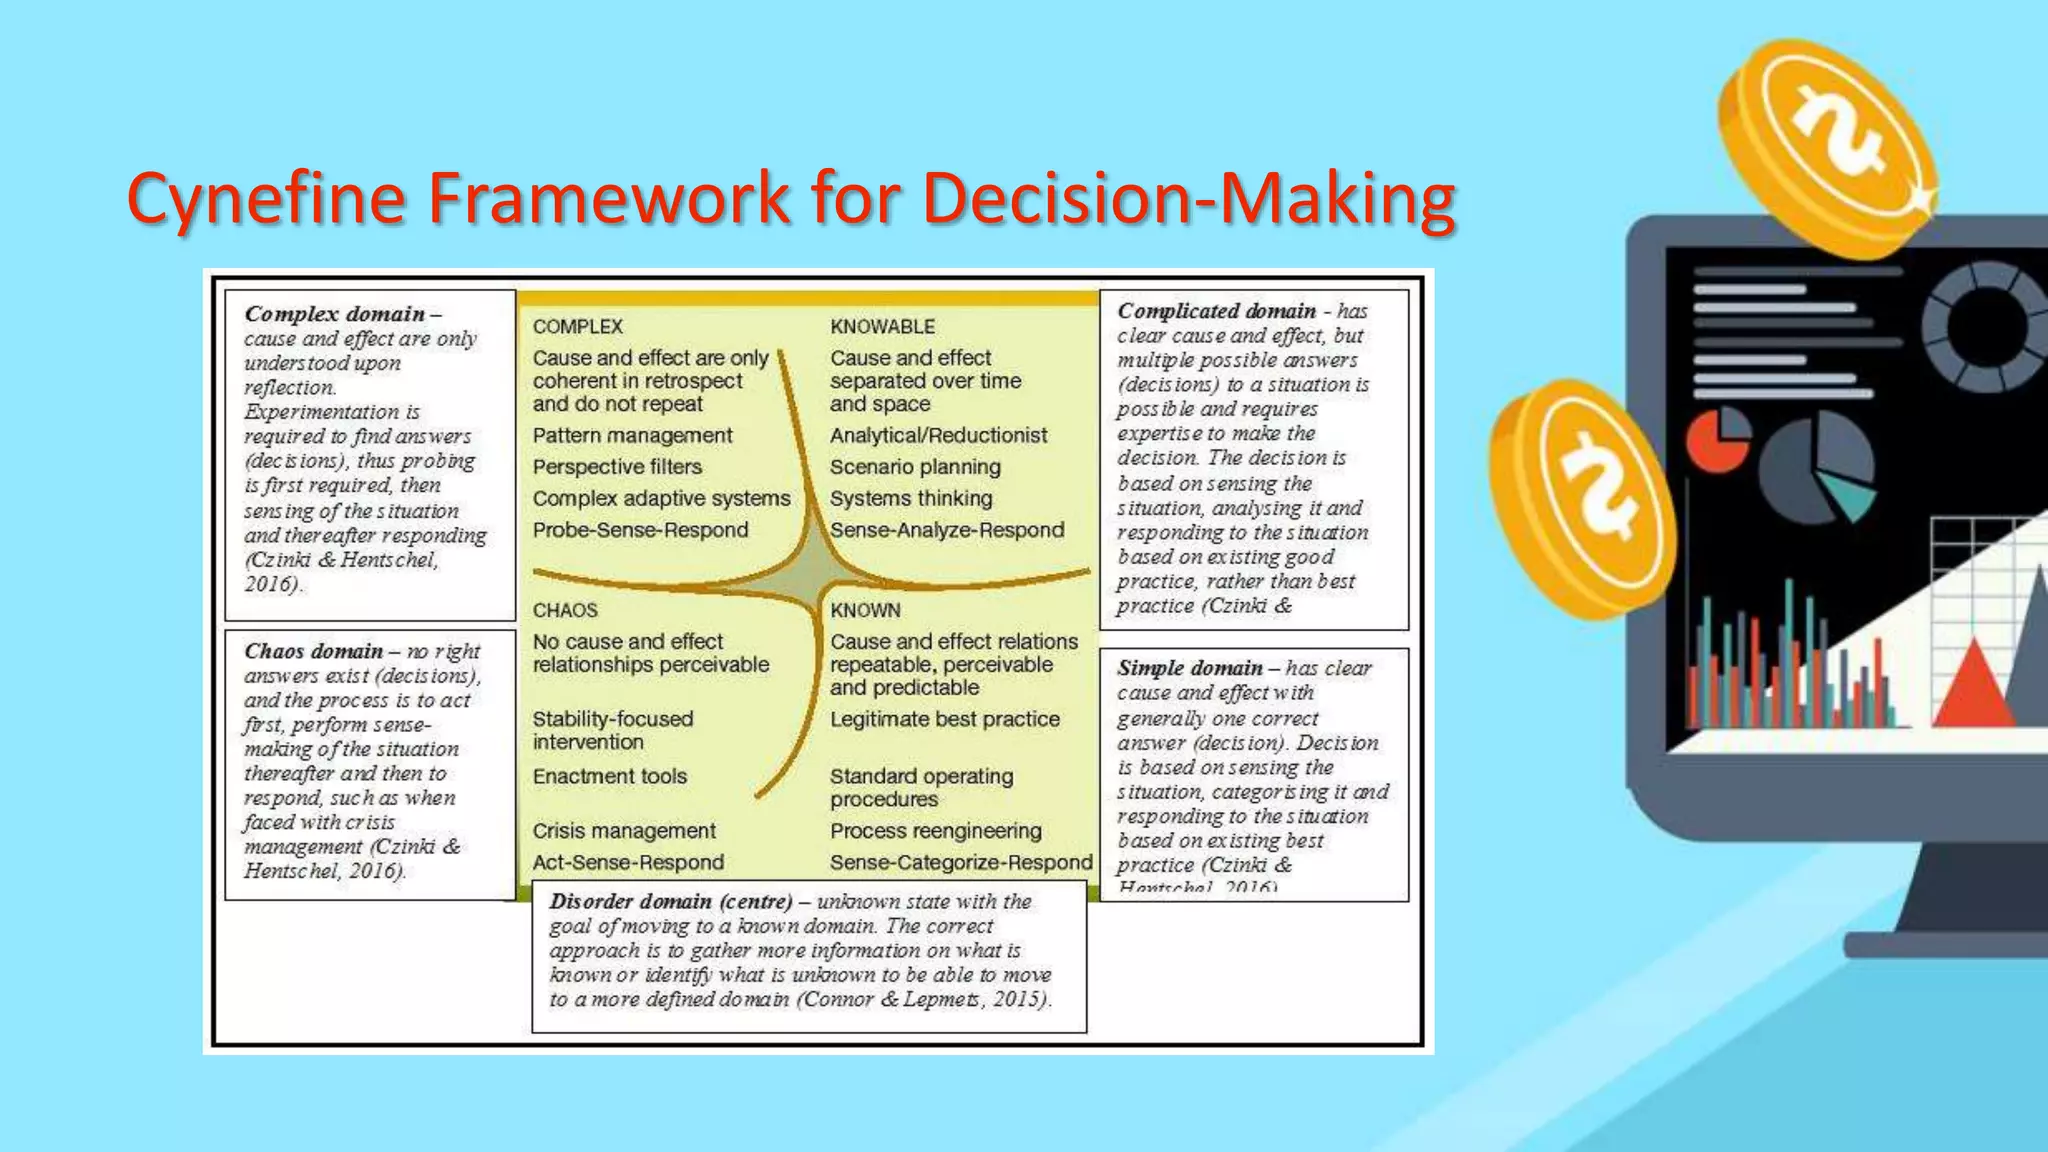
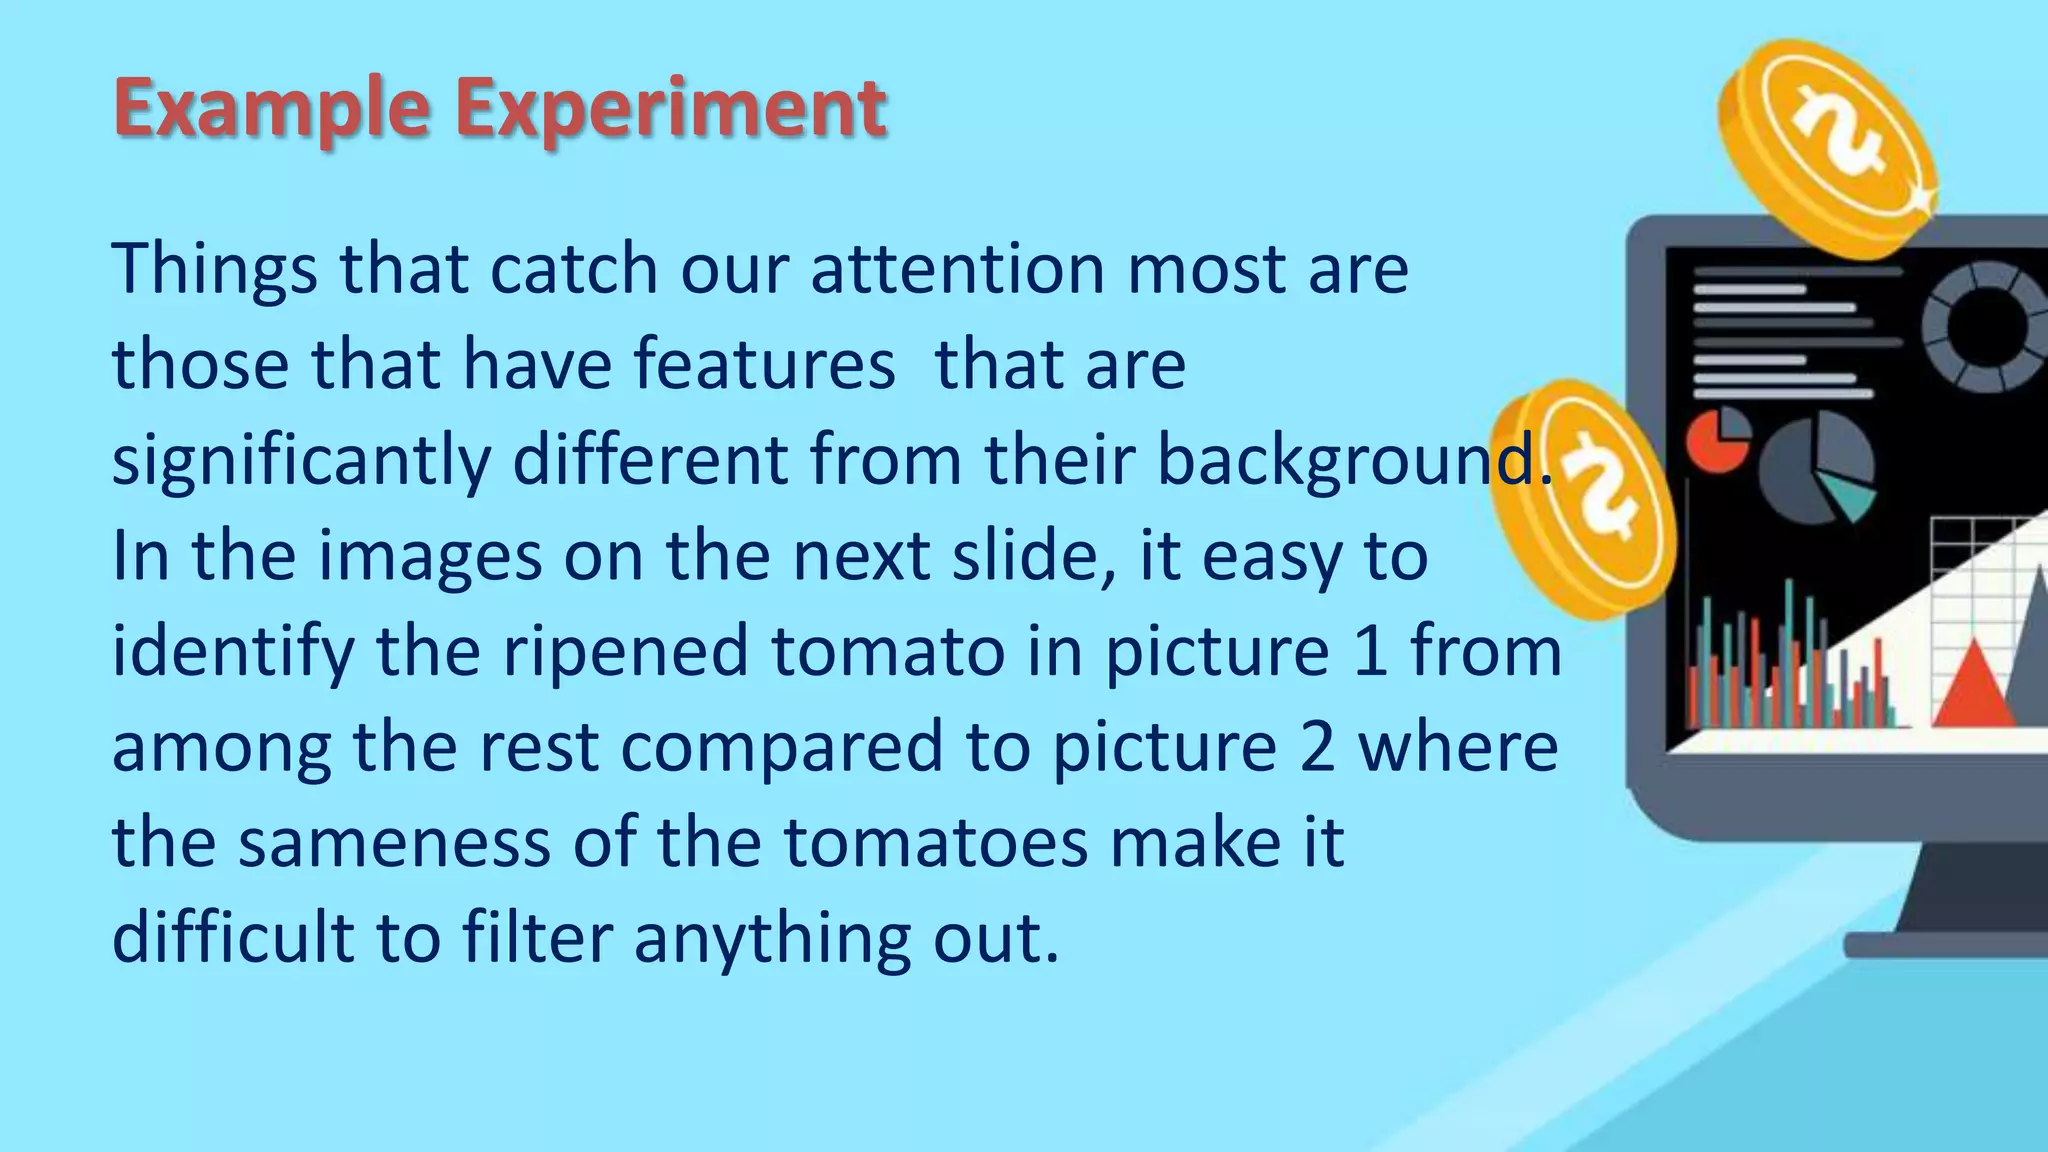
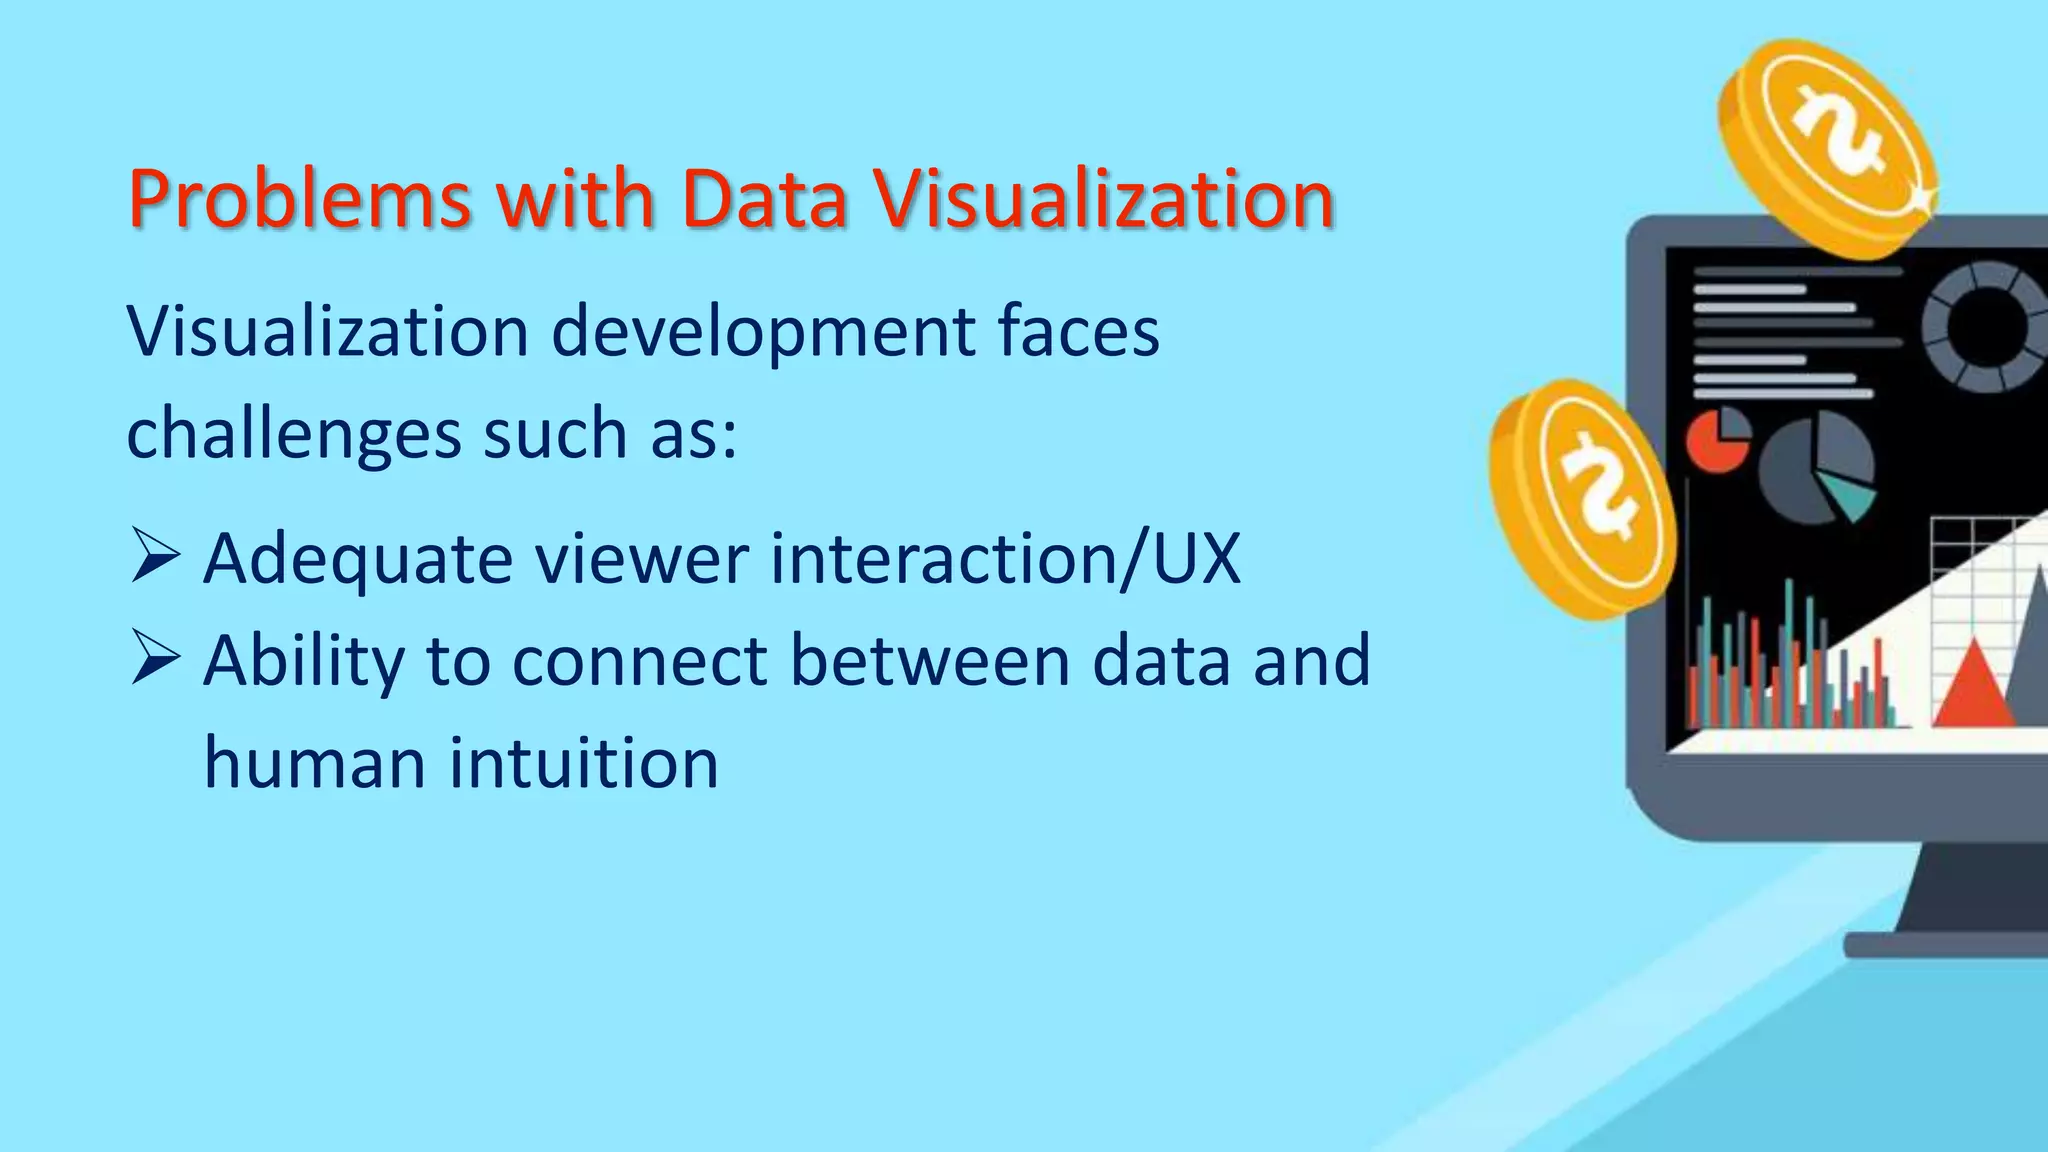
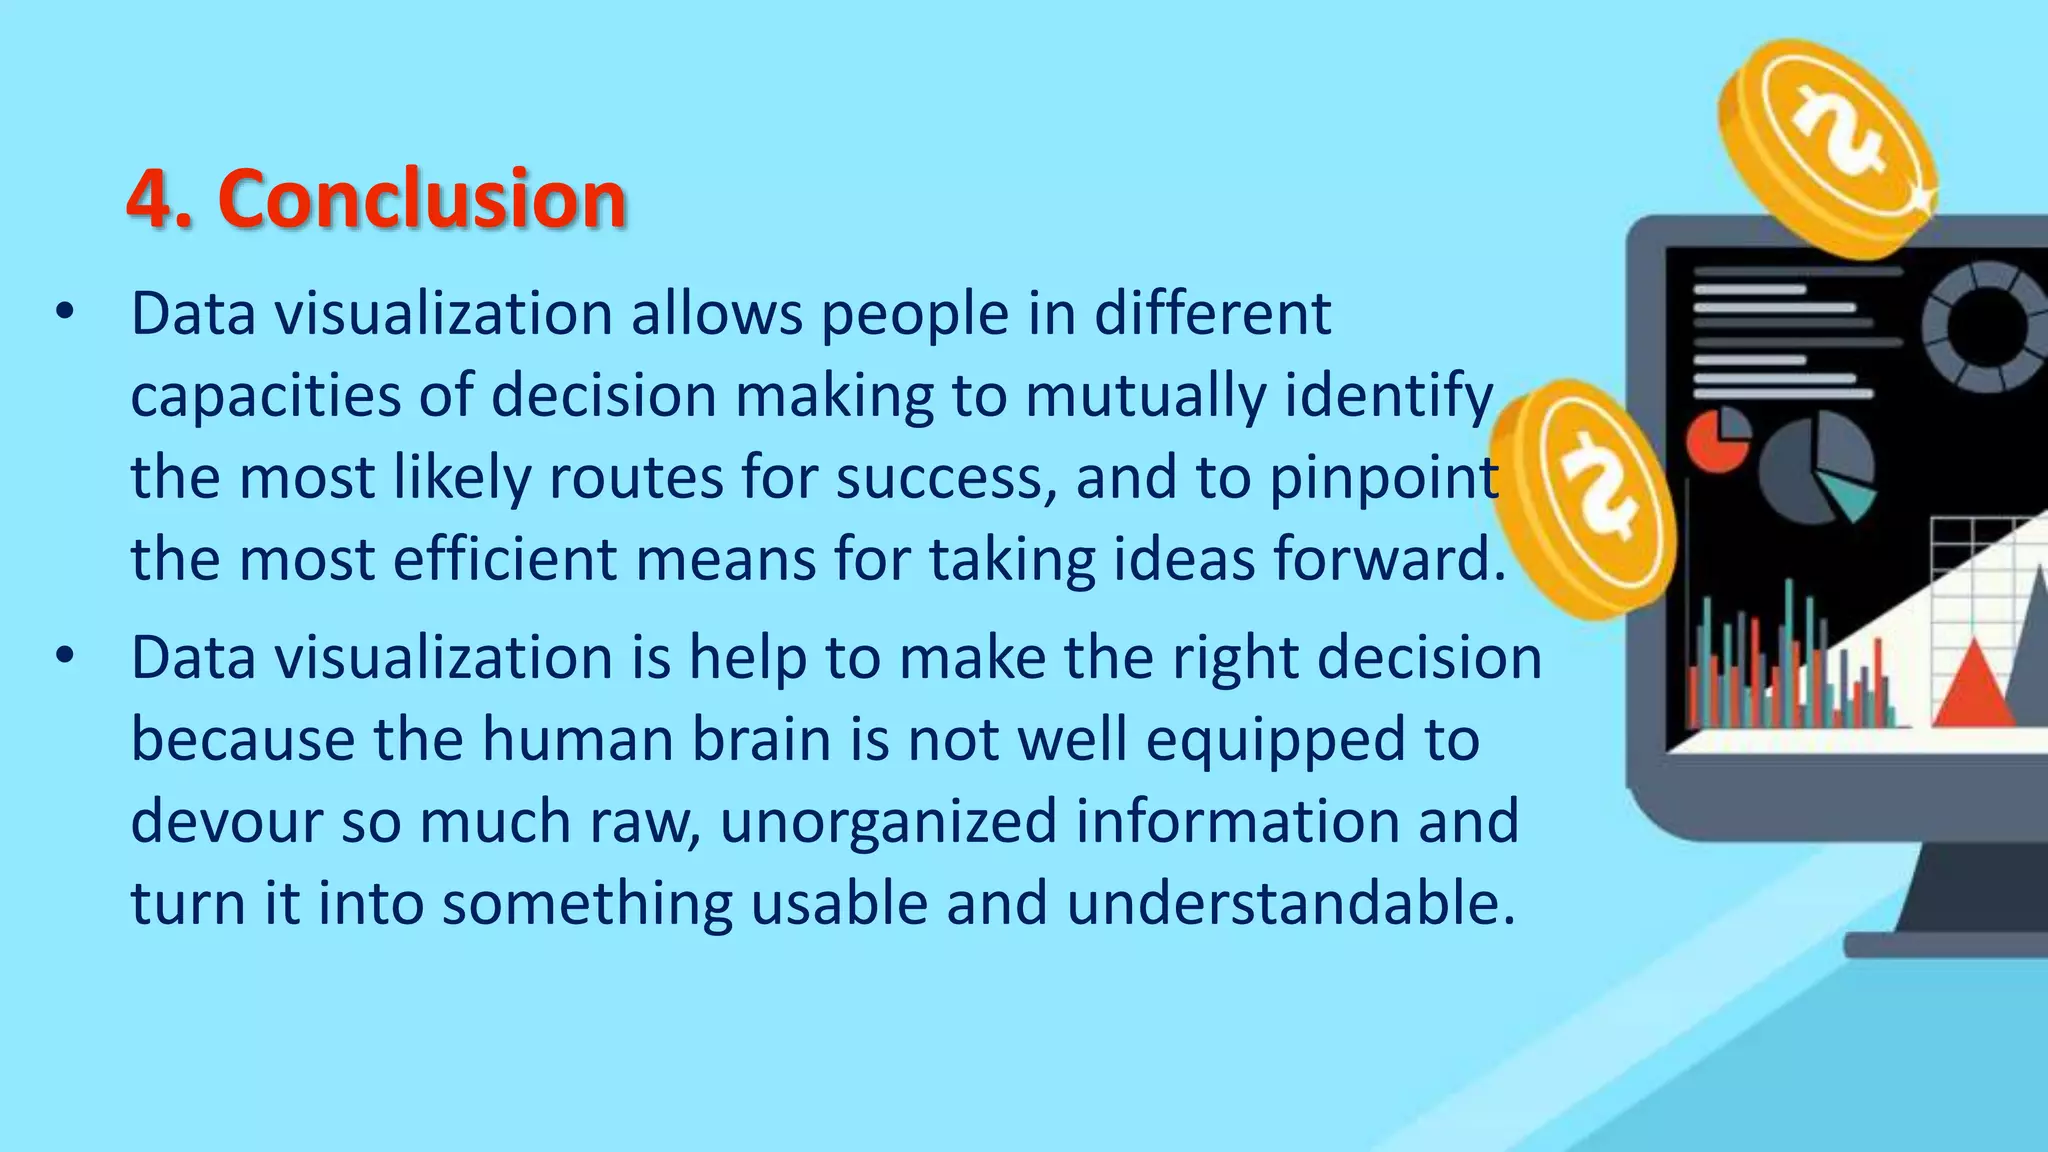
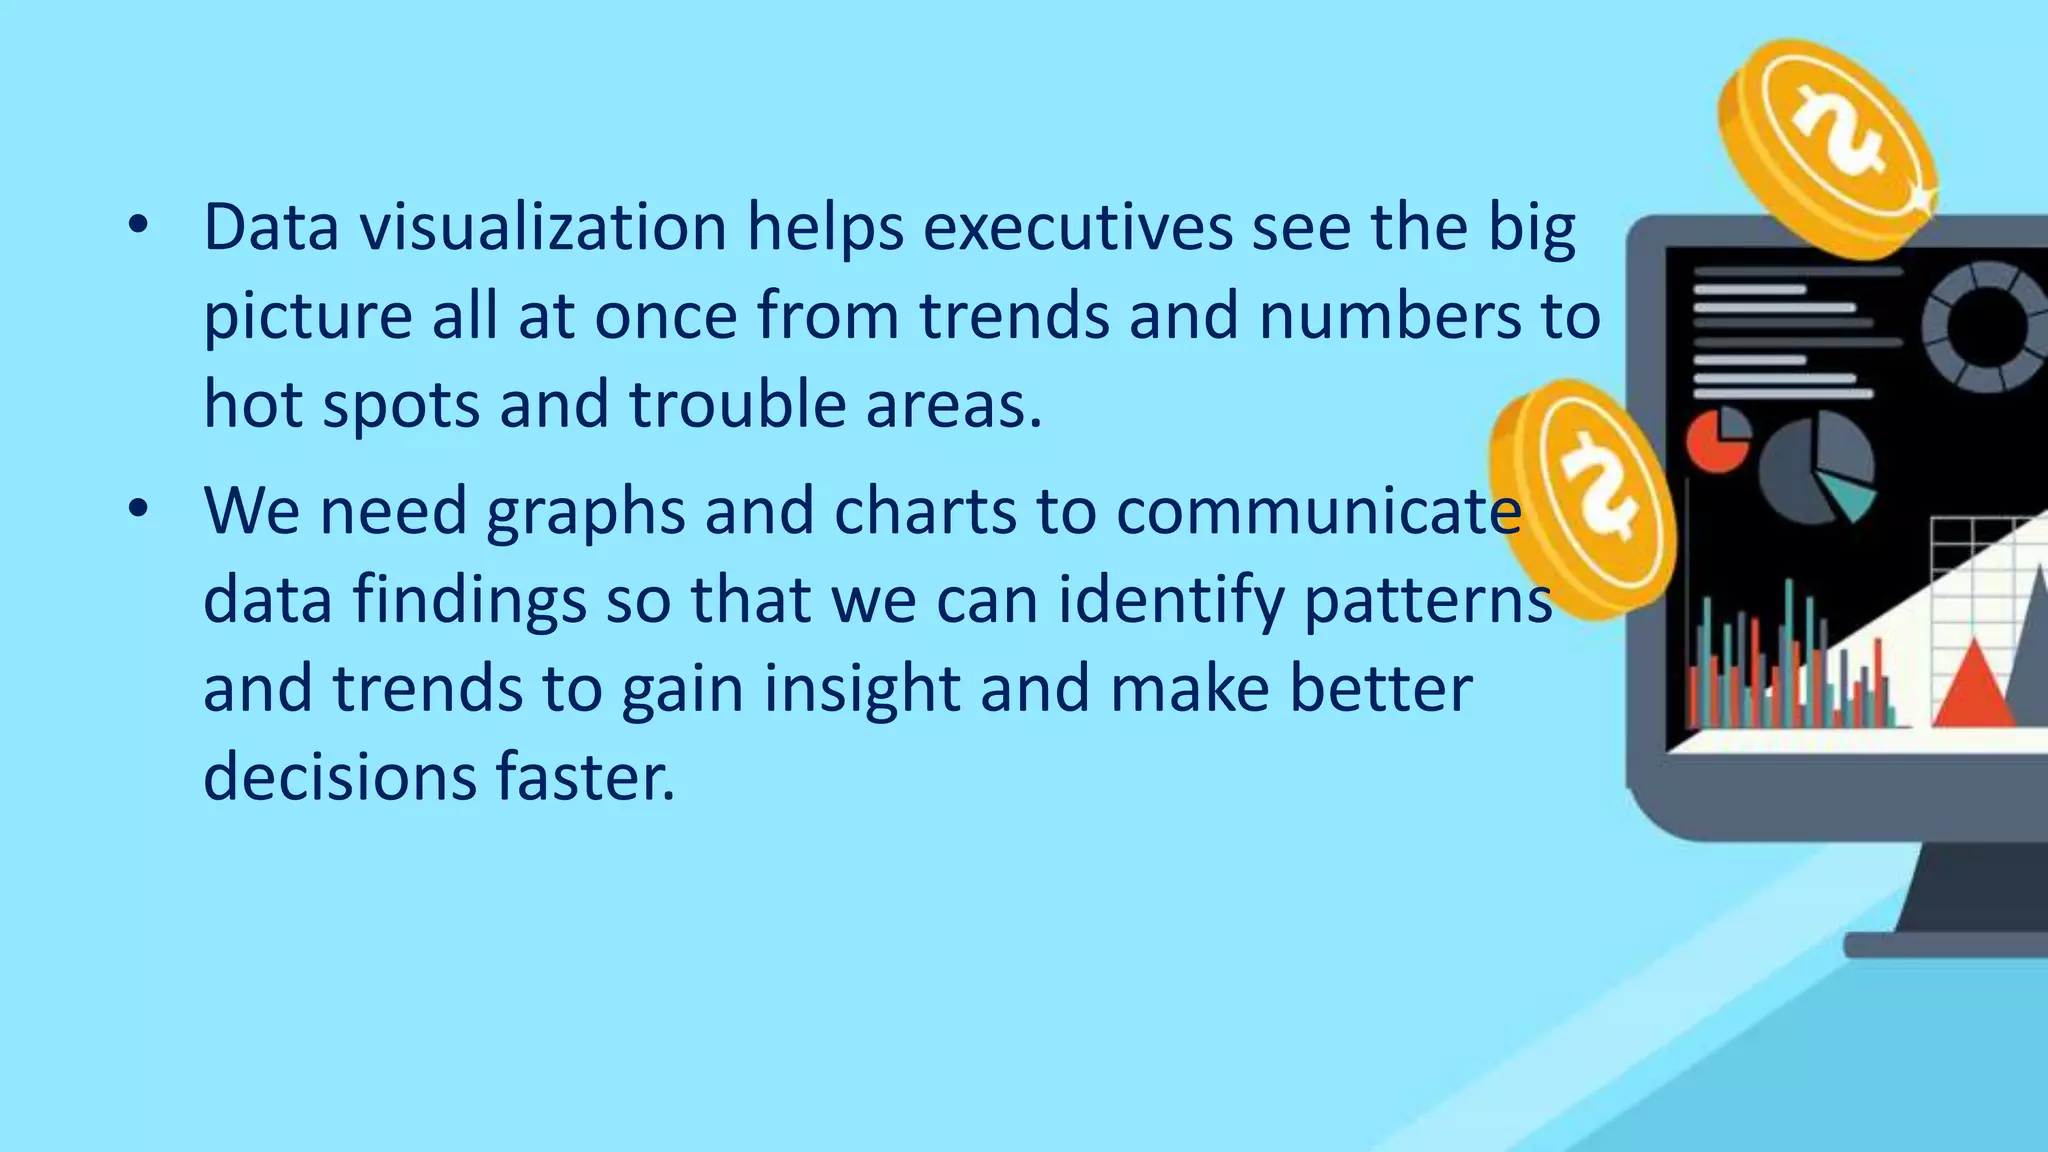
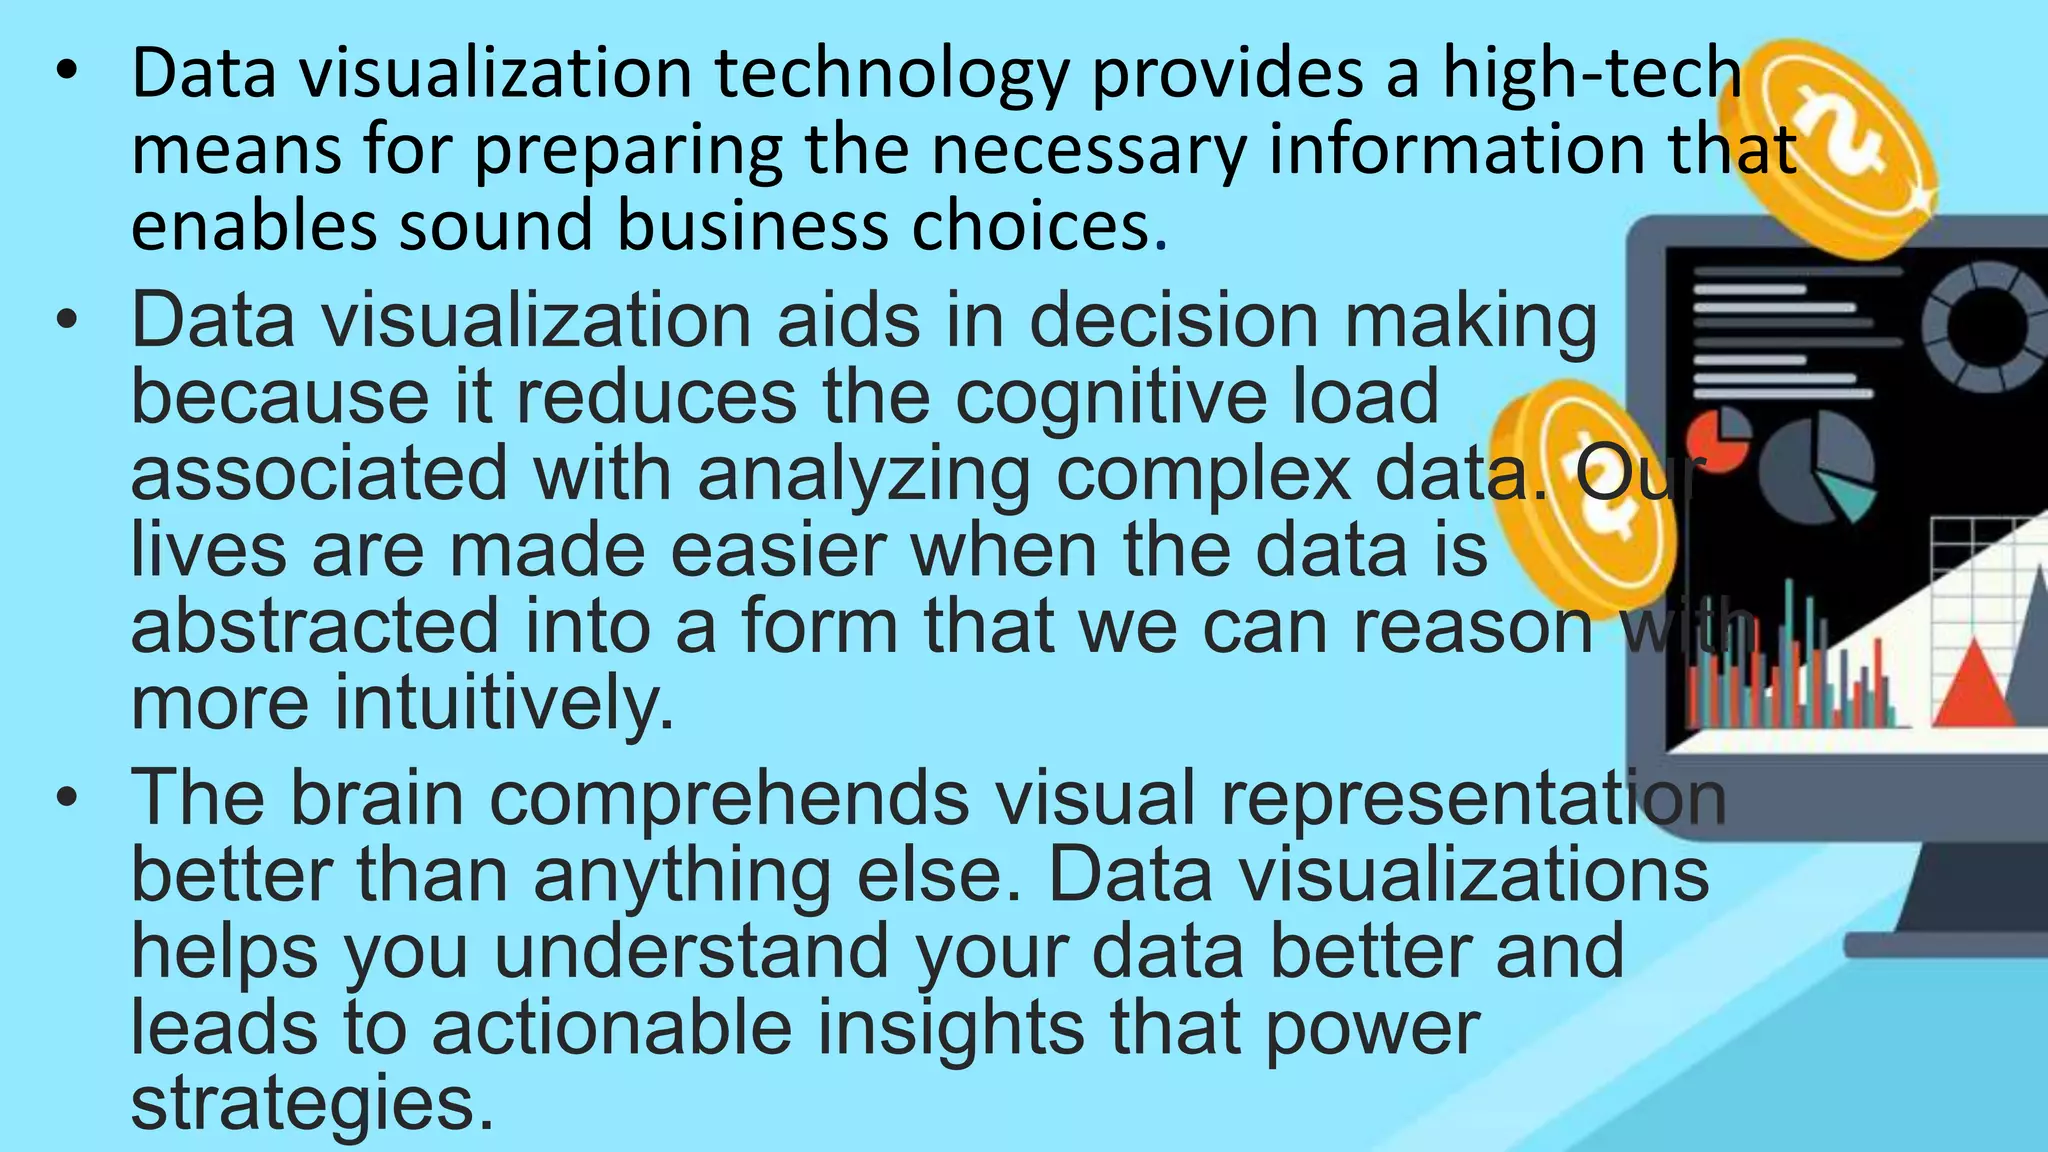
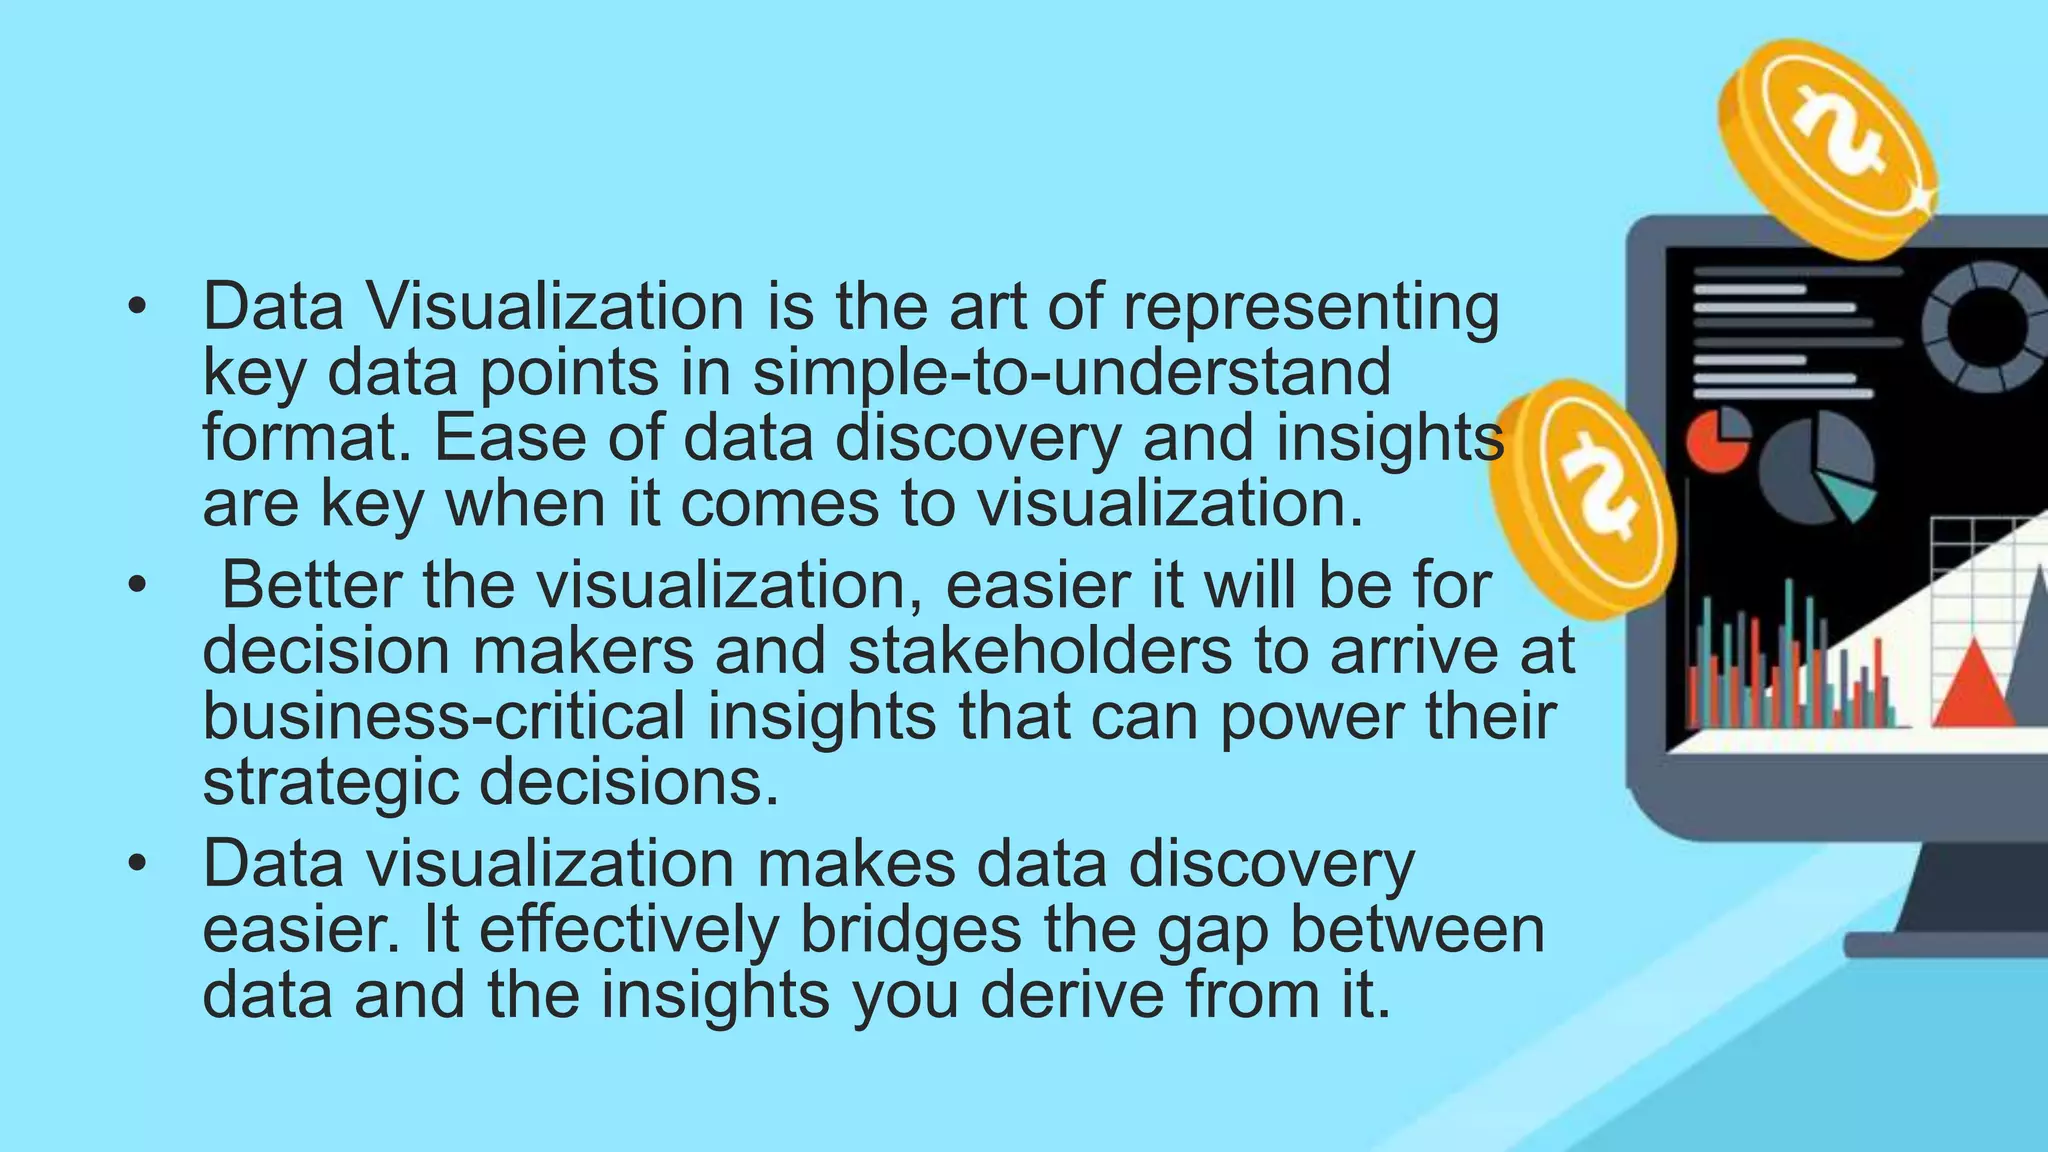
Martina Ojonah
Tewodros Wudematas
Cassie Randolph
Data Visualization Research Project
Group-7
How does visuals enhance human
decisions?
Title slide
1. Abstract
2. Problem Statement and Research Question
3. Main report
4. Conclusion
5. References
1. Abstract
• Using visualization enable humans absorb and
understand the data better. This enables them
identify new patterns and trends that were
otherwise impossible to see using tabular data.
• This research project intends to investigate this
topic by analyzing a variety of peer-reviewed
academic/research articles and utilizing available
datasets that contain metrics surrounding human
visual stimuli.
2. Problem Statement and Research
Question
To understand the importance of visuals in
the decision-making process in
corporations/organizations, this
research will answer the question "How
does visuals enhance human decisions? "
3.Main Report
Ways you can use your data visualizations to
influence decisions:
Influence where viewers look
Design to capture attention
Encourage the eye to compare data
Change default settings as needed
Use visual contrast effectively
Highlight the data that matters to draw
audience attention
Table 1. General big data challenges.
Table 2. Big data life-cycle challenges.
Three-stage Process
There are affective and cognitive responses
to visual stimuli which are governed by a
three-stage process in the brain:
Visceral
Behavioral
Reflective
Picture-1 Three-stage process
Three- Stage Process Levels
• Visceral (“gut”) processing level: Visceral
processing level reacts quickly to appearances.
Researchers measure the visceral reaction when
detecting reaction times to web pages. Visceral-
level affective responses are largely unconscious.
• Behavioral-level processing level: Involves
more aspects of usability e.g., UI, UX,
functionality, structure, etc. Users are
consciously aware of their attitudes at this stage.
Three- Stage Process Levels
• Reflective: Reflective processing is the
most complex level and usually involves a
user’s personal perspective on beauty,
meaning, cultural context, and immediate
usefulness. It often triggers memories and
pragmatic judgments about overall
aesthetic worth and value.
Principles of Effective Design
• Aesthetic knowledge is used by project
decision makers to establish and
communicate for both themselves and
others the meaning of objects, social
relationships, and abstract concepts in
decision making contexts in which the
meaning of these phenomena cannot
be established effectively through other
means.
Classical Aesthetics
Classical aesthetics emphasizes orderliness and
clarity in design; using familiar web and print
conventions. Research shows classical aesthetics
correlate with perceived usability. This model is
most successful when users expect large amounts
of information to be presented in a well-
organized way typically with a clear visual
hierarchy and conventional headers, subheads,
captions, and navigation bars.
Expressive Aesthetics
Expressive aesthetics emphasizes the
originality, creativity, and visual richness of
the site design. Successful expressive design
generates immediate, positive visceral
reactions in most users. Understanding the
audience is particularly crucial in expressive
design.
Bistable Perceptual Task
“The part of the brain responsible for seeing
is more powerful than previously believed. In
fact, the visual cortex can essentially make
decisions just like the brain’s traditional
‘higher level’ areas, finds a new study led by
a Michigan State University neuroscientist.”
Cynefine Framework
Jeanne Moore author of “Data Visualization in
Support of Executive Decision Making” describes the
Cynefin framework which identifies five domains;
each representing a situation an organization may be
faced with. The five domains are complex, chaotic,
complicated, simple, and disordered. The center
domain represents disorder which is the unknown.
Per the Cynefin framework, executive strategic
decisions usually fall within the complex domain.
This is due to lack of clear cause and effect of the
decision.
Cynefine Framework
Moore states that the link between data and
strategic decision-making based on the
characteristics of the complex domain is apparent.
Jeanne Moore states that data visualization is a
methodically developed graphic which represents
data in a manner that allows one to obtain insights,
develop understanding, identify patterns, trends,
or anomalies faster, and promote engaging
discussions.
Jeanne Moore also states that Data visualization
has been widely used as a tool for aiding
understanding of complex phenomena by using
technology to integrate graphic creation with
image understanding and enabling more efficient
communication.
Cynefine Framework for Decision-Making
Example Experiment
Things that catch our attention most are
those that have features that are
significantly different from their background.
In the images on the next slide, it easy to
identify the ripened tomato in picture 1 from
among the rest compared to picture 2 where
the sameness of the tomatoes make it
difficult to filter anything out.
Example Experiment
Problems with Data Visualization
Visualization development faces
challenges such as:
 Adequate viewer interaction/UX
 Ability to connect between data and
human intuition
4. Conclusion
• Data visualization allows people in different
capacities of decision making to mutually identify
the most likely routes for success, and to pinpoint
the most efficient means for taking ideas forward.
• Data visualization is help to make the right decision
because the human brain is not well equipped to
devour so much raw, unorganized information and
turn it into something usable and understandable.
• Data visualization helps executives see the big
picture all at once from trends and numbers to
hot spots and trouble areas.
• We need graphs and charts to communicate
data findings so that we can identify patterns
and trends to gain insight and make better
decisions faster.
• Data visualization technology provides a high-tech
means for preparing the necessary information that
enables sound business choices.
• Data visualization aids in decision making
because it reduces the cognitive load
associated with analyzing complex data. Our
lives are made easier when the data is
abstracted into a form that we can reason with
more intuitively.
• The brain comprehends visual representation
better than anything else. Data visualizations
helps you understand your data better and
leads to actionable insights that power
strategies.
• Data Visualization is the art of representing
key data points in simple-to-understand
format. Ease of data discovery and insights
are key when it comes to visualization.
• Better the visualization, easier it will be for
decision makers and stakeholders to arrive at
business-critical insights that can power their
strategic decisions.
• Data visualization makes data discovery
easier. It effectively bridges the gap between
data and the insights you derive from it.
References
• Lee J, Bednarz R. Effect of GIS learning on spatial
thinking. Journal of Geography in Higher
Education. 2009;33(2):183–198.
• Liu Le, Boone Alexander P., Ruginski Ian T., Padilla Lace,
Hegarty Mary, Creem-Regehr Sarah H., Thompson William B.,
Yuksel Cem, House Donald H. Uncertainty Visualization by
Representative Sampling from Prediction Ensembles. IEEE
Transactions on Visualization and Computer
Graphics. 2017;23(9):2165–2178.
• Lobben AK. Tasks, strategies, and cognitive processes
associated with navigational map reading: A review
perspective. The Professional Geographer. 2004;56(2):270–
281.
• Munzner T. Visualization analysis and design. Boca Raton, FL:
CRC Press; 2014.
• McKenzie G, Hegarty M, Barrett T, Goodchild M. Assessing
the effectiveness of different visualizations for judgments of
positional uncertainty. International Journal of Geographical
Information Science. 2016;30(2):221–239. doi:
10.1080/13658816.2015.1082566.
• Mechelli A, Price CJ, Friston KJ, Ishai A. Where bottom-up
meets top-down: Neuronal interactions during perception and
imagery. Cerebral Cortex. 2004;14(11):1256–1265.
• Meilinger T, Knauff M, Bülthoff HH. Working memory in
wayfinding—A dual task experiment in a virtual city. Cognitive
Science. 2008;32(4):755–770. doi:
10.1080/03640210802067004.
• Meyer J. Performance with tables and graphs: Effects of
training and a visual search
model. Ergonomics. 2000;43(11):1840–1865.
• Nadav-Greenberg L, Joslyn SL, Taing MU. The effect of
uncertainty visualizations on decision making in weather
forecasting. Journal of Cognitive Engineering and Decision
Making. 2008;2(1):24–47
• Marewski JN, Gigerenzer G. Heuristic decision making in
medicine. Dialogues in Clinical Neuroscience. 2012;14(1):77–
89.
• McCabe DP, Castel AD. Seeing is believing: The effect of brain
images on judgments of scientific
reasoning. Cognition. 2008;107(1):343–352.
• Waters EA, Weinstein ND, Colditz GA, Emmons KM.
Reducing aversion to side effects in preventive medical
treatment decisions. Journal of Experimental Psychology:
Applied. 2007;13(1):11.
• Lohse GL. A cognitive model for understanding graphical
perception. Human Computer Interaction. 1993;8(4):353–388.
• Lohse GL. The role of working memory on graphical
information processing. Behaviour & Information
Technology. 1997;16(6):297–308.
• Wilkening Jan, Fabrikant Sara Irina. Spatial Information
Theory. Berlin, Heidelberg: Springer Berlin Heidelberg; 2011.
How Do Decision Time and Realism Affect Map-Based
Decision Making? pp. 1–19.
• Zhu B, Watts SA. Visualization of network concepts: The
impact of working memory capacity differences. Information
Systems Research. 2010;21(2):327–344.
Data visualization research project

Data visualization research project

  • 1.
    Martina Ojonah Tewodros Wudematas CassieRandolph Data Visualization Research Project Group-7
  • 2.
    How does visualsenhance human decisions?
  • 3.
    Title slide 1. Abstract 2.Problem Statement and Research Question 3. Main report 4. Conclusion 5. References
  • 4.
    1. Abstract • Usingvisualization enable humans absorb and understand the data better. This enables them identify new patterns and trends that were otherwise impossible to see using tabular data. • This research project intends to investigate this topic by analyzing a variety of peer-reviewed academic/research articles and utilizing available datasets that contain metrics surrounding human visual stimuli.
  • 5.
    2. Problem Statementand Research Question To understand the importance of visuals in the decision-making process in corporations/organizations, this research will answer the question "How does visuals enhance human decisions? "
  • 6.
    3.Main Report Ways youcan use your data visualizations to influence decisions: Influence where viewers look Design to capture attention Encourage the eye to compare data Change default settings as needed Use visual contrast effectively Highlight the data that matters to draw audience attention
  • 7.
    Table 1. Generalbig data challenges.
  • 8.
    Table 2. Bigdata life-cycle challenges.
  • 9.
    Three-stage Process There areaffective and cognitive responses to visual stimuli which are governed by a three-stage process in the brain: Visceral Behavioral Reflective
  • 10.
  • 11.
    Three- Stage ProcessLevels • Visceral (“gut”) processing level: Visceral processing level reacts quickly to appearances. Researchers measure the visceral reaction when detecting reaction times to web pages. Visceral- level affective responses are largely unconscious. • Behavioral-level processing level: Involves more aspects of usability e.g., UI, UX, functionality, structure, etc. Users are consciously aware of their attitudes at this stage.
  • 12.
    Three- Stage ProcessLevels • Reflective: Reflective processing is the most complex level and usually involves a user’s personal perspective on beauty, meaning, cultural context, and immediate usefulness. It often triggers memories and pragmatic judgments about overall aesthetic worth and value.
  • 13.
  • 14.
    • Aesthetic knowledgeis used by project decision makers to establish and communicate for both themselves and others the meaning of objects, social relationships, and abstract concepts in decision making contexts in which the meaning of these phenomena cannot be established effectively through other means.
  • 15.
    Classical Aesthetics Classical aestheticsemphasizes orderliness and clarity in design; using familiar web and print conventions. Research shows classical aesthetics correlate with perceived usability. This model is most successful when users expect large amounts of information to be presented in a well- organized way typically with a clear visual hierarchy and conventional headers, subheads, captions, and navigation bars.
  • 16.
    Expressive Aesthetics Expressive aestheticsemphasizes the originality, creativity, and visual richness of the site design. Successful expressive design generates immediate, positive visceral reactions in most users. Understanding the audience is particularly crucial in expressive design.
  • 17.
  • 18.
    “The part ofthe brain responsible for seeing is more powerful than previously believed. In fact, the visual cortex can essentially make decisions just like the brain’s traditional ‘higher level’ areas, finds a new study led by a Michigan State University neuroscientist.”
  • 19.
    Cynefine Framework Jeanne Mooreauthor of “Data Visualization in Support of Executive Decision Making” describes the Cynefin framework which identifies five domains; each representing a situation an organization may be faced with. The five domains are complex, chaotic, complicated, simple, and disordered. The center domain represents disorder which is the unknown. Per the Cynefin framework, executive strategic decisions usually fall within the complex domain. This is due to lack of clear cause and effect of the decision.
  • 20.
    Cynefine Framework Moore statesthat the link between data and strategic decision-making based on the characteristics of the complex domain is apparent. Jeanne Moore states that data visualization is a methodically developed graphic which represents data in a manner that allows one to obtain insights, develop understanding, identify patterns, trends, or anomalies faster, and promote engaging discussions.
  • 21.
    Jeanne Moore alsostates that Data visualization has been widely used as a tool for aiding understanding of complex phenomena by using technology to integrate graphic creation with image understanding and enabling more efficient communication.
  • 22.
    Cynefine Framework forDecision-Making
  • 23.
    Example Experiment Things thatcatch our attention most are those that have features that are significantly different from their background. In the images on the next slide, it easy to identify the ripened tomato in picture 1 from among the rest compared to picture 2 where the sameness of the tomatoes make it difficult to filter anything out.
  • 24.
  • 25.
    Problems with DataVisualization Visualization development faces challenges such as:  Adequate viewer interaction/UX  Ability to connect between data and human intuition
  • 26.
    4. Conclusion • Datavisualization allows people in different capacities of decision making to mutually identify the most likely routes for success, and to pinpoint the most efficient means for taking ideas forward. • Data visualization is help to make the right decision because the human brain is not well equipped to devour so much raw, unorganized information and turn it into something usable and understandable.
  • 27.
    • Data visualizationhelps executives see the big picture all at once from trends and numbers to hot spots and trouble areas. • We need graphs and charts to communicate data findings so that we can identify patterns and trends to gain insight and make better decisions faster.
  • 28.
    • Data visualizationtechnology provides a high-tech means for preparing the necessary information that enables sound business choices. • Data visualization aids in decision making because it reduces the cognitive load associated with analyzing complex data. Our lives are made easier when the data is abstracted into a form that we can reason with more intuitively. • The brain comprehends visual representation better than anything else. Data visualizations helps you understand your data better and leads to actionable insights that power strategies.
  • 29.
    • Data Visualizationis the art of representing key data points in simple-to-understand format. Ease of data discovery and insights are key when it comes to visualization. • Better the visualization, easier it will be for decision makers and stakeholders to arrive at business-critical insights that can power their strategic decisions. • Data visualization makes data discovery easier. It effectively bridges the gap between data and the insights you derive from it.
  • 30.
    References • Lee J,Bednarz R. Effect of GIS learning on spatial thinking. Journal of Geography in Higher Education. 2009;33(2):183–198. • Liu Le, Boone Alexander P., Ruginski Ian T., Padilla Lace, Hegarty Mary, Creem-Regehr Sarah H., Thompson William B., Yuksel Cem, House Donald H. Uncertainty Visualization by Representative Sampling from Prediction Ensembles. IEEE Transactions on Visualization and Computer Graphics. 2017;23(9):2165–2178. • Lobben AK. Tasks, strategies, and cognitive processes associated with navigational map reading: A review perspective. The Professional Geographer. 2004;56(2):270– 281. • Munzner T. Visualization analysis and design. Boca Raton, FL: CRC Press; 2014.
  • 31.
    • McKenzie G,Hegarty M, Barrett T, Goodchild M. Assessing the effectiveness of different visualizations for judgments of positional uncertainty. International Journal of Geographical Information Science. 2016;30(2):221–239. doi: 10.1080/13658816.2015.1082566. • Mechelli A, Price CJ, Friston KJ, Ishai A. Where bottom-up meets top-down: Neuronal interactions during perception and imagery. Cerebral Cortex. 2004;14(11):1256–1265. • Meilinger T, Knauff M, Bülthoff HH. Working memory in wayfinding—A dual task experiment in a virtual city. Cognitive Science. 2008;32(4):755–770. doi: 10.1080/03640210802067004. • Meyer J. Performance with tables and graphs: Effects of training and a visual search model. Ergonomics. 2000;43(11):1840–1865.
  • 32.
    • Nadav-Greenberg L,Joslyn SL, Taing MU. The effect of uncertainty visualizations on decision making in weather forecasting. Journal of Cognitive Engineering and Decision Making. 2008;2(1):24–47 • Marewski JN, Gigerenzer G. Heuristic decision making in medicine. Dialogues in Clinical Neuroscience. 2012;14(1):77– 89. • McCabe DP, Castel AD. Seeing is believing: The effect of brain images on judgments of scientific reasoning. Cognition. 2008;107(1):343–352. • Waters EA, Weinstein ND, Colditz GA, Emmons KM. Reducing aversion to side effects in preventive medical treatment decisions. Journal of Experimental Psychology: Applied. 2007;13(1):11.
  • 33.
    • Lohse GL.A cognitive model for understanding graphical perception. Human Computer Interaction. 1993;8(4):353–388. • Lohse GL. The role of working memory on graphical information processing. Behaviour & Information Technology. 1997;16(6):297–308. • Wilkening Jan, Fabrikant Sara Irina. Spatial Information Theory. Berlin, Heidelberg: Springer Berlin Heidelberg; 2011. How Do Decision Time and Realism Affect Map-Based Decision Making? pp. 1–19. • Zhu B, Watts SA. Visualization of network concepts: The impact of working memory capacity differences. Information Systems Research. 2010;21(2):327–344.