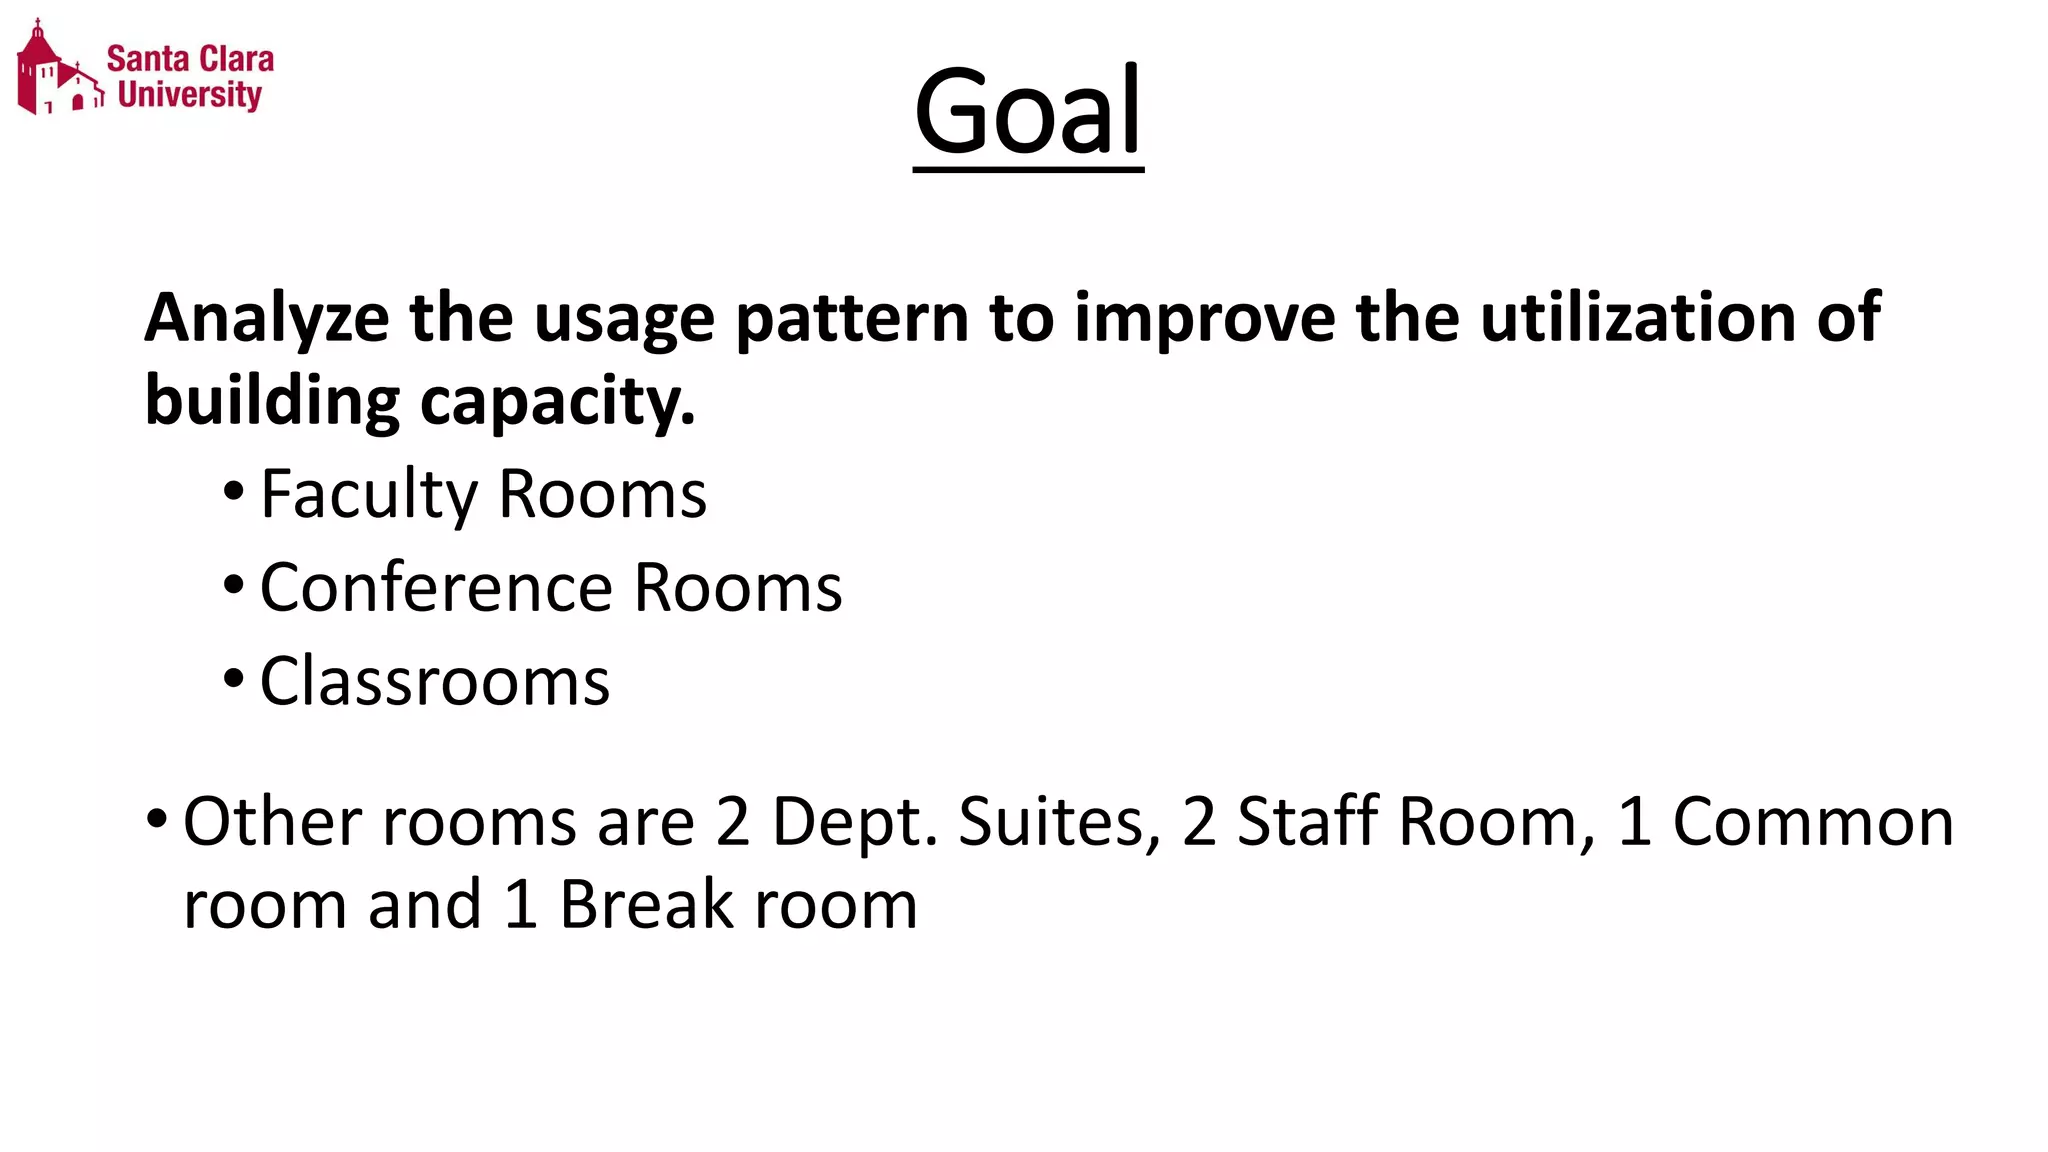
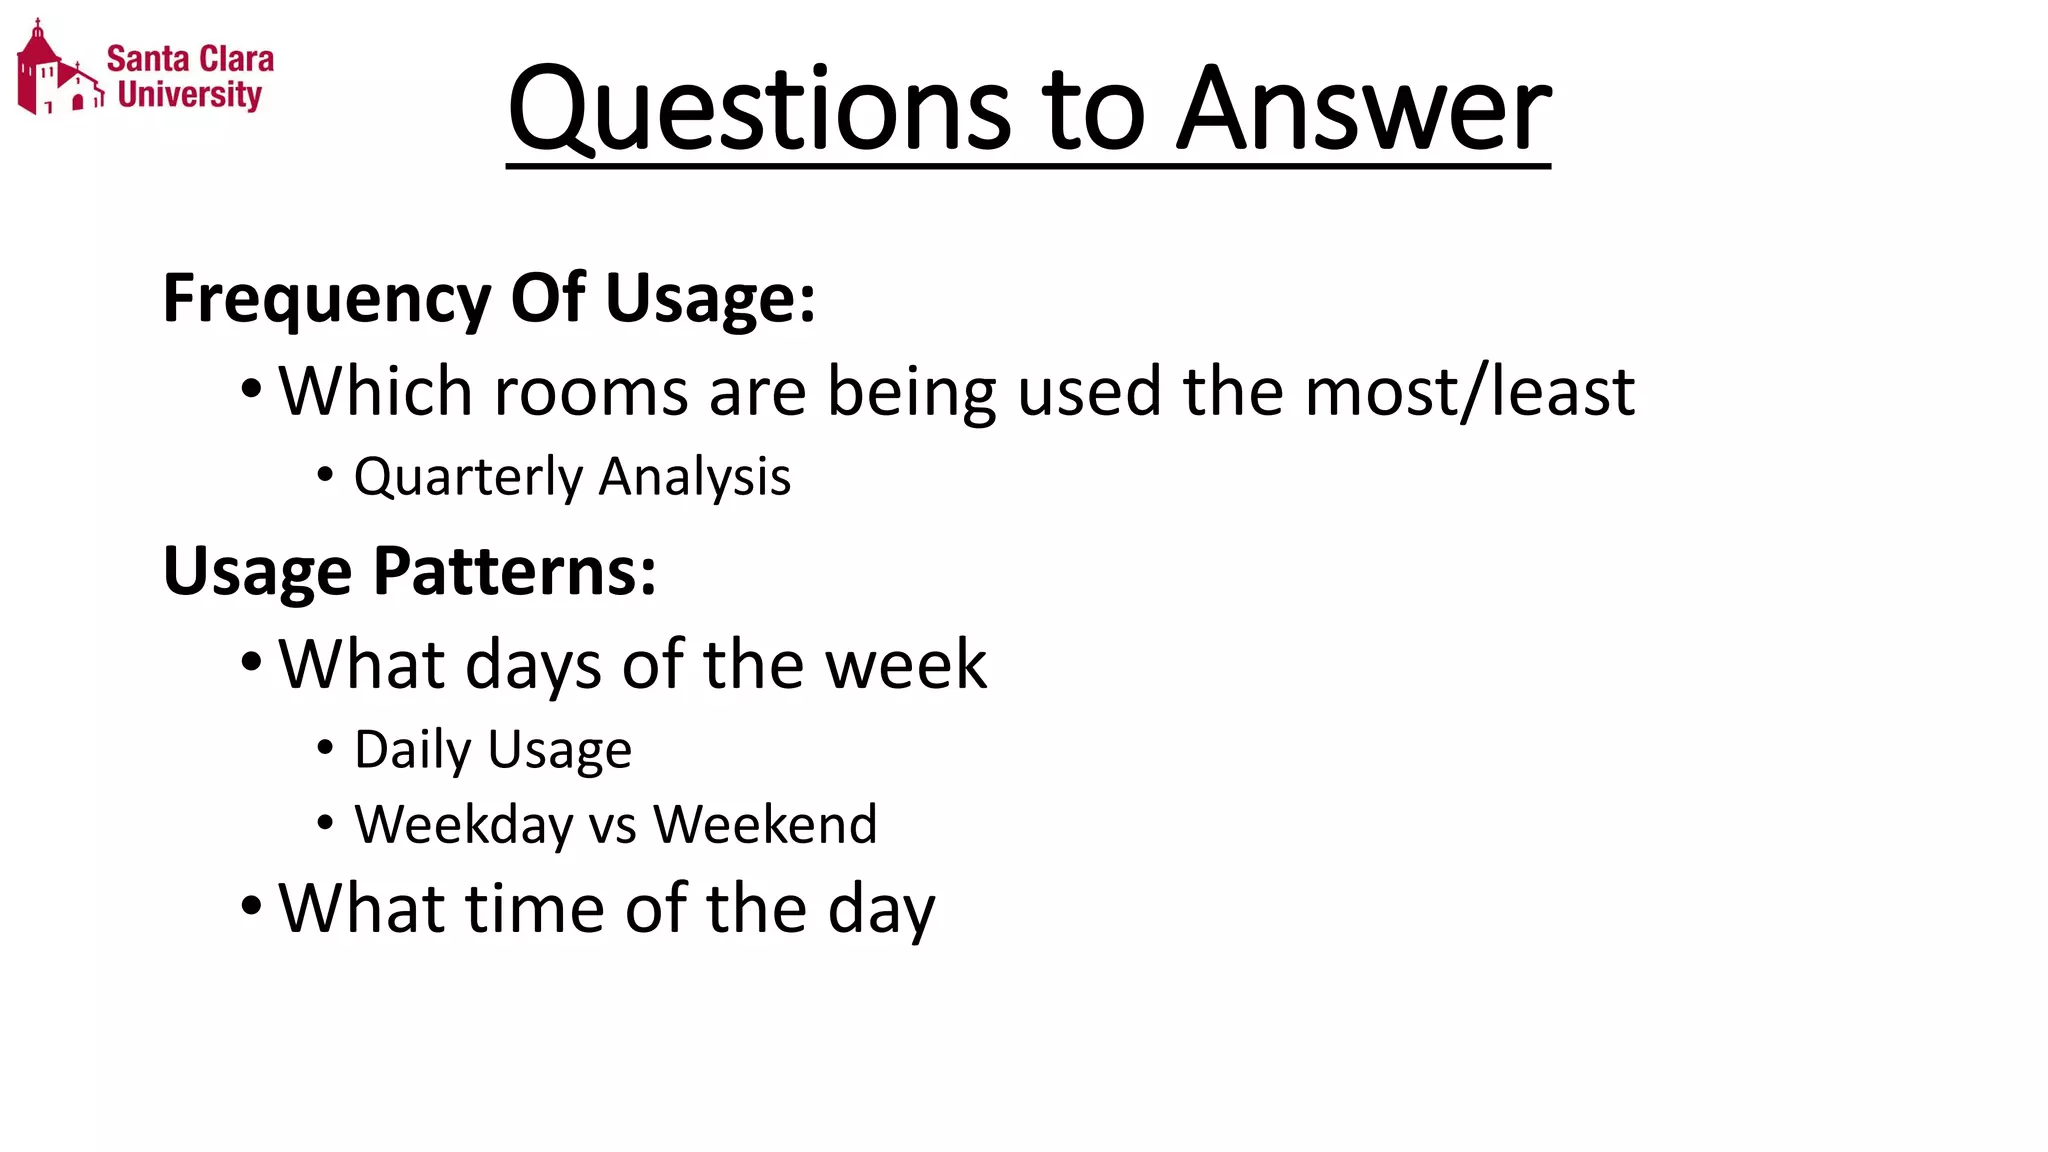
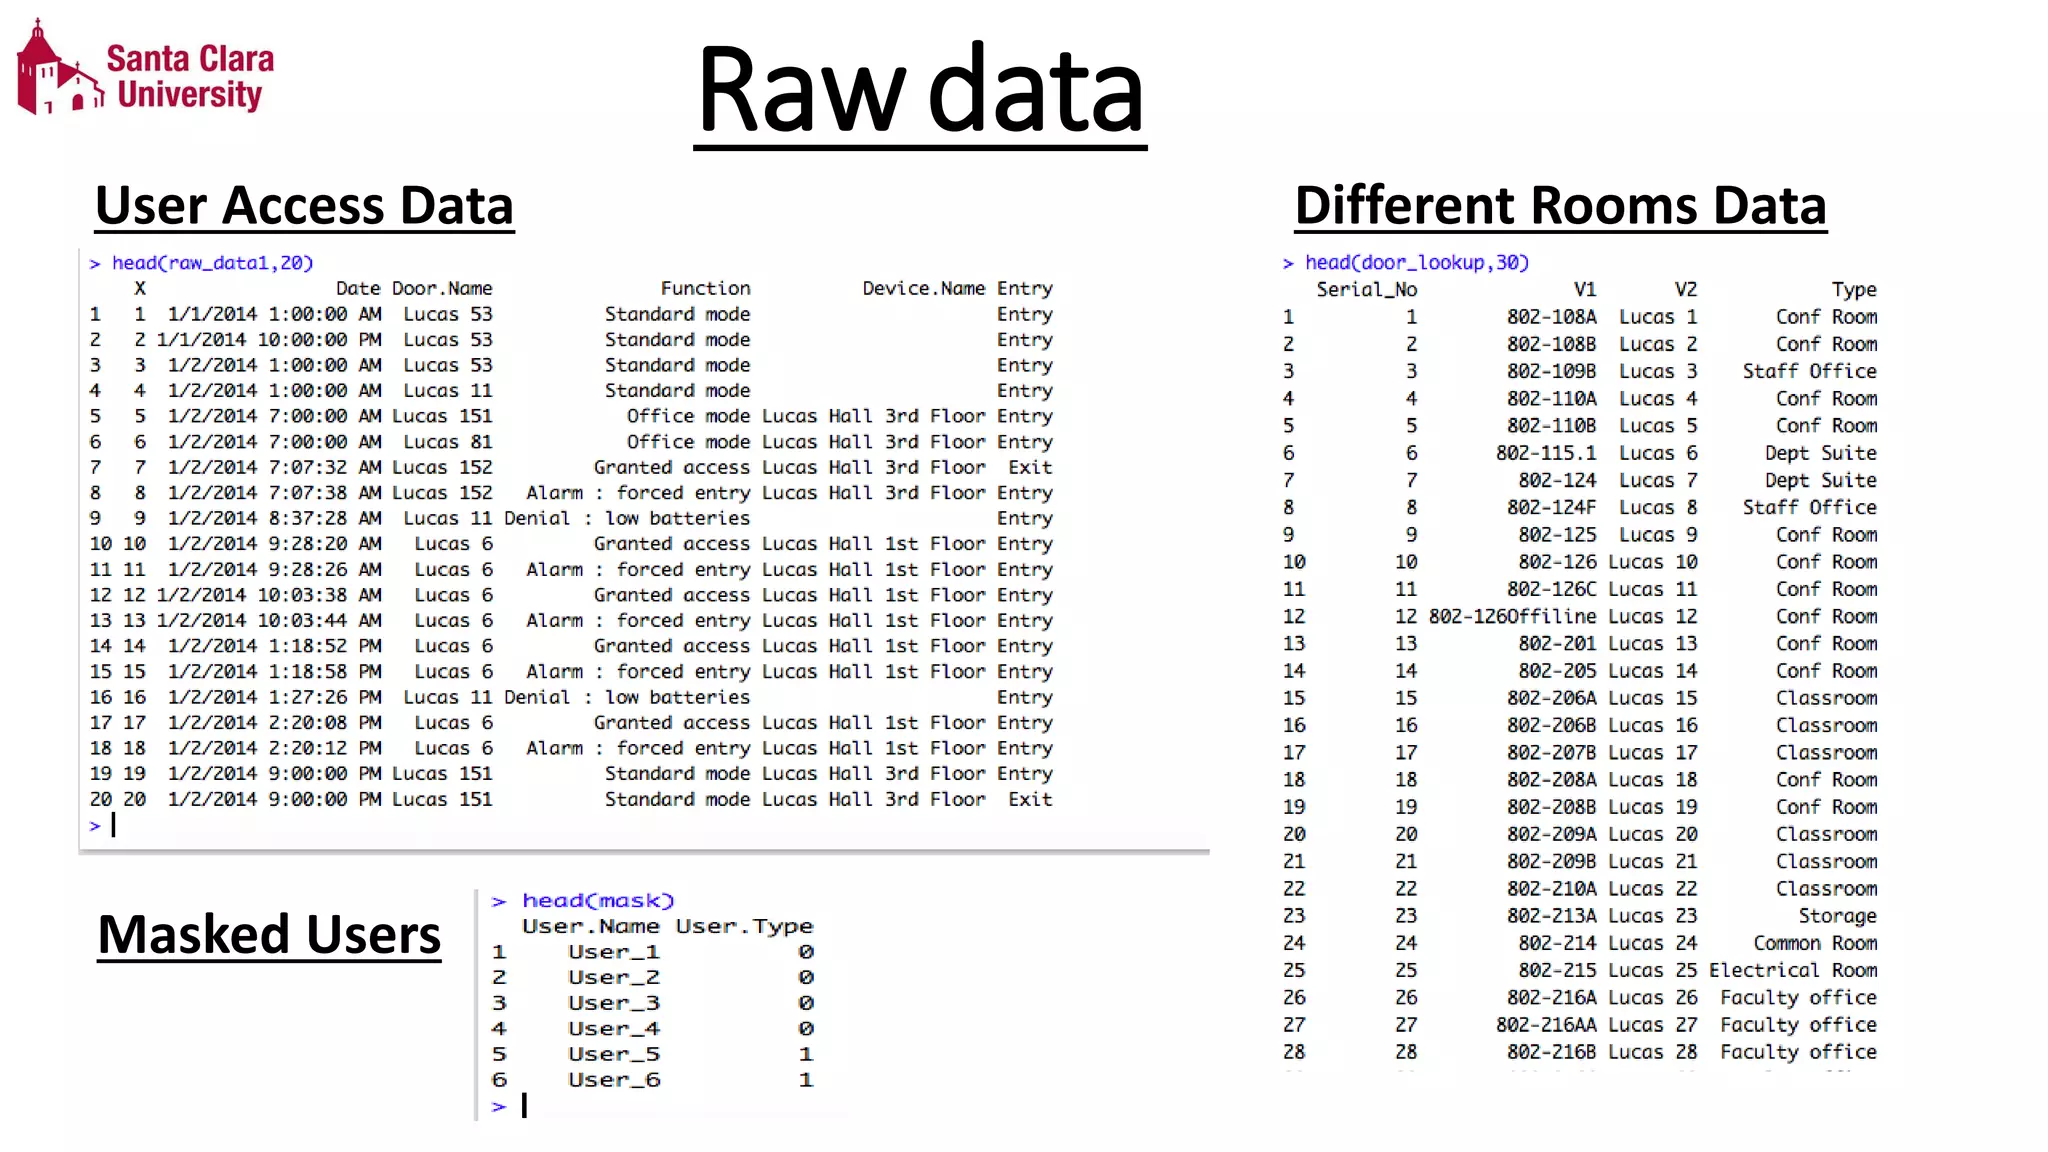
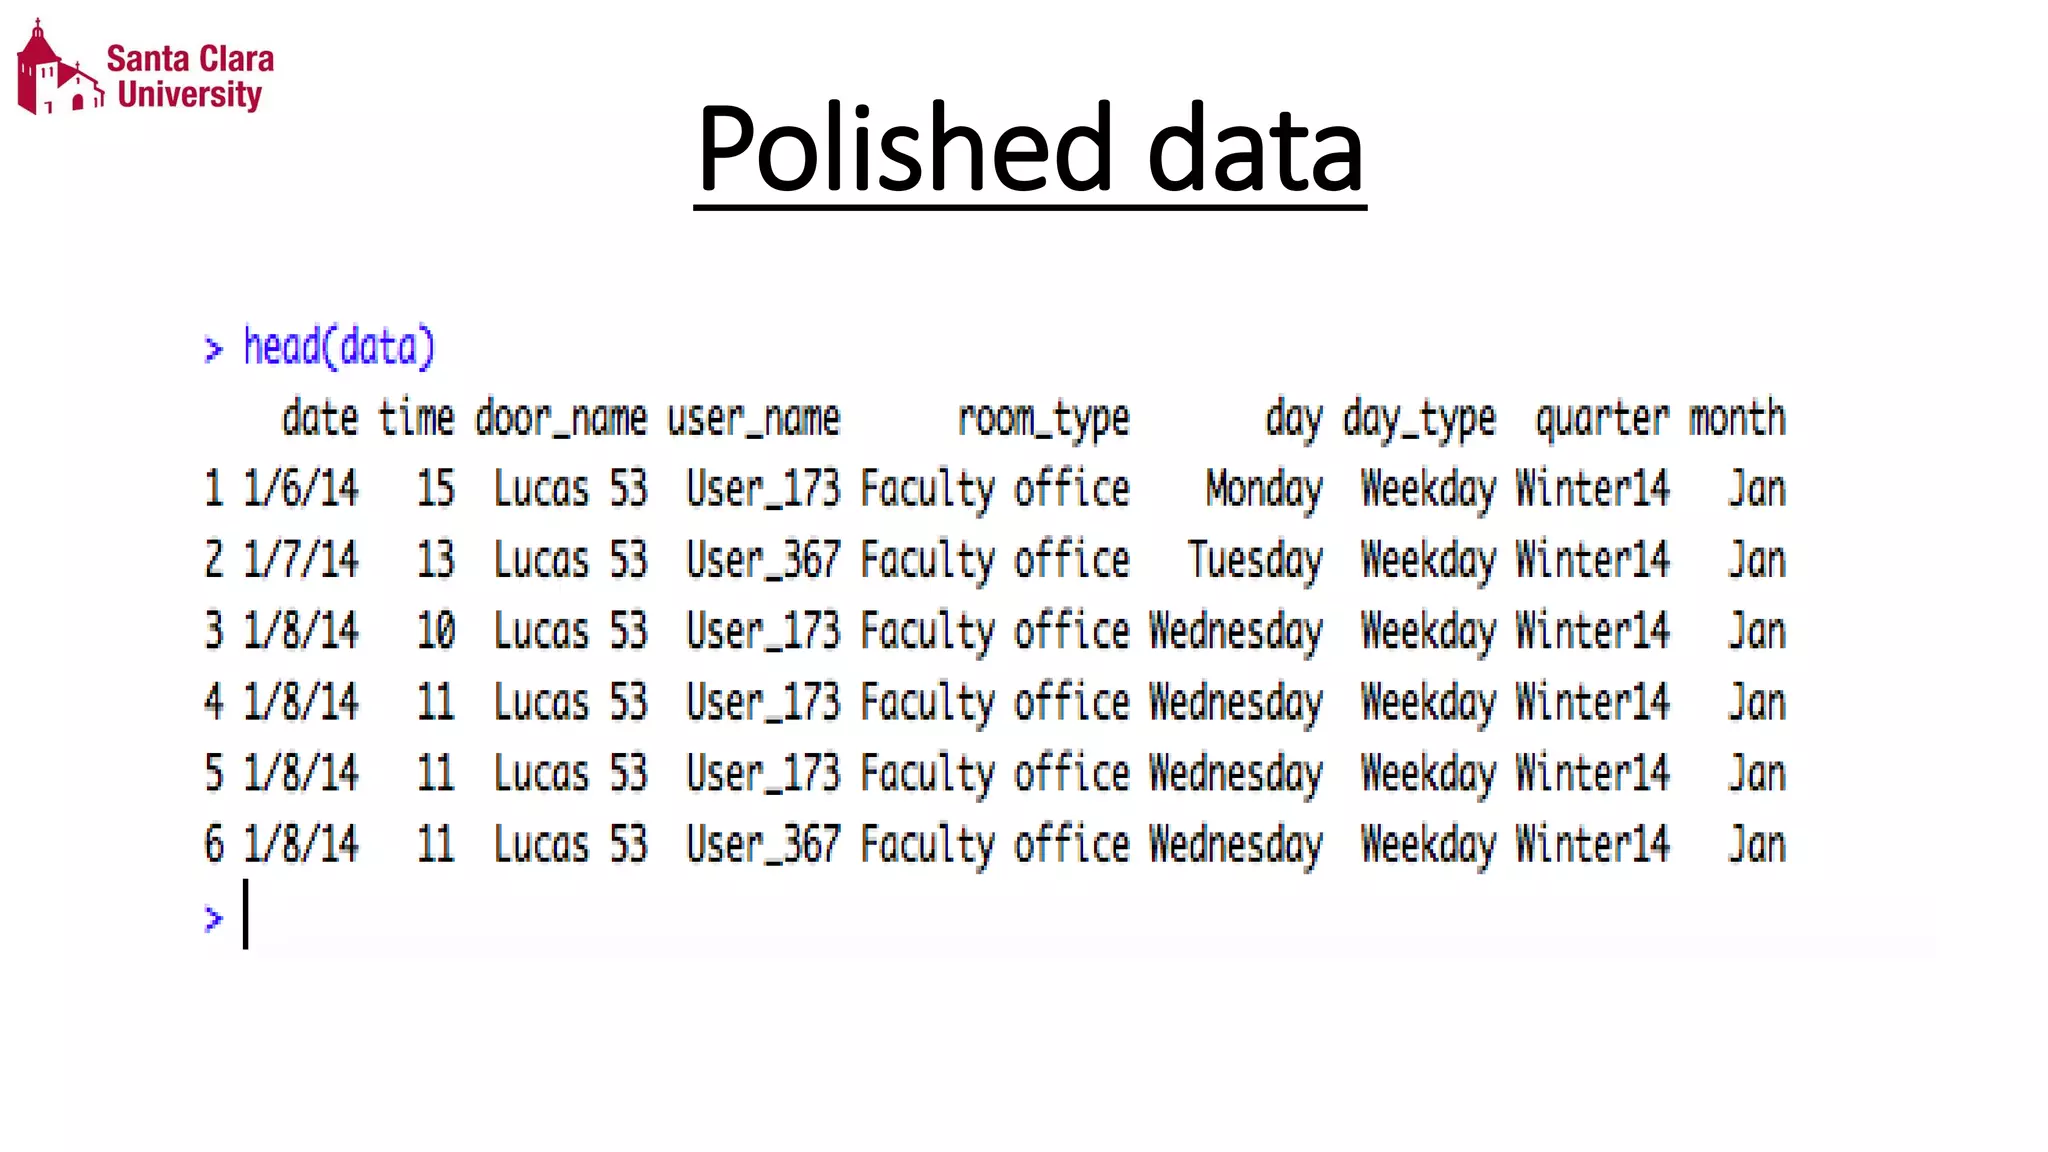
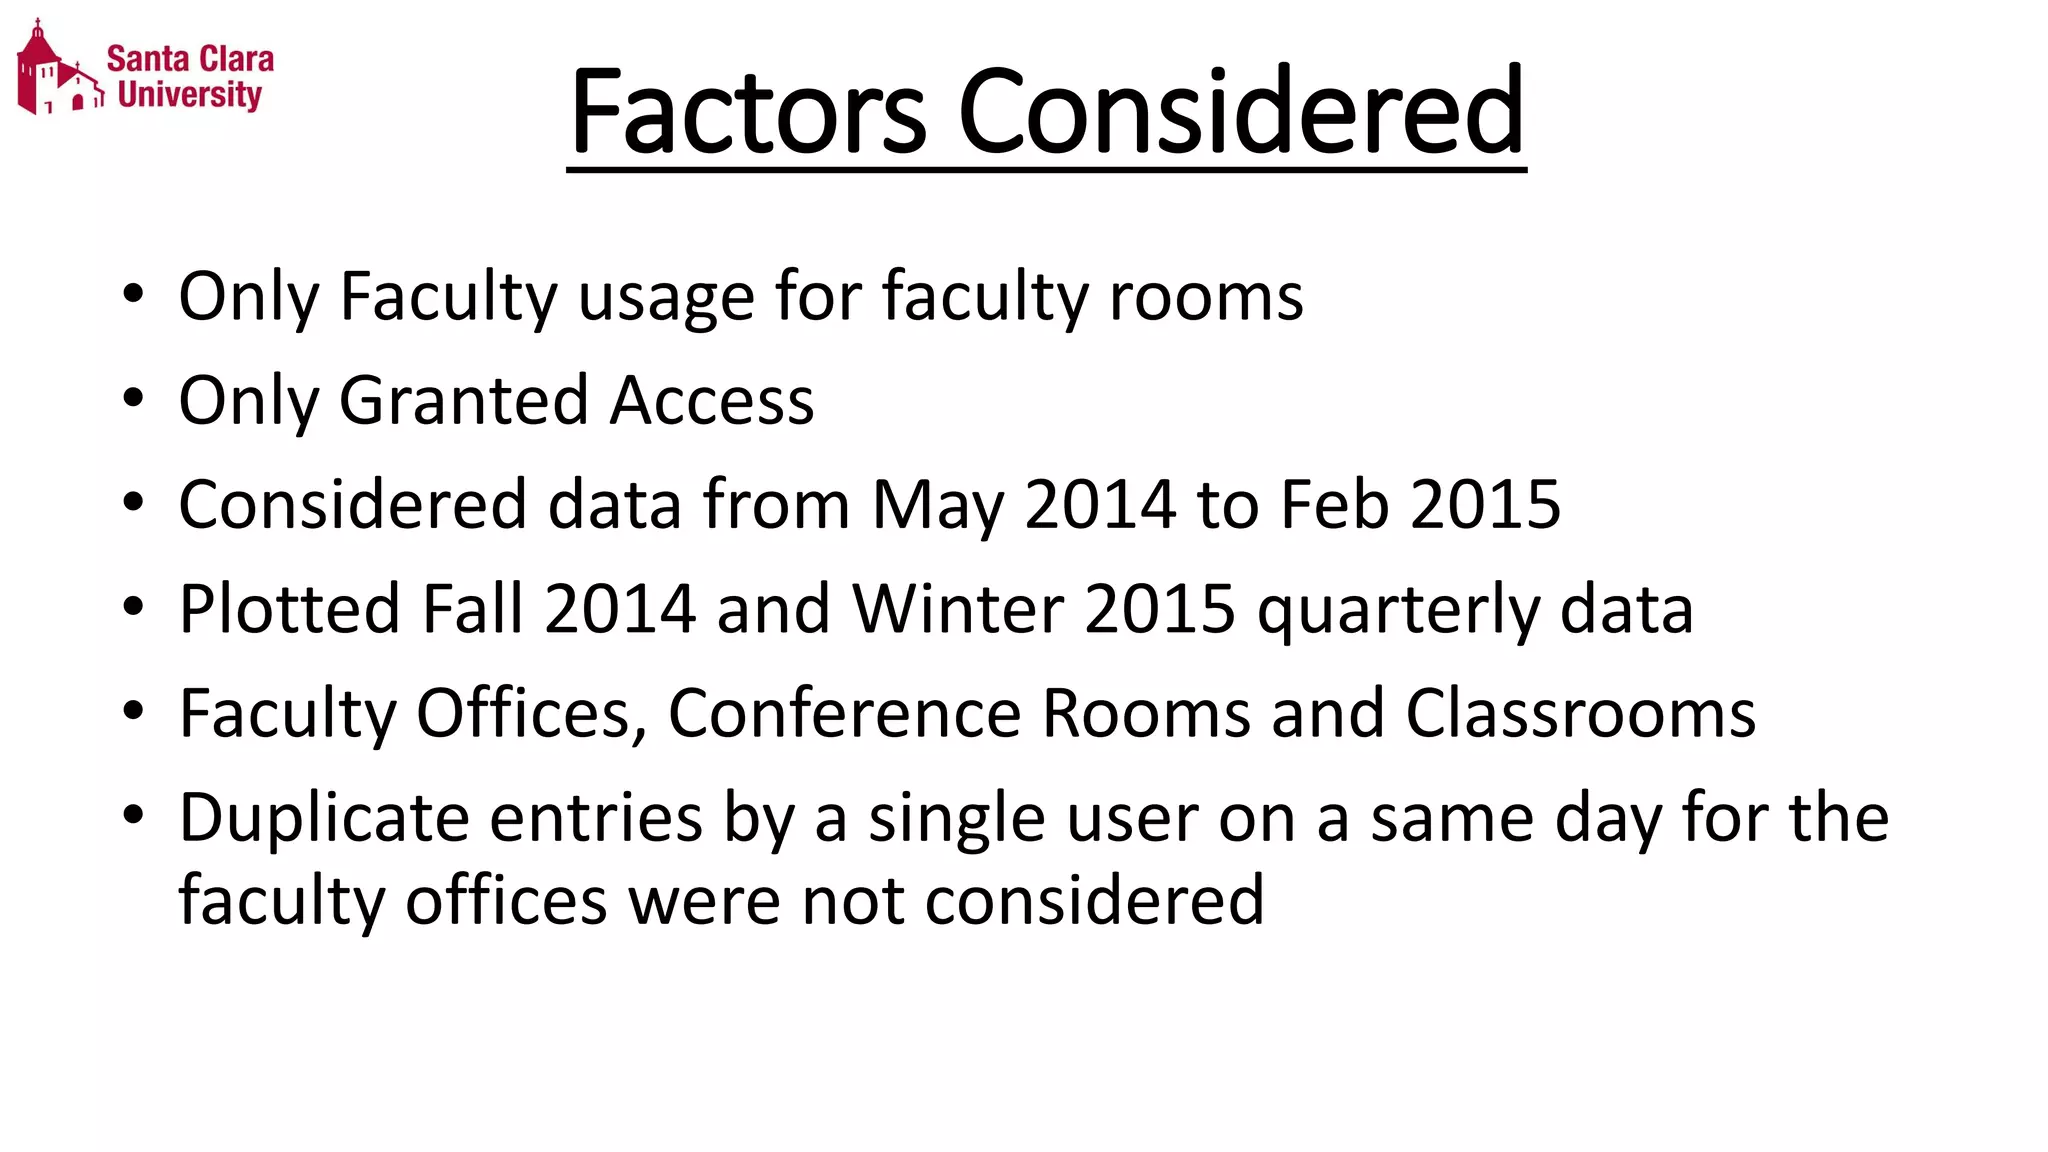
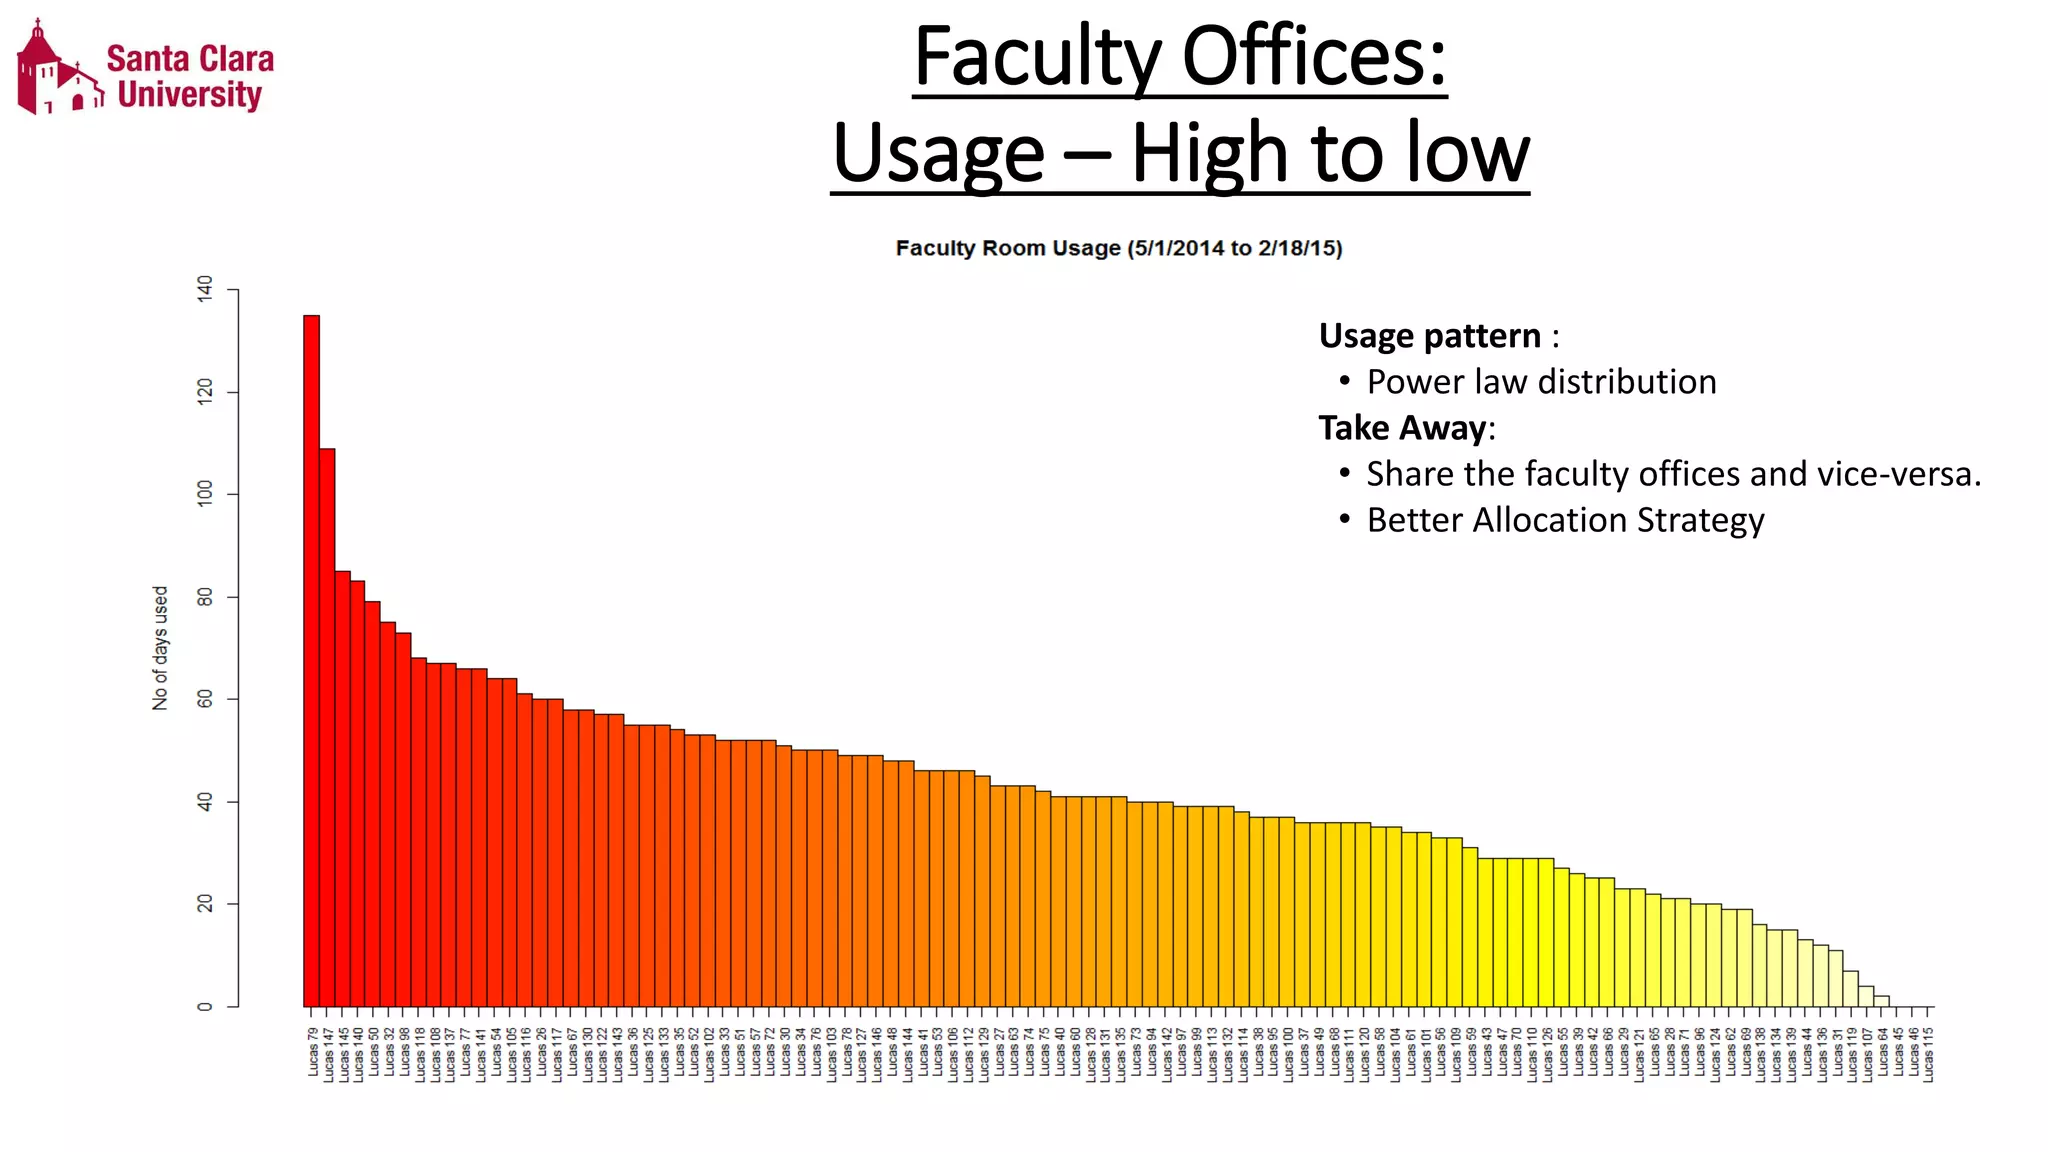
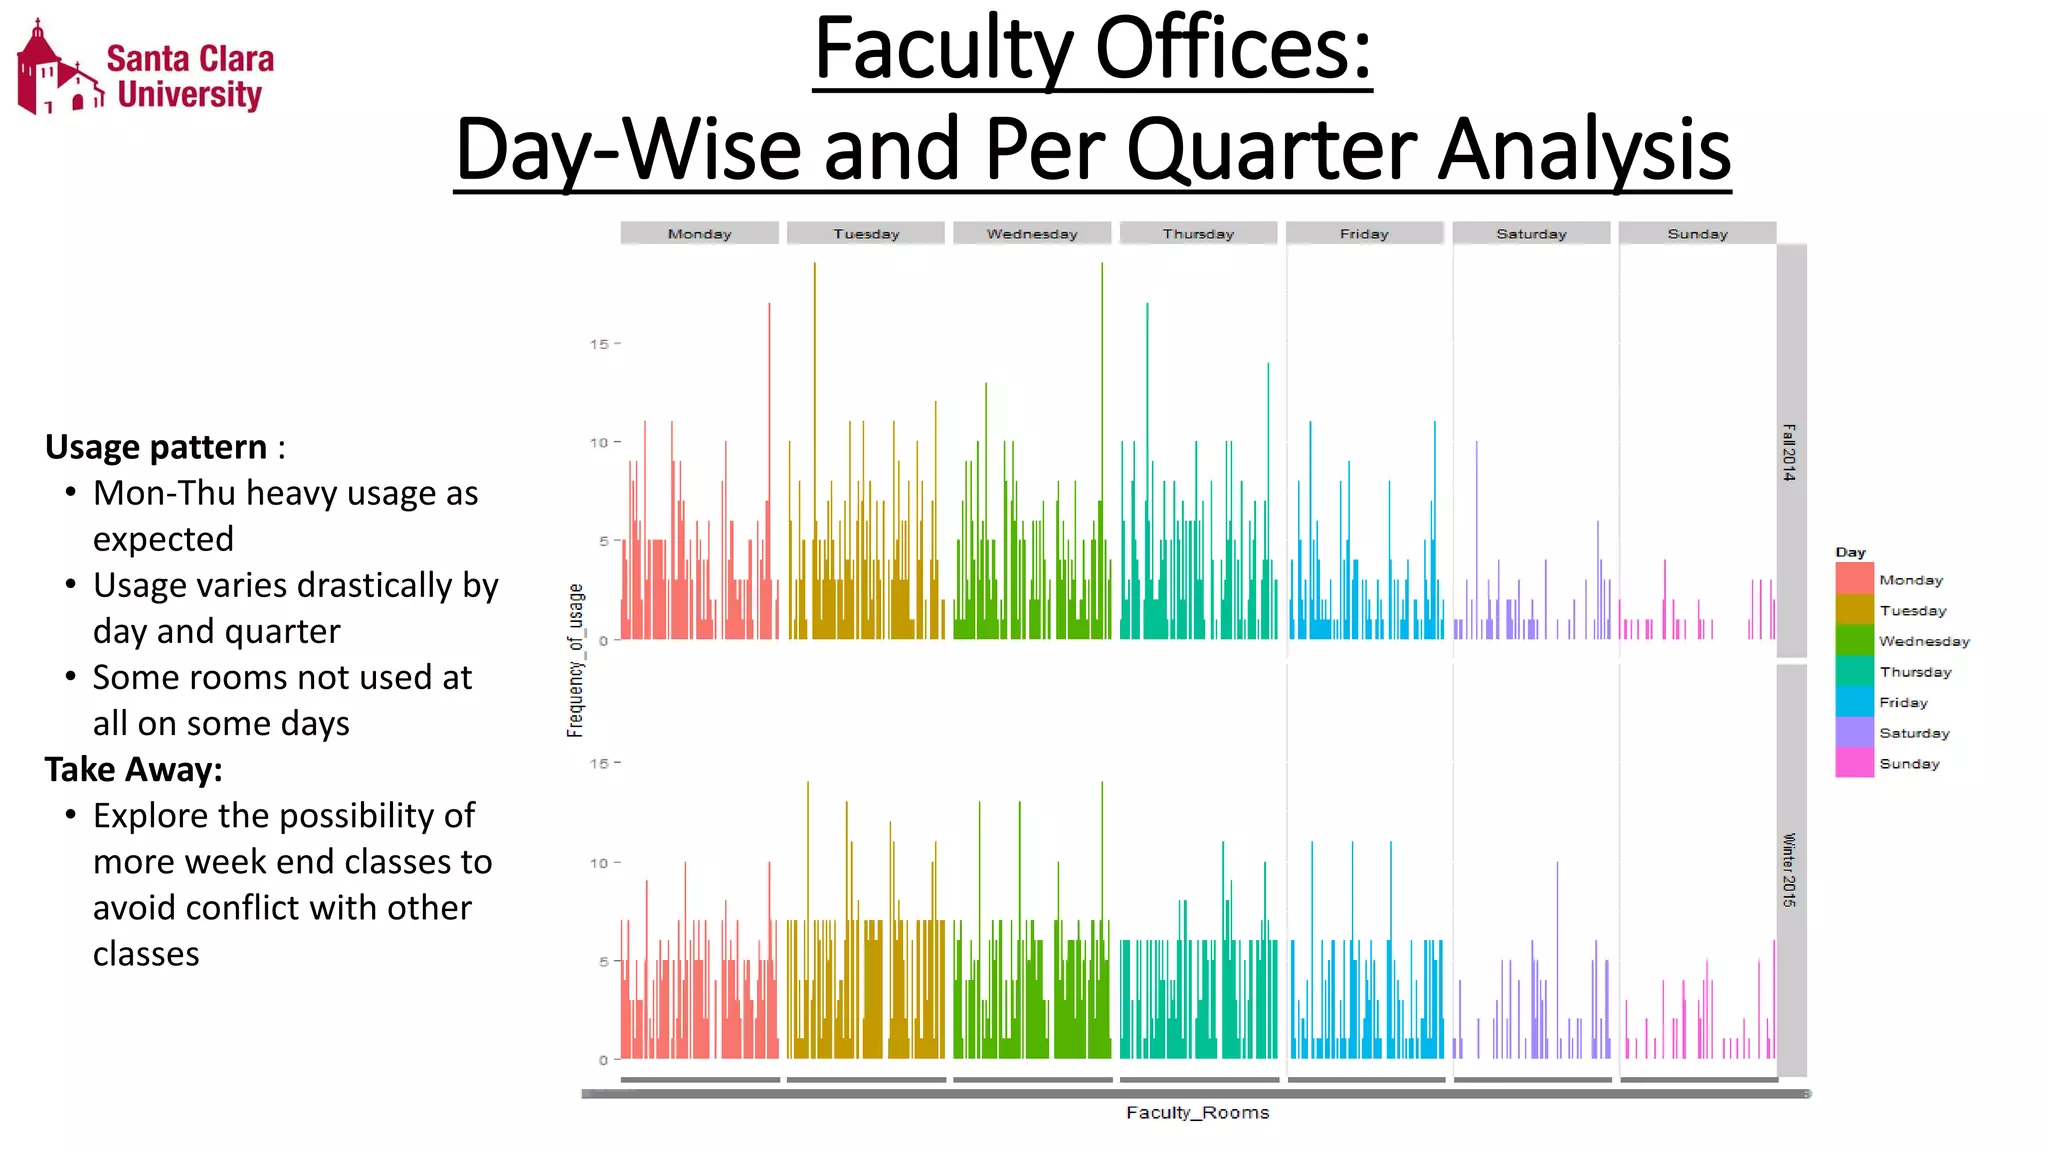
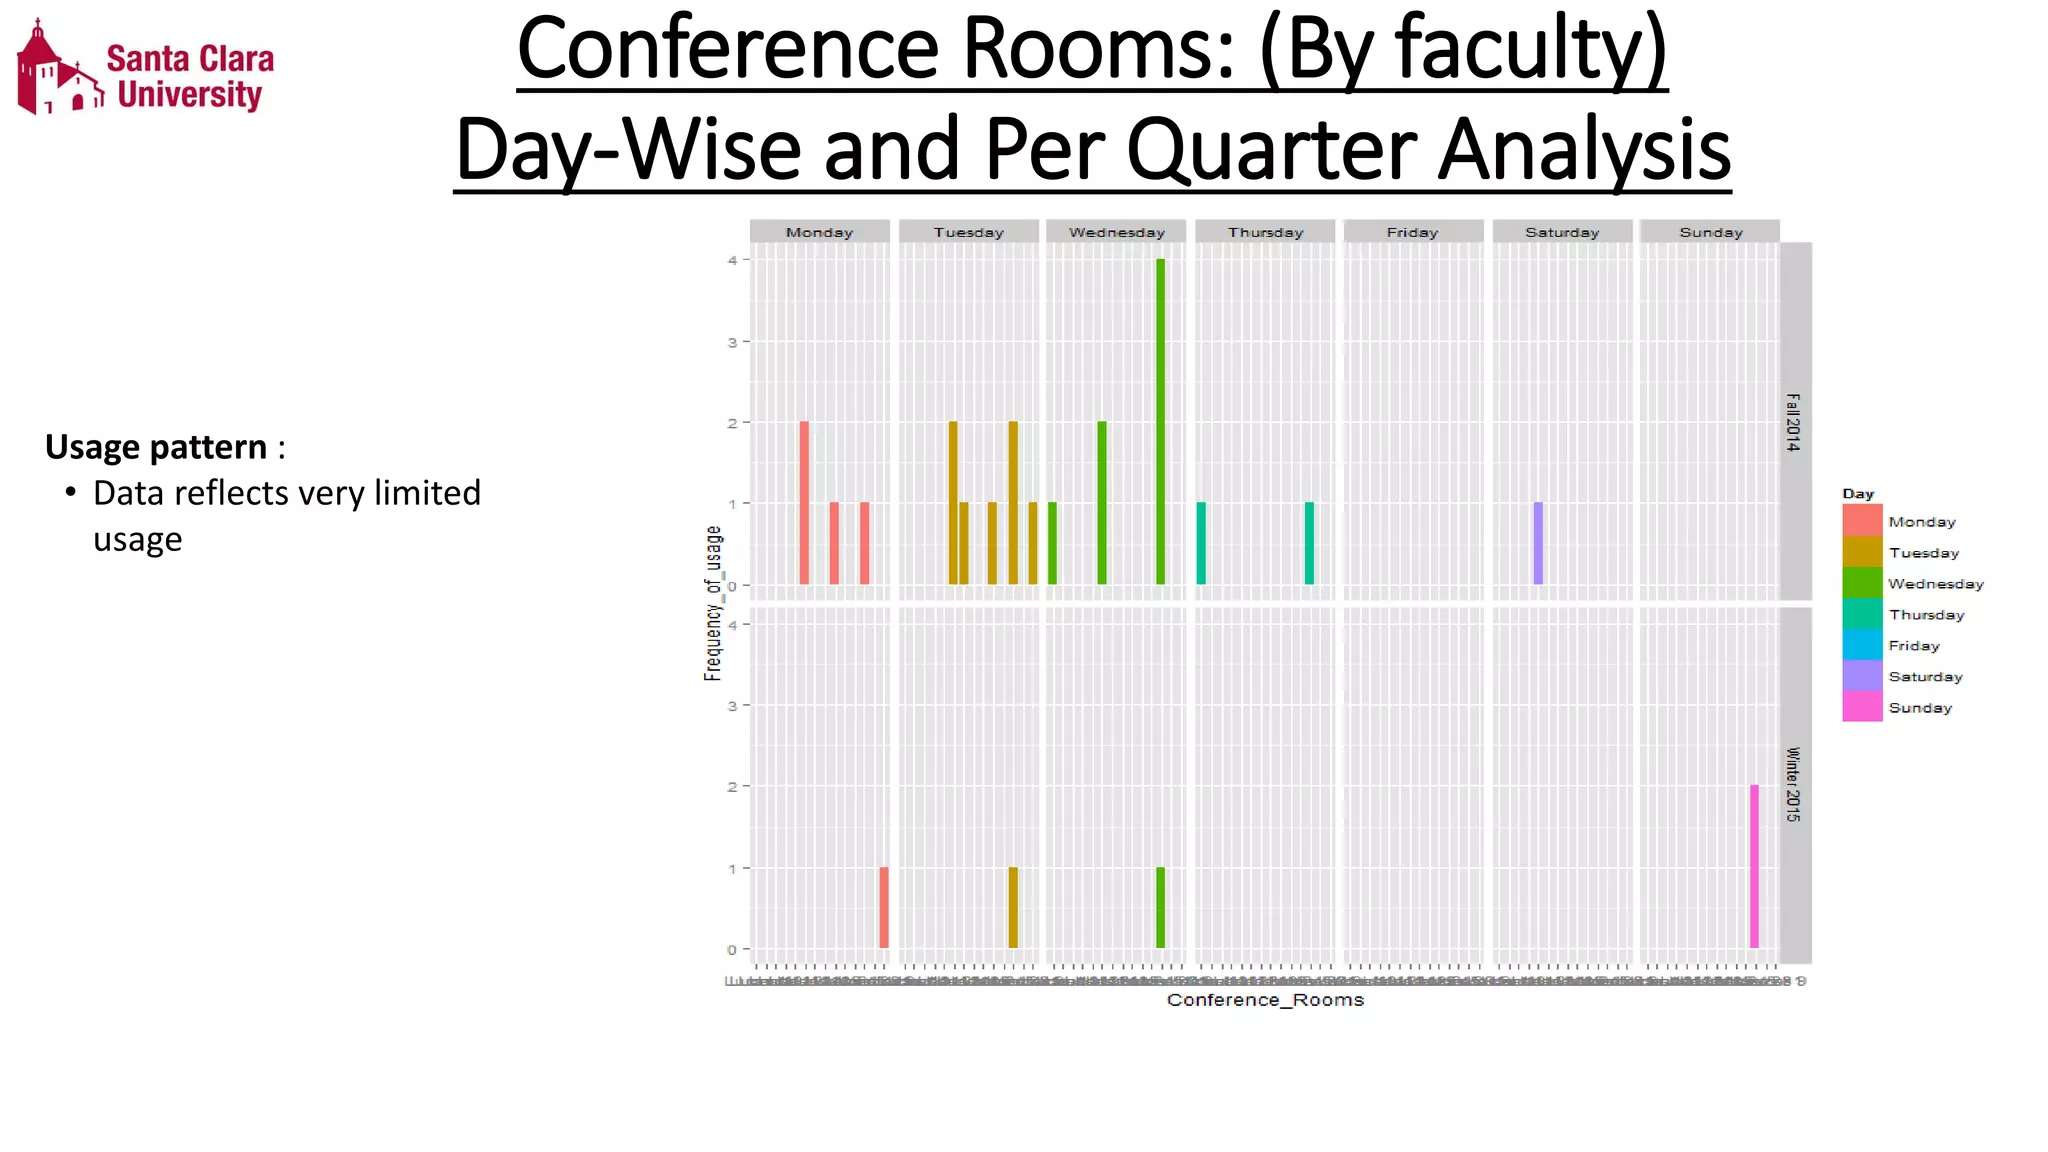
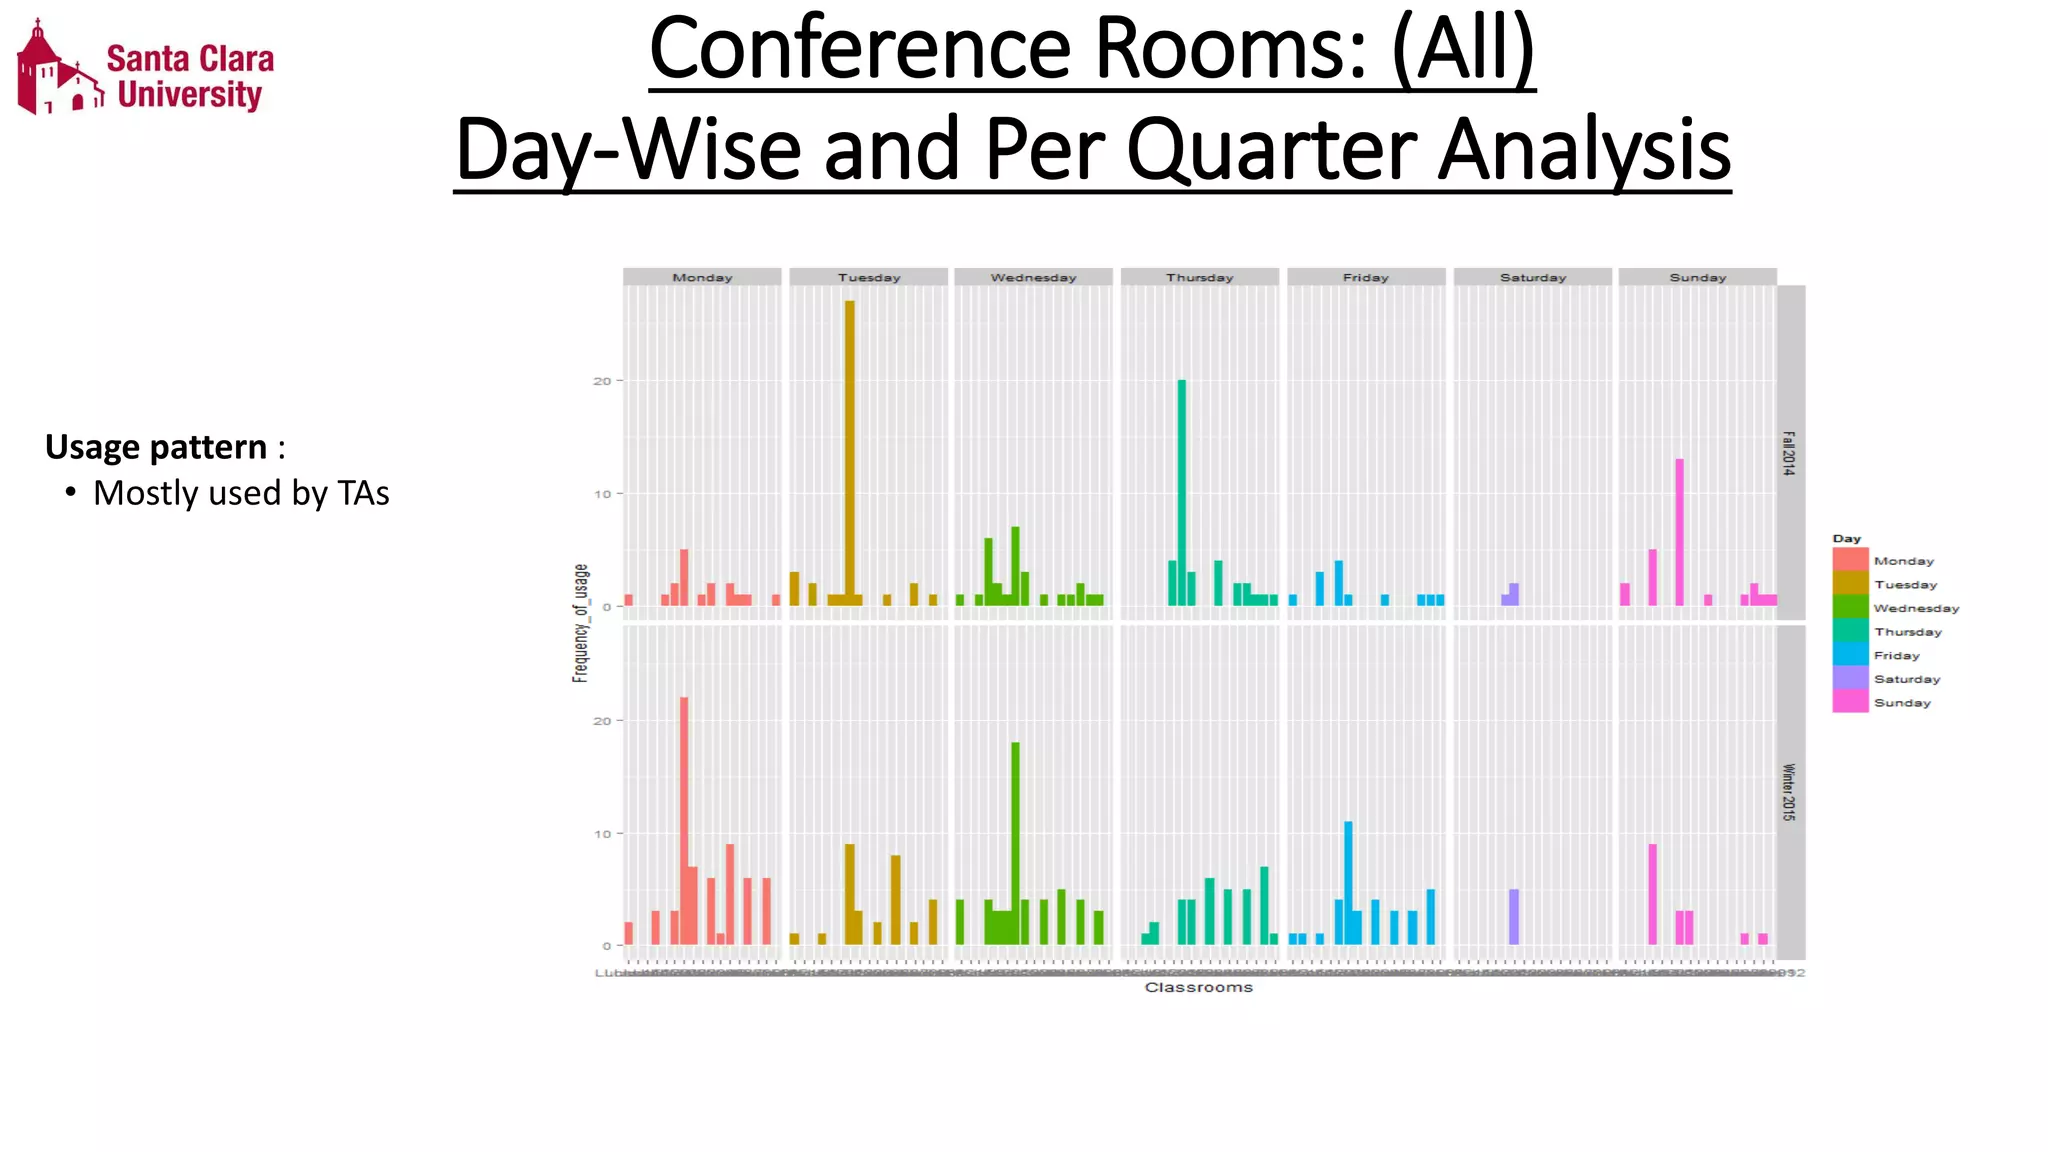
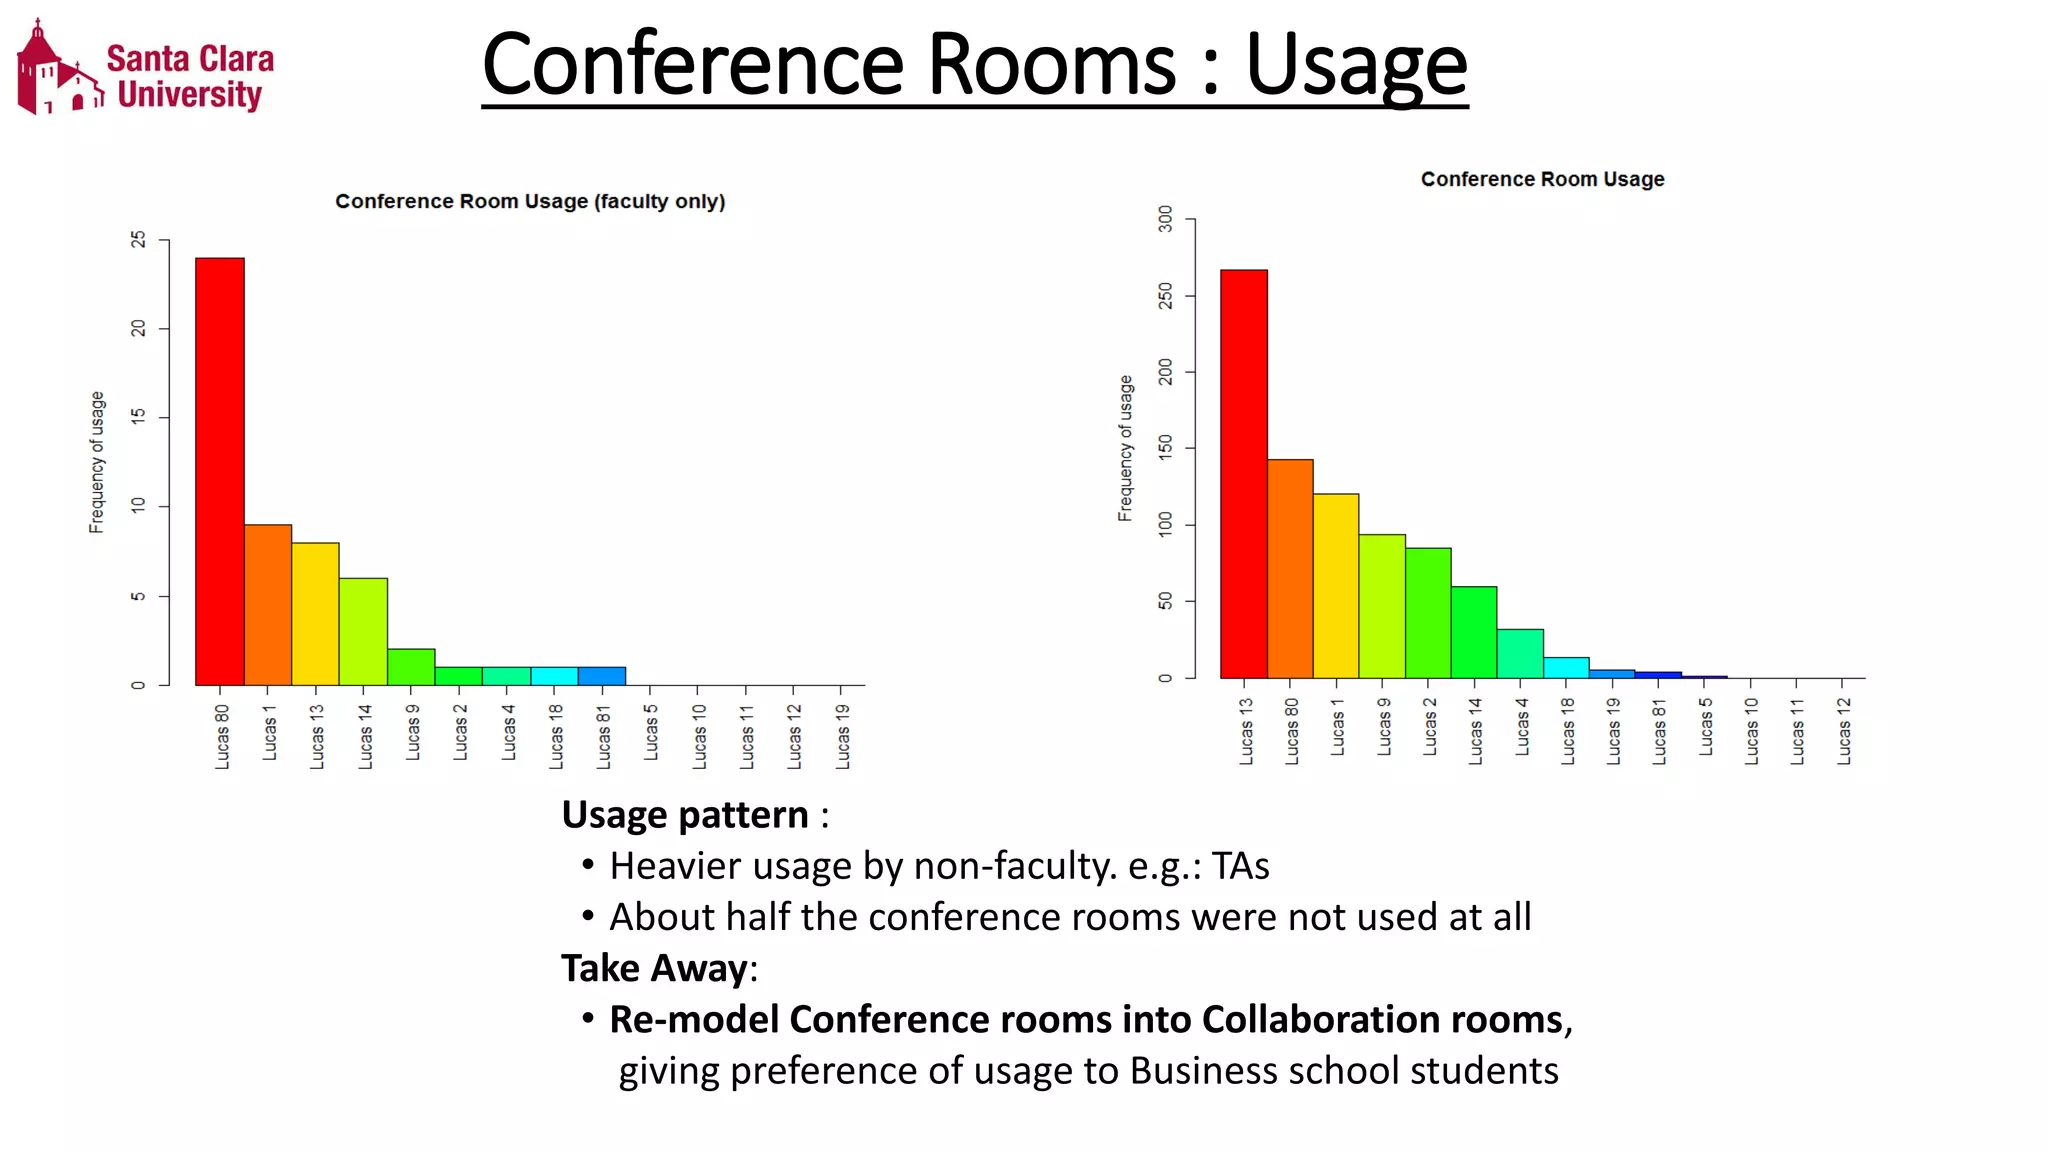
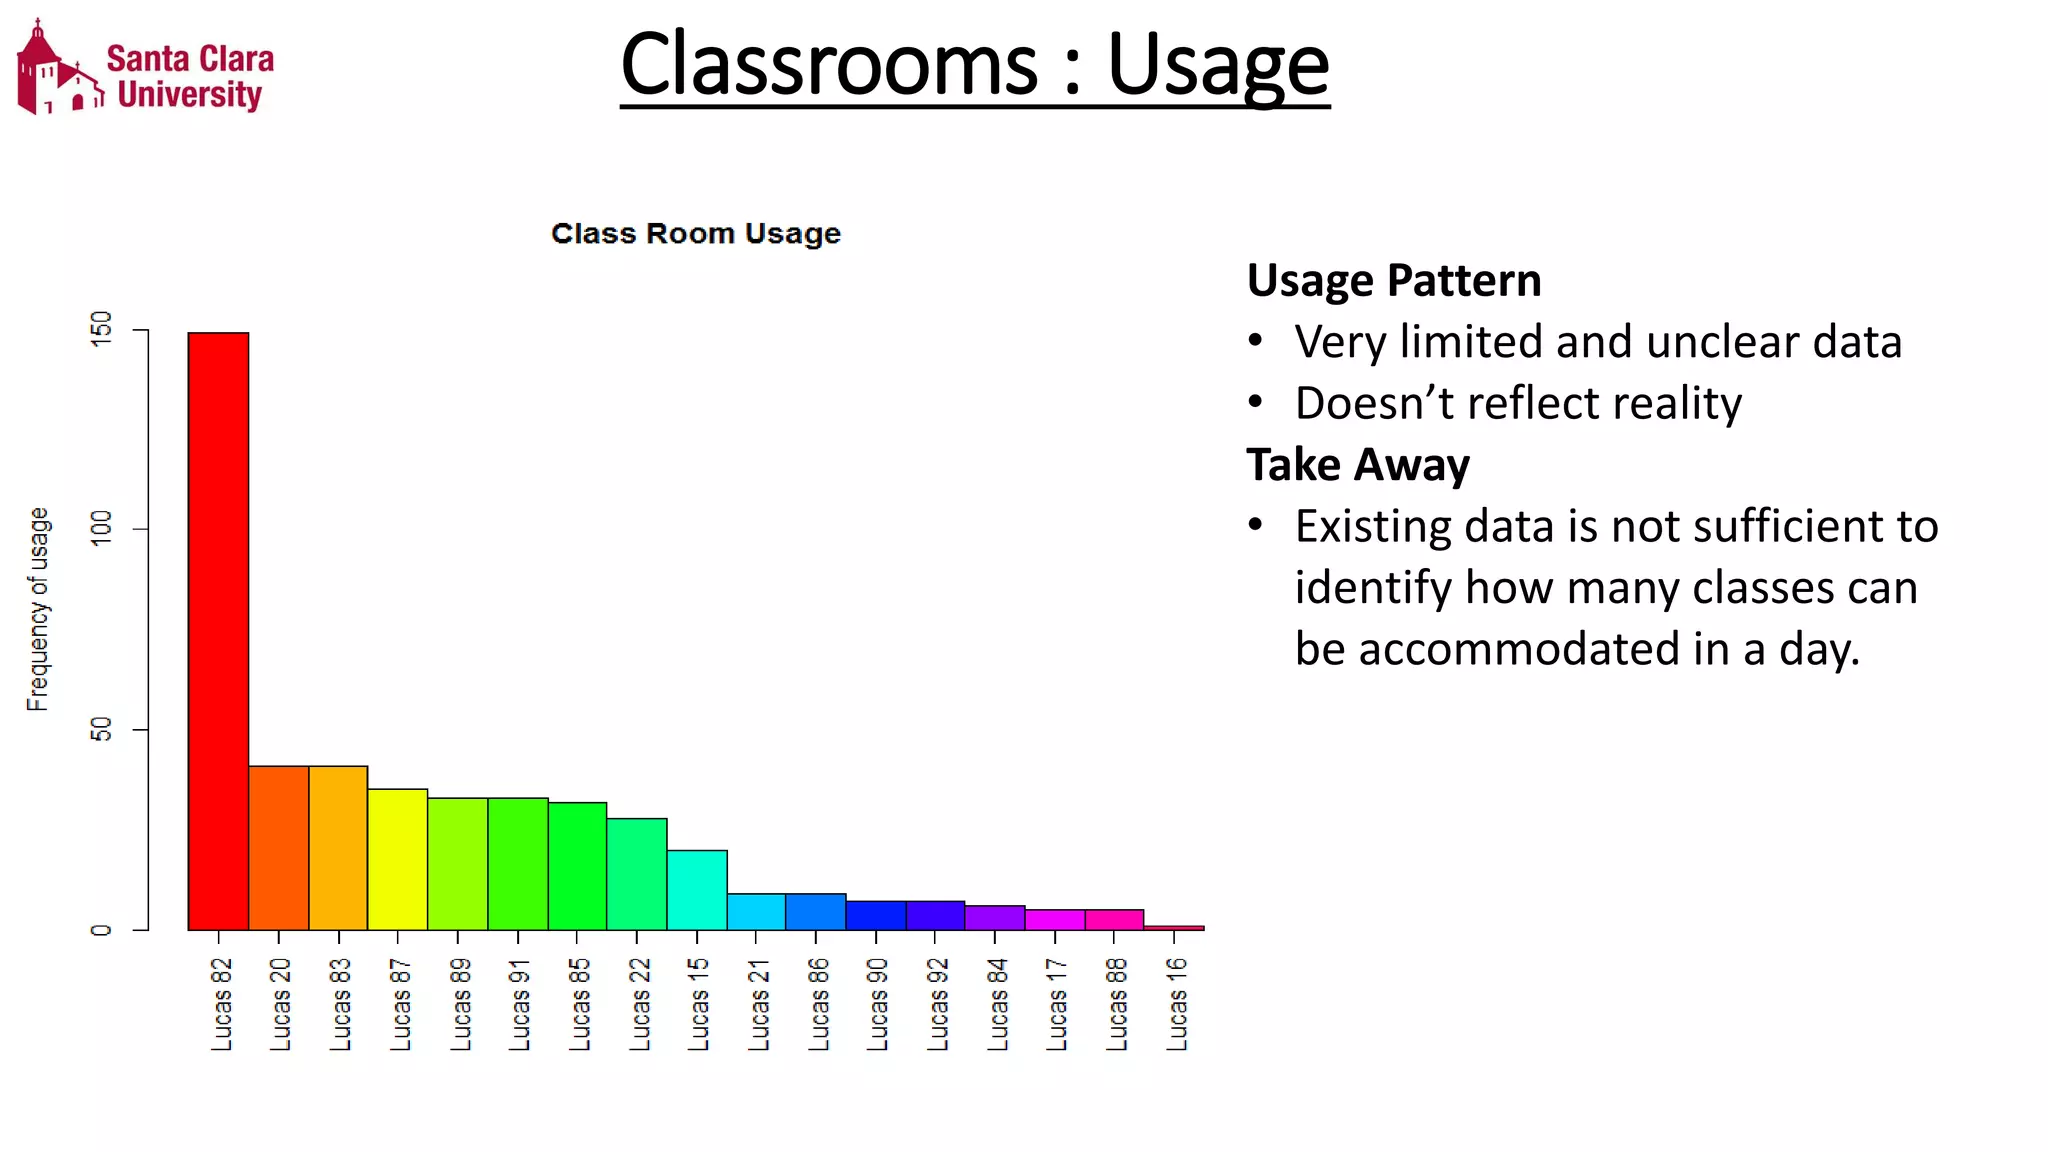

The document analyzes usage patterns of rooms in the Lucas Building to improve utilization. It examines frequency of usage for faculty rooms, conference rooms, classrooms and other rooms. Questions addressed include highest/lowest used rooms, daily/weekly patterns, and time of day usage. Raw user access data from May 2014 to February 2015 is cleaned. Factors considered include only faculty usage for faculty rooms and granted access. Analysis of faculty offices shows power law distribution of usage and varying usage by day and quarter. Conference room usage reflects limited use, mostly by TAs. Classroom data is insufficient to determine accommodated classes per day. Interactive plots examine relationships between room types, time, days, and months. Enhancements and limitations are discussed


