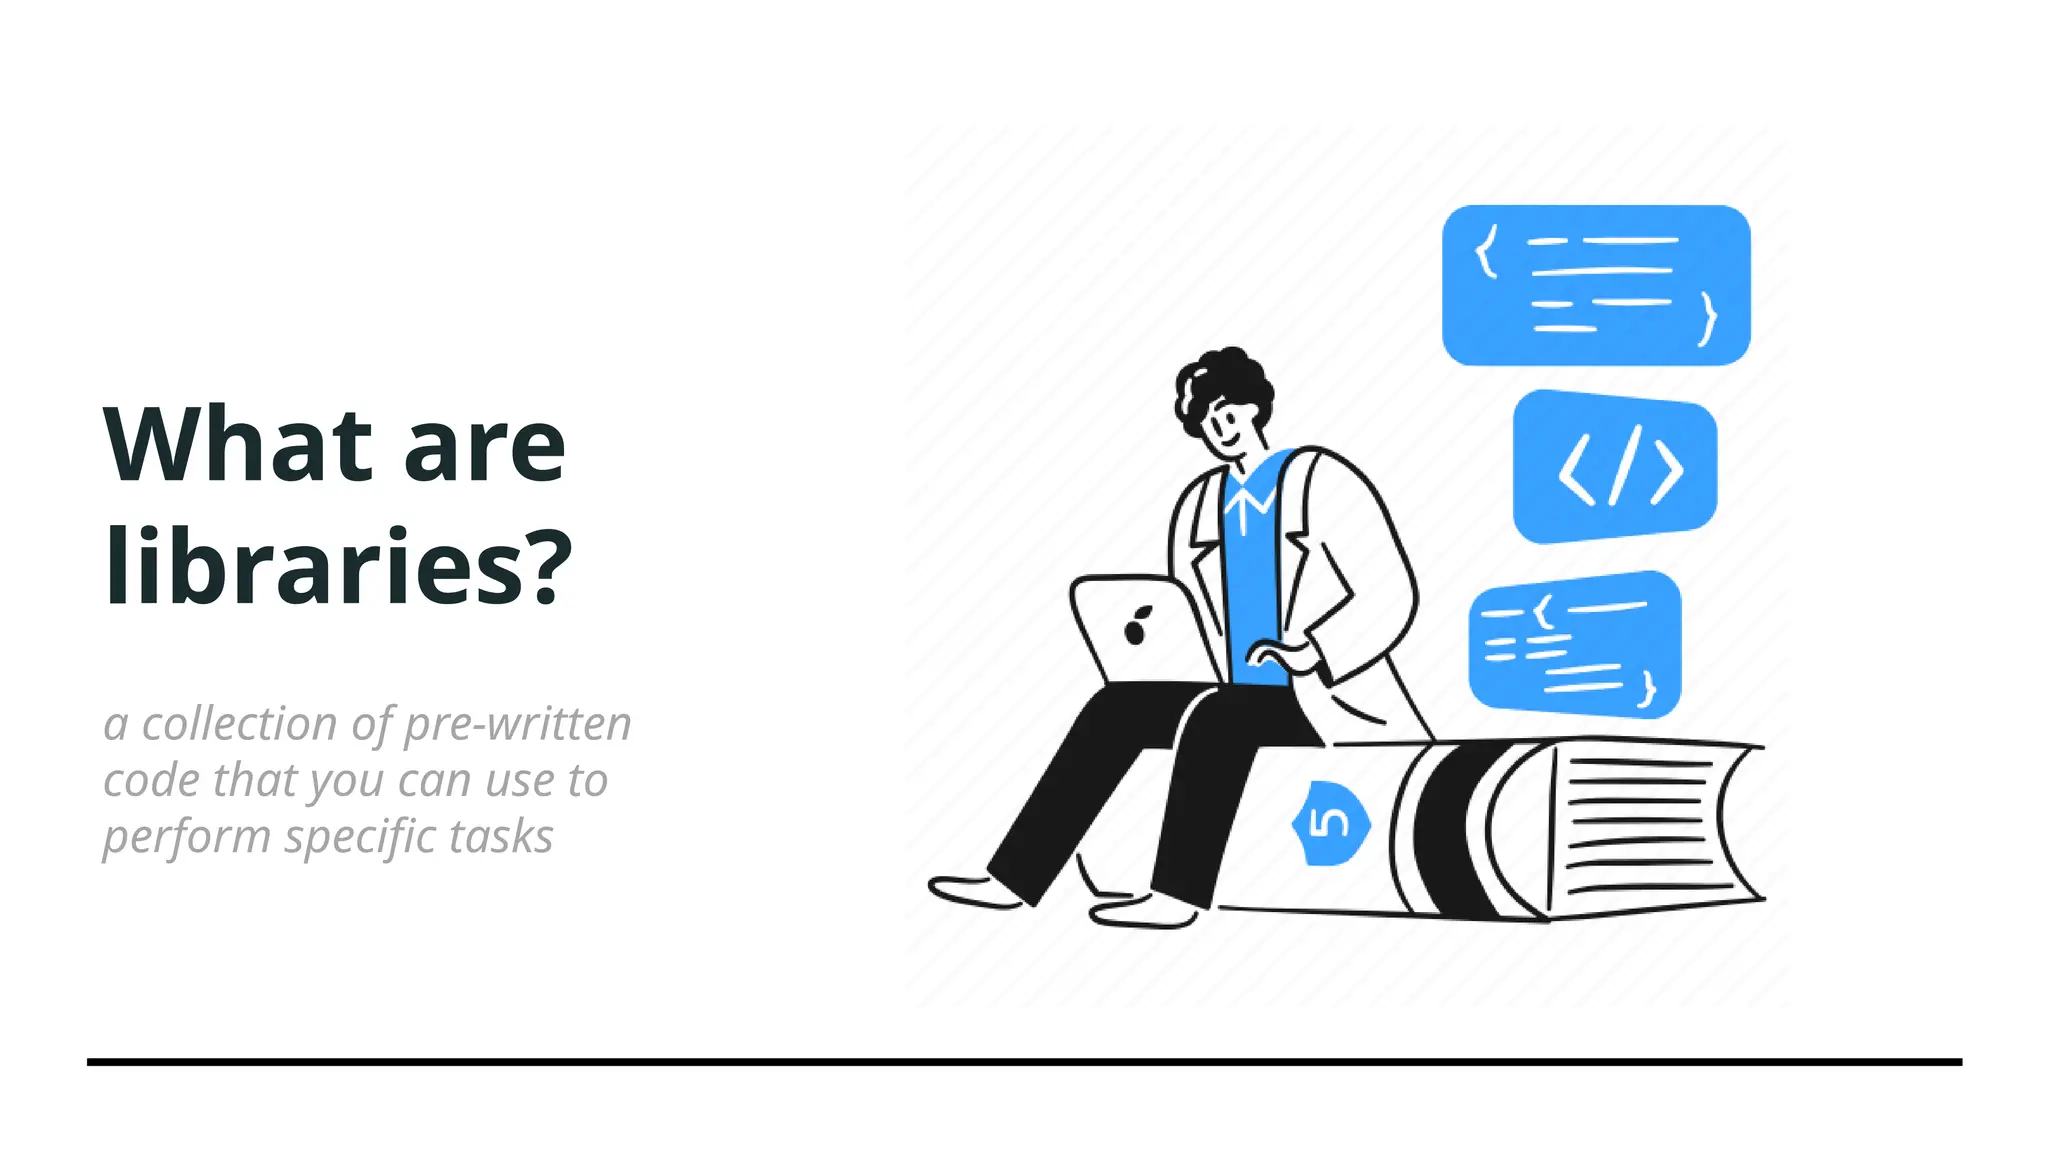
Python for Data Analytics
What is Data analytics?
Fields/ Roles • Marketing analyst
• HR/ payroll analyst
• Financial analyst
• Risk analyst
• Healthcare analyst
• Business analyst
• Operations analyst
• Data analytics consultant
• Data specialist
Why use
python?
What are
libraries?
a collection of pre-written
code that you can use to
perform specific tasks
Types of
Libraries used
for Data
Analytics
Pandas Matplotlib
What are
Virtual
Enviroments.
are self-contained, isolated spaces where
you can install specific versions of software
packages, including dependencies, libraries,
and Python versions.
This isolation helps avoid conflicts between
package versions and ensures that your
projects have the exact libraries and tools
they need.
***we will be using Anaconda.
Introduction to
Pandas
What is Pandas?
•Pandas is a Python library for data manipulation and analysis.
•It provides easy-to-use structures like Series (1D) and DataFrame (2D).
•It’s widely used in data science, machine learning, and financial analysis.
Why Pandas?
•Handles large datasets efficiently.
•Provides built-in functions for cleaning and transforming data.
•Works well with other libraries like NumPy and Matplotlib.
The data produced by Pandas is often used as input for plotting functions in Matplotlib, statistical analysis in SciPy, and
machine learning algorithms in Scikit-learn.
Now to
vscode!
Introduction to
Matplotlib
“Matplotlib is a comprehensive library for creating static, animated, and interactive
visualizations in Python. Matplotlib makes easy things easy and hard things possible.”
Matplotlib Pyplot
Pyplot is a module within Matplotlib that provides a MATLAB-like interface for making plots.
It simplifies the process of adding plot elements such as lines, images, and text to the axes
of the current figure.
Now to
vscode!
Intro to ML
(1)
Linear Regression
Intro to ML
(2)
Polynomial Regression

Python for Data Analytics and ML examples

  • 1.
    Python for DataAnalytics
  • 2.
    What is Dataanalytics?
  • 3.
    Fields/ Roles •Marketing analyst • HR/ payroll analyst • Financial analyst • Risk analyst • Healthcare analyst • Business analyst • Operations analyst • Data analytics consultant • Data specialist
  • 4.
  • 5.
    What are libraries? a collectionof pre-written code that you can use to perform specific tasks
  • 6.
  • 7.
  • 8.
    What are Virtual Enviroments. are self-contained,isolated spaces where you can install specific versions of software packages, including dependencies, libraries, and Python versions. This isolation helps avoid conflicts between package versions and ensures that your projects have the exact libraries and tools they need. ***we will be using Anaconda.
  • 9.
    Introduction to Pandas What isPandas? •Pandas is a Python library for data manipulation and analysis. •It provides easy-to-use structures like Series (1D) and DataFrame (2D). •It’s widely used in data science, machine learning, and financial analysis. Why Pandas? •Handles large datasets efficiently. •Provides built-in functions for cleaning and transforming data. •Works well with other libraries like NumPy and Matplotlib. The data produced by Pandas is often used as input for plotting functions in Matplotlib, statistical analysis in SciPy, and machine learning algorithms in Scikit-learn.
  • 10.
  • 11.
    Introduction to Matplotlib “Matplotlib isa comprehensive library for creating static, animated, and interactive visualizations in Python. Matplotlib makes easy things easy and hard things possible.” Matplotlib Pyplot Pyplot is a module within Matplotlib that provides a MATLAB-like interface for making plots. It simplifies the process of adding plot elements such as lines, images, and text to the axes of the current figure.
  • 12.
  • 13.
  • 14.

Editor's Notes

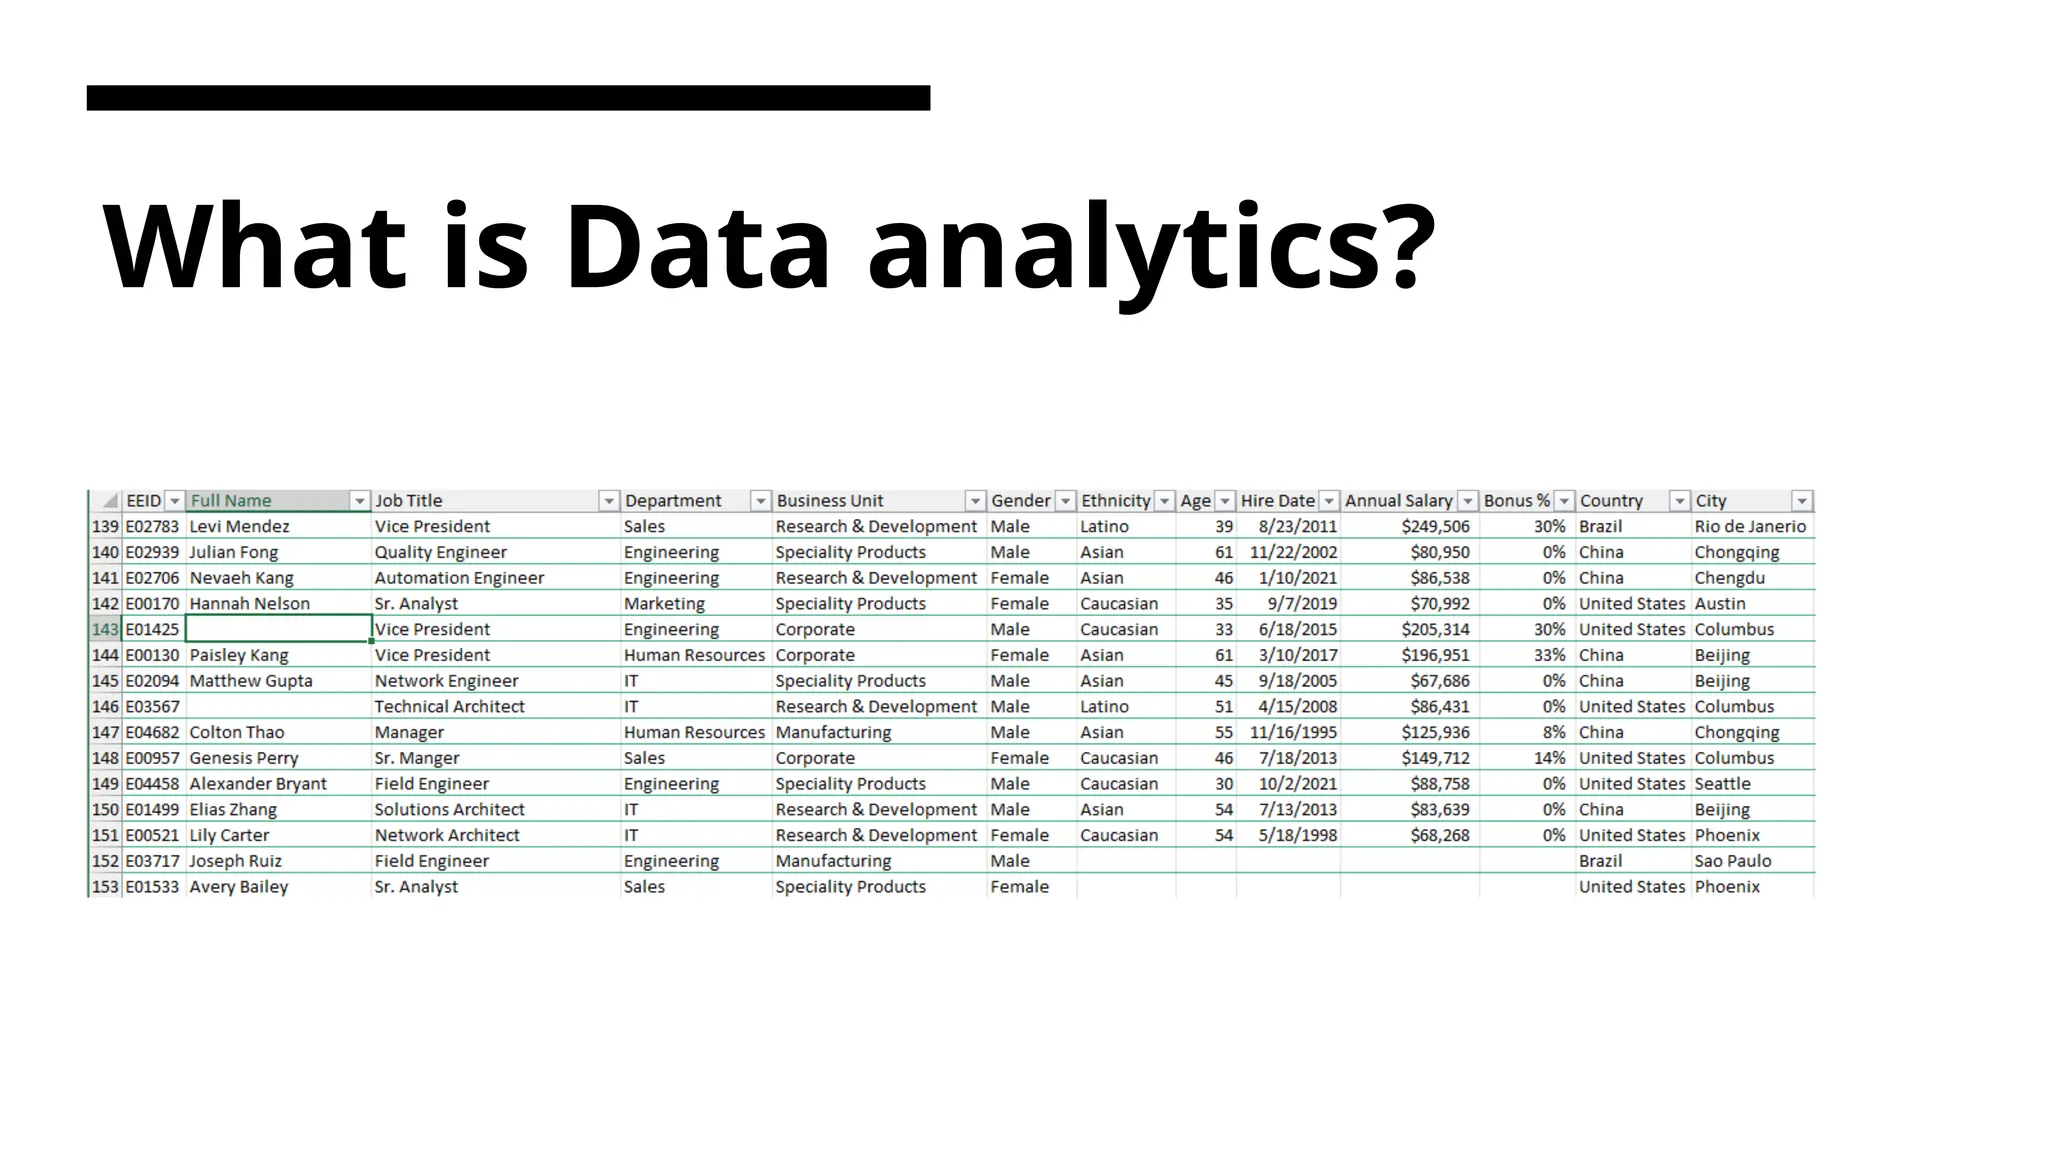
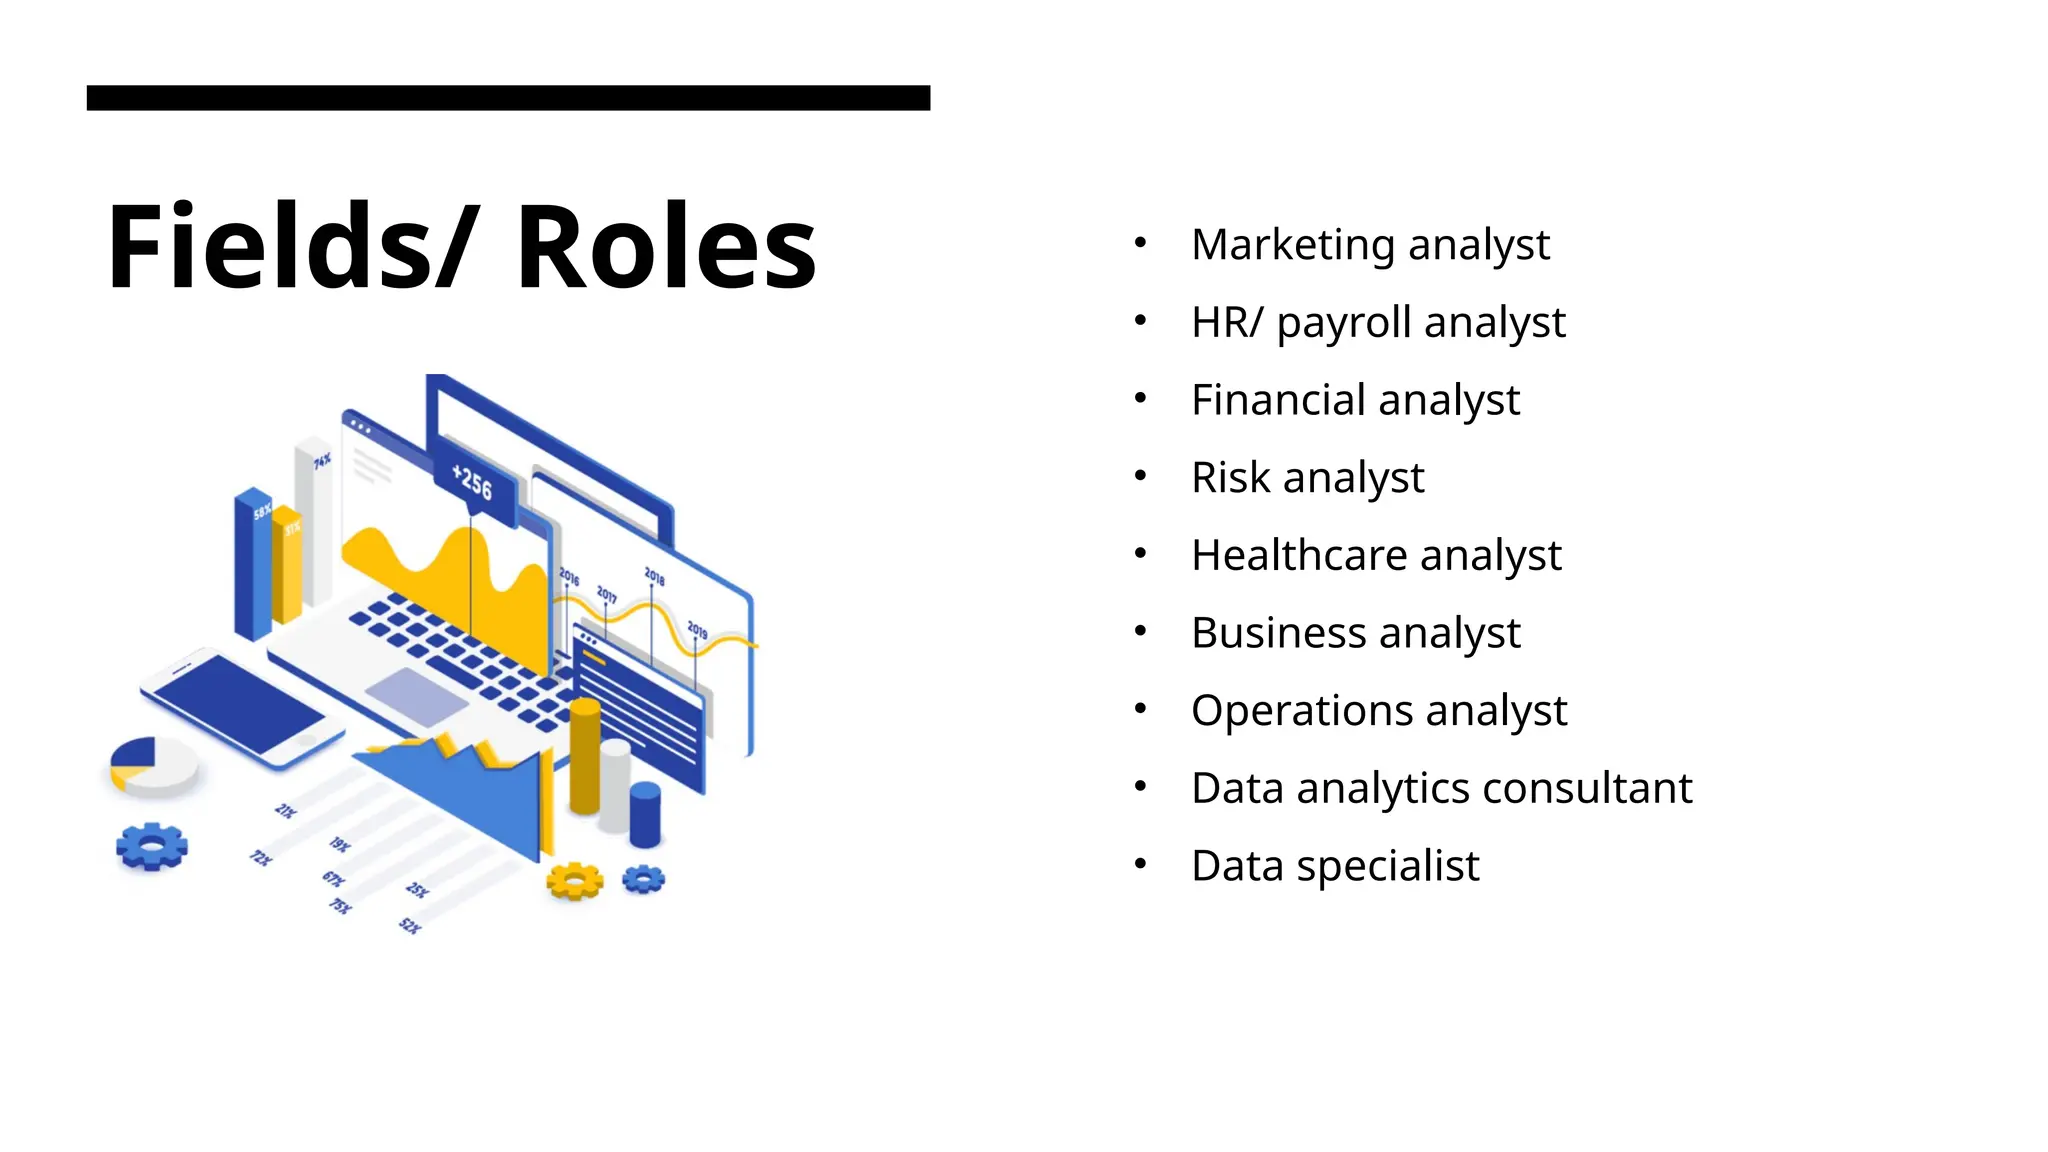
  • #2 Make the why python separate slide. add another slide for fields of data analytics. Add a slide explaining the steps of data analyzing.
  • #4 1- easy to learn and use 2- rich ecosystem of libraries 3- can handle large datasets efficiently 4- automate data cleaning, transformation, and reporting. 5- easily integrate with databases, APIs, and cloud services. 6- community support.
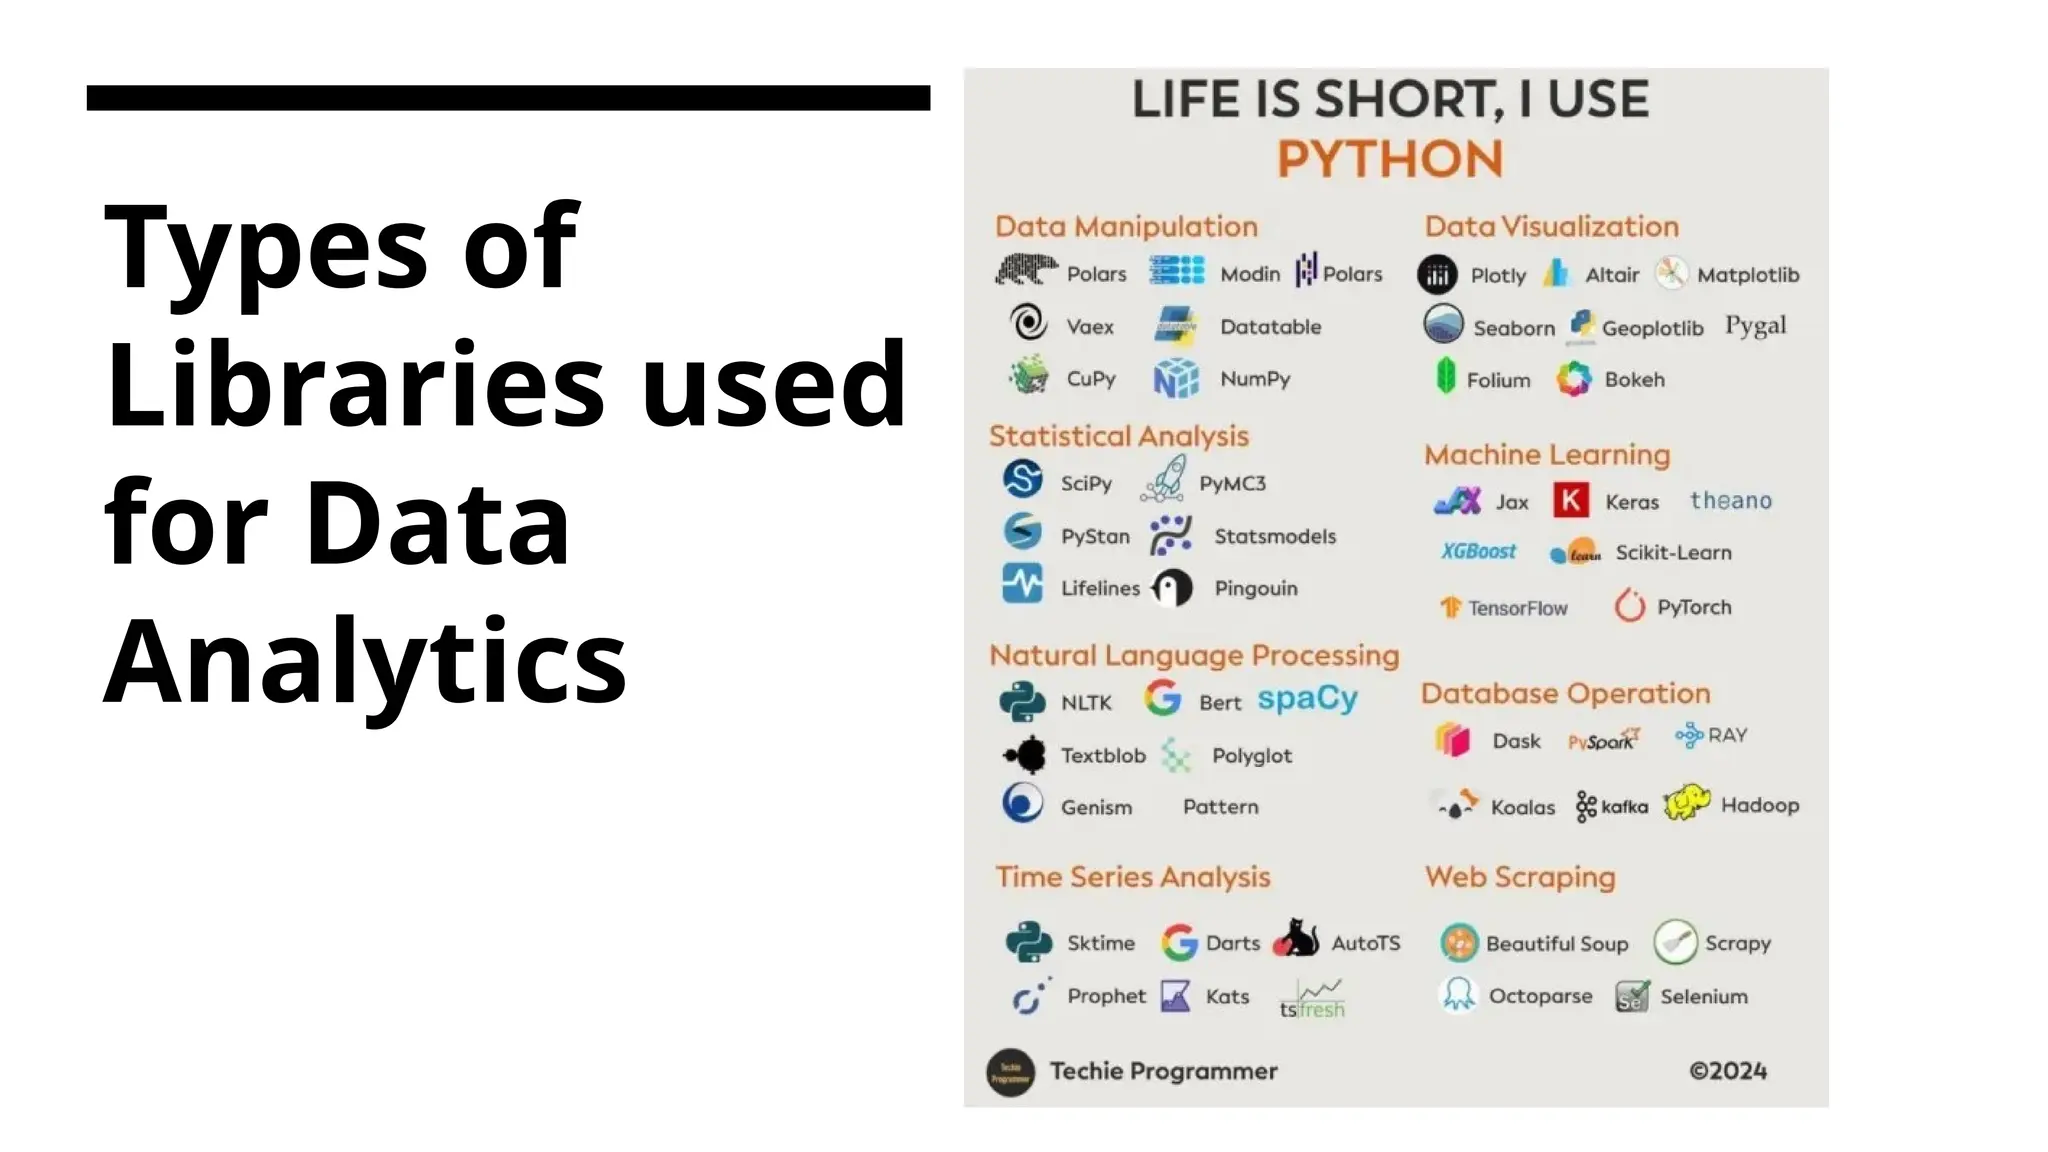
  • #7 Make this slide explain the different types of libraries that could be used and their catogaries. Add a slide explaining why we’re going with pandas and matplotlib
  • #8 Explain why anaconda on a separate slide