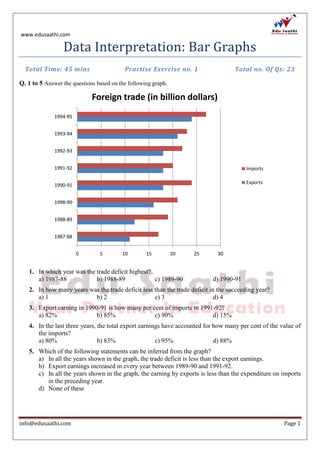
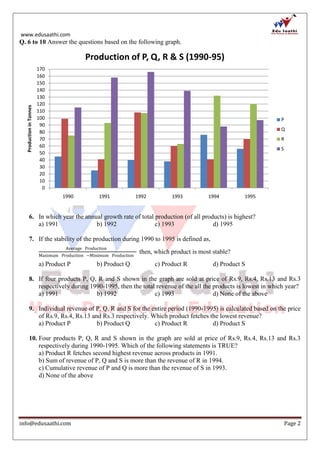
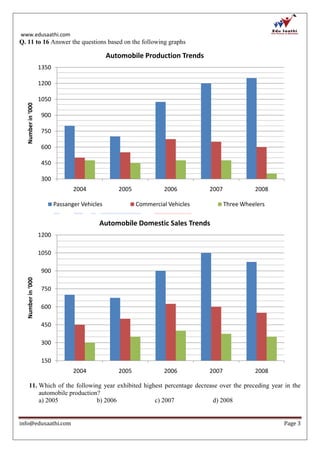
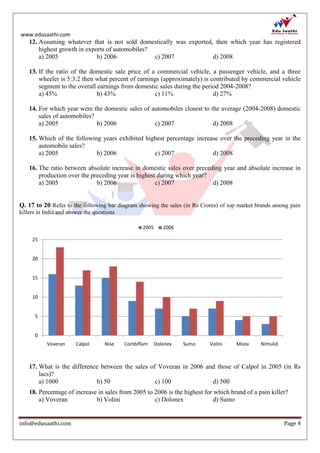
This document contains a 23 question practice exercise on interpreting bar graphs and line graphs related to topics like trade balance, production output, automobile industry trends, retail costs, and pain reliever sales. The questions test understanding of reading graphs to determine highest or lowest values, percentages, inferences that can be made, and relative comparisons between data points.