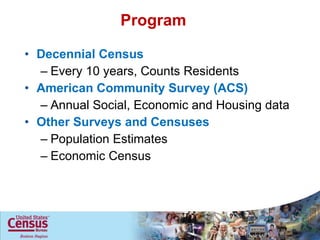
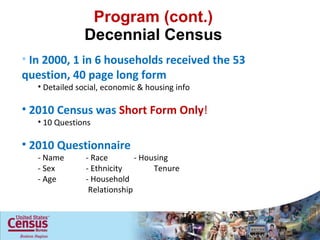
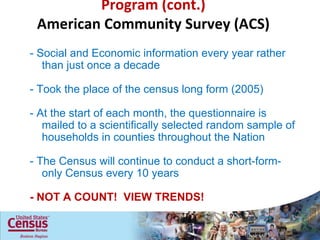
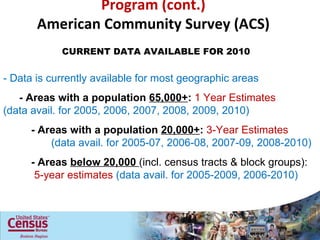
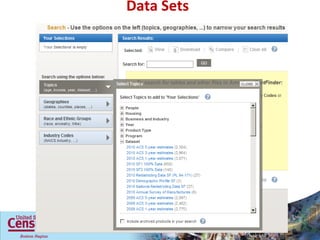
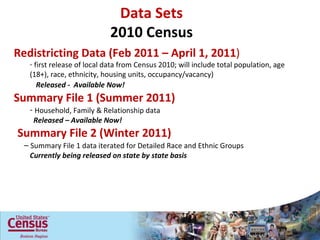
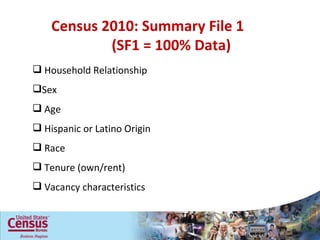
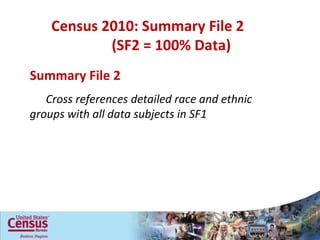
This document summarizes key information about Census data and programs. It outlines the main data sources including the Decennial Census, American Community Survey, Population Estimates, and Economic Census. It describes the types of data available from each source and at what geographic levels. The summaries provide high-level overviews of the Census programs and how to access demographic, social, economic and housing statistics for communities.
The document summarizes various U.S. Census Bureau programs for accessing community data including the Decennial Census which counts residents every 10 years, the American Community Survey which provides annual social and economic data, and other surveys. It provides details on the levels of geographic data available from the Census Tract down to the City Block, and describes what types of data are available from different Census programs over time periods.
Example Citations and Notes for Custom Data PullsKristen Carney
This document provides citations and notes for data from the 2007-2011 American Community Survey conducted by the U.S. Census Bureau. It includes citations for data on characteristics like sex, age, ethnicity, education, poverty, income, and employment status. Notes provide information on the survey methodology, data accuracy, and definitions of terms.
An example of a Demographic Data Report for a Neilsen designated market areas or DMAs. These reports contain basic demographics (i.e. population, race, income, etc.). They are print-ready PDF documents with colorful graphs that you can easily include in your presentations and final reports. This option is a typically good fit if you need demographics for a handful of DMAs.
U.S. Racial Inequity: Snapshots in FiguresDavid Carter
The document discusses racial inequalities in wealth, unemployment, earnings, and income in the United States over several decades according to data from the Institute for Policy Studies and Bureau of Labor Statistics. It shows that the racial wealth divide has grown since 1983, with Black and Latino families twice as likely to have zero wealth. Black unemployment has consistently been about twice as high as white unemployment from 2010 to 2019. Median weekly earnings and household income also differ significantly between races in many metro areas.
The document discusses the 2010 Census and how to locate data from it using the American FactFinder. It notes that the 2010 Census collected only short form data and that detailed social, economic, and housing data is now from the American Community Survey. It outlines the different data sets available from the 2010 Census, including redistricting data, demographic profiles, and summary files. It also provides an overview of census geography terms like census blocks, tracts, and counties.
The document discusses various data sources that can be used for community needs assessments, including Census data, Neighborhood Scout, Kids Count, and Michigan school data. It provides details on accessing demographic and socioeconomic information from the Census Bureau at the city, ZIP code, and census tract level. It also describes how to obtain data on real estate, crime rates, and education metrics from Neighborhood Scout, Kids Count, and the Michigan Department of Education website.
This document summarizes demographic trends in North Carolina through 2035. It finds that North Carolina's population will continue growing, reaching over 12 million by 2035, with growth concentrated in urban areas like Raleigh, Charlotte, and Greensboro. An aging population and declining numbers of children and young adults in many counties will shape North Carolina's future demographics. The state will also see growing demand for housing as its population increases.
We have hired 1 person for IT, saving $25,000 while strengthening our dedicated fiber and adding 24/7 support. IT regionalization has allowed us to hire more staff and save money by sharing resources, making our technology infrastructure more robust with around-the-clock assistance.
The document summarizes the state of IT in Massachusetts government and outlines MassIT's priorities and initiatives to improve digital services. MassIT aims to drive digital transformation across state agencies and support local governments. It discusses findings from an IT review that found low citizen satisfaction with digital services and immature security practices. MassIT plans to invest in core infrastructure, partner with local governments, and facilitate regional collaboration on IT projects and shared services.
The document summarizes a community forum held in Ashland, Massachusetts to discuss updating the town's comprehensive plan. It provides an overview of the comprehensive planning process and progress made so far in developing Ashland's plan, including outreach activities and draft goals in key areas like land use, housing, economic development, and transportation. The forum included a presentation of the draft community vision statement and goals, followed by small group discussions for residents to provide input and prioritize goals to guide future growth. The next steps in the planning process were also outlined.
The Town of Ashland has a thriving community with engaged residents, businesses, and leaders who work together towards common goals of sustainability, regional collaboration, and excellence in education. Ashland maintains a strong infrastructure and economy to support its diverse population with various housing, transportation, employment, and environmental opportunities. The community aims to be sustainable, vibrant, and welcoming to all ages through coordinated efforts outlined in the Ashland Comprehensive Plan.
The document outlines draft land use, housing, economic development, and transportation goals for Ashland. For land use, the top three priorities should be GOAL 1 (accommodate development/preservation through zoning), GOAL 2 (support mixed-use development), and GOAL 3 (consider form-based code). For housing, the top three are GOAL 1 (preserve affordability), GOAL 3 (ensure affordability throughout town), and GOAL 6 (promote diverse/affordable housing). For economic development, the top three are GOAL 1 (vibrant development along corridors/downtown), GOAL 2 (provide planning/technical assistance), and GOAL 3 (implement public facilities/utilities
The Town of Ashland has a thriving community with engaged residents, businesses, and leaders who work together toward common goals of sustainability, regional collaboration, and excellence in schools. Ashland maintains a strong infrastructure and economy with diverse housing, retail, work, and community spaces. The town is committed to environmental stewardship and transportation options while supporting a vibrant downtown, neighborhoods, and quality of life for all ages and backgrounds.
The document discusses municipal IT collaboration between local governments and school departments. It provides examples of how the Town of Foxborough, MA and Foxborough Public Schools have collaborated on their joint IT operations. They have formed a technology steering committee with stakeholders to identify common needs, prioritize projects, and oversee the shared IT department. The collaboration has allowed them to hire additional IT staff and achieve cost savings while improving services. Overcoming barriers involves managing expectations, communication, and planning for the future.
The document outlines Arlington's IT strategic planning process, including putting together a team, engaging stakeholders, and setting benchmarks. It discusses the core components of the plan, including establishing a vision and mission, inventorying existing IT systems, and defining action steps and measurable outcomes. The plan aims to define the role of the IT department, improve relationships with stakeholders, manage the IT workload, and analyze the network.
Draft recommendations presented by Chris Kuschel of the Metropolitan Area Planning Council at the second public forum of the Natick Center Plan, February 10, 2016, Natick, MA.
The decennial census determines the allocation of hundreds of billions of federal program dollars. Federal agencies and private entities use data on race, ethnicity, national origin, sex, age, and disability to determine where disparities exist and where community groups could assist. This workshop brings together professionals working to collect data for the census to discuss recently analyzed data with community groups searching for information to support program objectives and goals.
Nonprofits are asked to "tell their story" to funders, to their board, and to the community. This short slideshow was part of an online training on how to use census data to tell your story.
You can learn more about the training and view the on-demand recording here: http://blog.commongoodvt.org/2015/01/webcast-using-census-data-to-tell-your-story-123/
American Community Survey and the CensusLynda Kellam
The document discusses the history and basics of the US Census and American Community Survey (ACS). It explains that the Census counts the entire population every 10 years and includes basic demographic questions, while the ACS replaced the long form and samples 1 in 6 households annually for more detailed socioeconomic questions. The ACS provides timely annual or multi-year estimate data for areas with populations over 65,000, while the Census provides a single point-in-time count every 10 years.
The document discusses the history and purpose of the US Census and American Community Survey (ACS). The Census has counted the US population every 10 years since 1790, while the ACS provides more detailed annual estimates between Census counts. The ACS replaced the long form Census in 2010 and samples 3 million addresses per year to estimate demographic and socioeconomic trends for areas with populations over 65,000. Users must be aware of margins of error and compare similar ACS estimates (1-year, 3-year, or 5-year) when analyzing data.
Demography of Texas with Dr. Lloyd PotterGreenlights
This document summarizes population trends and projections for Texas. It finds that from 2000 to 2010, Texas' population grew by 15.7% of the total US population growth, with Hispanic and Asian populations increasing the most. Projections estimate continued growth, with the Hispanic population becoming the majority by 2040 and those aged 65 and older increasing significantly. The data also shows trends related to poverty rates, education levels, health indicators, and obesity rates varying by region and ethnicity.
The document summarizes information about the United States Census Bureau, including its role in collecting population and economic data, how it conducts surveys and censuses, what data is collected, and how the data is used. It provides details on the decennial census process and products available from the Census Bureau.
The document summarizes changes to the US Census and introduction of the American Community Survey (ACS). The decennial census will now only include a short form collecting basic demographic information, while the ACS collects additional social and economic data on a rolling basis. The ACS samples areas with a population of 65,000 or more annually and smaller areas every 5 years. While ACS and census data can be compared within limits, they have some differences in methodology that must be considered.
This document summarizes a presentation about the changing demographics of Southern New England. It discusses trends showing the population becoming slightly larger, more diverse, and significantly older. The presentation examines data on population growth, race and ethnicity, and age profiles from the US Census Bureau and other sources. It projects that the region will continue growing older, with more residents over age 60 and fewer under 30 by 2030 compared to 2010. This will have implications for housing, healthcare, transportation, and other regional planning needs.
Introduction to Census data and practical applications - Geography Skills Abe...celiamac58
This course outlines the results from the 2011 Census in Scotland, and demonstrates a number of ways of accessing and using the published resources. The course will focus on the Scottish results published through the Census Data Explorer, and will use a number of case studies to illustrate how the data can be used to answer specific questions.
This document discusses the 2010 Census and outlines key information and timelines for nonprofits. It describes how the census process works and identifies populations that are hard to count. It also discusses ways nonprofits can promote census participation, such as distributing materials, hosting events, and forming Complete Count Committees. Additional resources for nonprofits are available through the NonprofitsCount.org website.
Help! Webinar: "Making Election Data Great Again"Lynda Kellam
The document discusses choosing the right election data sources for different analysis needs, providing an overview of available data on electoral returns, voter turnout, and election administration from the national to local level. It examines both official and unofficial sources and highlights key datasets from organizations like the Census Bureau, Pew Research, and academic collections that contain election results and statistics.
NDGeospatialSummit2022 - (Almost) Everything about Census Data and GeographyNorth Dakota GIS Hub
This document provides an overview of census geography and data. It discusses the two main types of geography - administrative/political and statistical. It describes the hierarchy of geographic units like country, state, county, census tract, block group, and census block. The document also explains the American Community Survey which provides annual population estimates and detailed characteristics, compared to the decennial census which provides official counts every 10 years.
The document provides a demographic, social, and economic assessment of Chelan County, Washington. It analyzes population trends from 2000 to 2010, finding that the population grew 9% and the Hispanic/Latino population increased 46%. Housing data shows most owner-occupied units are held by whites (88%) while renters are more diverse, with whites at 69% and Hispanic/Latino at 27%. Regression techniques are used to project continued population growth in Chelan County through 2030.
1) The study found that 24.3% of deaths in Virginia from 1990 to 2006 could have been prevented if the entire state had the same mortality rates as the most affluent areas. This represents over 220,000 avertable deaths.
2) The proportion of avertable deaths was highest in rural, non-metro areas and areas with lower population density and household income. Counties with the highest percentages of avertable deaths included Charles City, Prince George, and Dinwiddie Counties.
3) Improving social conditions like income and education across Virginia could enable more areas to achieve the health advantages and lower mortality rates seen in northern Virginia.
This document provides demographic and economic data for Orange County and surrounding areas. It includes sections on income levels, population growth, migration trends, education levels, housing, and other topics. Some key points:
- Orange County has the highest per capita income and median household income in North Carolina. Chapel Hill residents have the second highest level of bachelor's degrees or higher in the nation.
- The population of Orange County grew by 8.4% from 2010-2017, a slower rate than previous decades. Minority populations increased substantially in Orange County and surrounding municipalities over recent decades.
- Income levels have risen faster in Orange County than comparable counties after adjusting for inflation since 1998. Orange County residents also have higher adjusted gross
Similar to Data Day 2012_Bakis_American Fact Finder Tool (20)
An MIT spinoff called Optimus Ride is developing self-driving vehicle technology. The company was founded by Ryan Chin, a PhD from MIT who worked on several autonomous vehicle projects there. Optimus Ride aims to provide safe, sustainable, and equitable mobility solutions through their technology, which could unlock over $1 trillion in annual savings according to a Morgan Stanley report.
The Mass Drive Clean campaign was created in 2015 using funding from the John Merck Fund to promote electric vehicles (EVs) through test drive events. The campaign was piloted in Massachusetts and San Diego in 2015 and continued in 2016 with local funding. In 2016, the John Merck Fund provided seed funding to expand the campaign into Connecticut and Rhode Island. According to post-test drive surveys, over 70% of participants were more favorably inclined towards EVs and 70% said they were more likely to purchase one after the test drive experience. The next steps of the Mass Drive Clean campaign are to reach a larger, more diverse group of state residents, continue educating about incentives and models, and provide more experiential events
This document summarizes Boston's efforts to research and test autonomous vehicles. It discusses the city's goals of improving safety, access, and mobility. The mayor's office has formed research partnerships and begun testing AVs on city streets. Testing has involved different vehicles and conditions. The document also examines potential AV business models and their impacts. It outlines Boston's work in areas like workforce development and governance to help guide the integration of this new technology.
Electric vehicles (EVs) provide environmental benefits by reducing emissions even when powered by coal-based electricity. EVs also offer lower fuel and maintenance costs compared to gas vehicles. Massachusetts currently has hundreds of EV charging stations and provides incentives for purchasing EVs and installing chargers. Upcoming events will give people test drives to experience EVs firsthand and help more drivers switch to these cleaner vehicles.
The document summarizes an innovative mobility panel at a MAPC Fall Council meeting. The panel discussed the rise of electric vehicles and autonomous vehicles, and how transportation is the largest source of greenhouse gases in Massachusetts. They also addressed critical areas for state and local governments to consider regarding regulatory frameworks, data, land use impacts, infrastructure and parking for new mobility technologies. The panelists represented organizations working on these issues like MAPC, DOER, Optimus Rides, the City of Boston and Reach Strategies.
This document summarizes a presentation on equity in the Metro Boston region. It discusses goals for increasing equity, including reducing segregation, improving access to affordable housing and food, and increasing opportunities for advancement for workers of color. It then reviews trends related to equity across different life stages and demographics since 2011. Key metrics like income inequality, low birth weight, test scores, incarceration rates, labor force participation, and housing cost burden show both improvements in some disparities but also growing inequities in other areas. The presentation concludes that inequity remains significant and is growing, but that policy interventions can help advance equity, though continued work is still needed.
The document provides an overview of Massachusetts' Regulation and Taxation of Marijuana Act, which legalized recreational marijuana use and sales. It discusses the history of medical marijuana in MA, the passage of ballot question 4 in 2016, and outlines the key components of the new law, including allowing personal possession and home cultivation, establishing a regulatory system under the Cannabis Control Commission, implementing licensing for marijuana establishments, and levying a state and local excise tax. A timeline is also presented detailing implementation of the new law between 2017-2019.
1) The document reviews local control options for regulating recreational marijuana establishments under Massachusetts law. It can adopt time, place and manner restrictions or limit numbers through a regulatory referendum.
2) A regulatory referendum requires a ballot question voted on by residents to prohibit establishments, limit retailers to 20% of liquor licenses, or limit numbers to fewer than medical marijuana facilities. However, a consumption referendum can be forced onto the ballot with 10% of voter signatures.
3) Interpretation of some provisions is unclear, such as what constitutes an "area" where medical marijuana facilities operate. Overall municipalities have some local control but face limitations, especially the risk of consumption referendums beyond their direct control.
The document summarizes a plan for Natick Center that incorporates previous planning efforts and public input. Some key points:
- Previous plans from 1980-2000s addressed facilities, parking, and design issues.
- Natick's population is growing and its households are shrinking, increasing demand for multi-family and smaller housing units.
- New developments have contributed students to schools, though less than single-family homes typically.
- Most people walk to the commuter rail station, and ridership has increased in recent years.
- The plan gathers public input on housing, retail, transportation, and parking preferences to develop a vision for Natick Center's future.
The document provides information from MAPC's Fall 2015 Council meeting. It includes summaries and data from several MAPC projects:
- An inventory of 169 MAPC projects from the past year that advance MetroFuture goals such as sustainable growth, housing, and transportation. Transportation and healthy environment were the most common project categories.
- A discussion of regional ballot initiatives to raise funds for transportation projects and how Massachusetts municipalities can pursue similar initiatives.
- A project to engage immigrant small business owners in downtown Framingham through outreach efforts and a business owner story tour.
- Planning work in Chelsea around housing, jobs, and health through the lens of equity and quality of life near transit infrastructure.
- A project in Quin
Tim Reardon, Assistant Director of Data Services of the Metropolitan Area Planning Council testifies at a hearing of the Massachusetts Joint Housing Committee.
This document contains a map of New England showing the states of Connecticut, New Hampshire, New York, Rhode Island, and Vermont. The map also shows various highways and interstates in the region and contains data on average adult asthma rates by municipality from 2008-2010, with Chelsea, Massachusetts highlighted as having among the highest rates.
This document contains a map of Chelsea, MA showing the percentage of cost burdened households in each census tract, proposed locations for new Silver Line commuter rail stations, existing commuter rail and bus routes, study area boundaries, and proposed bike infrastructure improvements. The census tracts are categorized by percentages ranging from less than 40% of households that are cost burdened up to more than 65%. Several proposed station locations and routes for new bike lanes, cycle tracks, and shared use paths are also illustrated on the map.
The document summarizes a strategic economic development action plan project kickoff meeting for the Town of Reading. It discusses the project goal of producing an action plan focused on four priority development areas to support local housing and economic goals. An agenda, scope, process, and overview of upcoming market analyses were presented. The market analyses will estimate development potential for each site to inform zoning and strategies.
The document summarizes a public meeting held in Reading, MA on April 1, 2015 to discuss the town's strategic economic development action planning. The meeting covered market potential analyses for retail, office, and residential development, as well as design preferences. Key points included:
- Retail market analyses found opportunities for filling vacancies downtown and adding restaurants, with potential for more retail with greater residential density.
- Office market analyses indicated potential for small professional offices downtown and in other areas, with some opportunity for larger office buildings.
- Residential analyses projected growing demand from seniors and young professionals, finding opportunities for over 400 new units within priority development areas over 5-10 years.
- The four priority development areas identified were
The document summarizes findings from a market analysis conducted for a strategic economic development action plan in Reading, MA. It provides information on the housing, retail, office, and residential markets in Reading and the surrounding area. For housing, it notes growing demand for rental units and condominiums as well as rising home prices. The retail market analysis found opportunities to fill vacancies downtown and concentrate new retail and restaurants there. The office market in the area is improving but faces strong competition for jobs. Feedback from residents supported mixed-use development, retail on the ground floor, and residential to support local businesses.
Este documento resume los hallazgos y recomendaciones de varios planes de la ciudad de Chelsea sobre temas como espacios públicos y recreativos, vivienda, desarrollo económico, transporte, diseño urbano, población y seguridad. Los planes buscan fortalecer los vecindarios cercanos a las estaciones de la línea Silver mientras la comunidad se transforma, asegurando que residentes y trabajadores continúen prosperando.
The document discusses growing economic inequality in Boston from 2000 to 2013. The wage and income divide deepened, with households becoming more polarized. The lowest quintile earned under $80,000 while the top 5% earned over $420,000 by 2013. It also shows disparities in educational attainment and child poverty rates by race and neighborhood income levels. It raises questions about whether the city can extend economic benefits to all residents and neighborhoods and create pathways to success for all young people.
This document summarizes new stormwater management requirements for municipalities covered under the MS4 permit program. It outlines general requirements for a written stormwater management plan, education and outreach programs, public participation opportunities, illicit discharge detection and elimination protocols including outfall mapping and monitoring, construction site runoff controls, post-construction stormwater management standards, and municipal "good housekeeping" procedures. It provides details on specific elements required within timeframes of years 1 through 5 of the permit including catchment mapping, construction ordinances, infrastructure mapping, impervious surface tracking, and retrofit assessments. Funding strategies like stormwater utilities and fees based on property use and impervious surface are also summarized.
High performance Serverless Java on AWS- GoTo Amsterdam 2024Vadym Kazulkin
Java is for many years one of the most popular programming languages, but it used to have hard times in the Serverless community. Java is known for its high cold start times and high memory footprint, comparing to other programming languages like Node.js and Python. In this talk I'll look at the general best practices and techniques we can use to decrease memory consumption, cold start times for Java Serverless development on AWS including GraalVM (Native Image) and AWS own offering SnapStart based on Firecracker microVM snapshot and restore and CRaC (Coordinated Restore at Checkpoint) runtime hooks. I'll also provide a lot of benchmarking on Lambda functions trying out various deployment package sizes, Lambda memory settings, Java compilation options and HTTP (a)synchronous clients and measure their impact on cold and warm start times.
Skybuffer SAM4U tool for SAP license adoptionTatiana Kojar
Manage and optimize your license adoption and consumption with SAM4U, an SAP free customer software asset management tool.
SAM4U, an SAP complimentary software asset management tool for customers, delivers a detailed and well-structured overview of license inventory and usage with a user-friendly interface. We offer a hosted, cost-effective, and performance-optimized SAM4U setup in the Skybuffer Cloud environment. You retain ownership of the system and data, while we manage the ABAP 7.58 infrastructure, ensuring fixed Total Cost of Ownership (TCO) and exceptional services through the SAP Fiori interface.
How information systems are built or acquired puts information, which is what they should be about, in a secondary place. Our language adapted accordingly, and we no longer talk about information systems but applications. Applications evolved in a way to break data into diverse fragments, tightly coupled with applications and expensive to integrate. The result is technical debt, which is re-paid by taking even bigger "loans", resulting in an ever-increasing technical debt. Software engineering and procurement practices work in sync with market forces to maintain this trend. This talk demonstrates how natural this situation is. The question is: can something be done to reverse the trend?
This talk will cover ScyllaDB Architecture from the cluster-level view and zoom in on data distribution and internal node architecture. In the process, we will learn the secret sauce used to get ScyllaDB's high availability and superior performance. We will also touch on the upcoming changes to ScyllaDB architecture, moving to strongly consistent metadata and tablets.
Essentials of Automations: Exploring Attributes & Automation ParametersSafe Software
Building automations in FME Flow can save time, money, and help businesses scale by eliminating data silos and providing data to stakeholders in real-time. One essential component to orchestrating complex automations is the use of attributes & automation parameters (both formerly known as “keys”). In fact, it’s unlikely you’ll ever build an Automation without using these components, but what exactly are they?
Attributes & automation parameters enable the automation author to pass data values from one automation component to the next. During this webinar, our FME Flow Specialists will cover leveraging the three types of these output attributes & parameters in FME Flow: Event, Custom, and Automation. As a bonus, they’ll also be making use of the Split-Merge Block functionality.
You’ll leave this webinar with a better understanding of how to maximize the potential of automations by making use of attributes & automation parameters, with the ultimate goal of setting your enterprise integration workflows up on autopilot.
AppSec PNW: Android and iOS Application Security with MobSFAjin Abraham
Mobile Security Framework - MobSF is a free and open source automated mobile application security testing environment designed to help security engineers, researchers, developers, and penetration testers to identify security vulnerabilities, malicious behaviours and privacy concerns in mobile applications using static and dynamic analysis. It supports all the popular mobile application binaries and source code formats built for Android and iOS devices. In addition to automated security assessment, it also offers an interactive testing environment to build and execute scenario based test/fuzz cases against the application.
This talk covers:
Using MobSF for static analysis of mobile applications.
Interactive dynamic security assessment of Android and iOS applications.
Solving Mobile app CTF challenges.
Reverse engineering and runtime analysis of Mobile malware.
How to shift left and integrate MobSF/mobsfscan SAST and DAST in your build pipeline.
Fueling AI with Great Data with Airbyte WebinarZilliz
This talk will focus on how to collect data from a variety of sources, leveraging this data for RAG and other GenAI use cases, and finally charting your course to productionalization.
Dandelion Hashtable: beyond billion requests per second on a commodity serverAntonios Katsarakis
This slide deck presents DLHT, a concurrent in-memory hashtable. Despite efforts to optimize hashtables, that go as far as sacrificing core functionality, state-of-the-art designs still incur multiple memory accesses per request and block request processing in three cases. First, most hashtables block while waiting for data to be retrieved from memory. Second, open-addressing designs, which represent the current state-of-the-art, either cannot free index slots on deletes or must block all requests to do so. Third, index resizes block every request until all objects are copied to the new index. Defying folklore wisdom, DLHT forgoes open-addressing and adopts a fully-featured and memory-aware closed-addressing design based on bounded cache-line-chaining. This design offers lock-free index operations and deletes that free slots instantly, (2) completes most requests with a single memory access, (3) utilizes software prefetching to hide memory latencies, and (4) employs a novel non-blocking and parallel resizing. In a commodity server and a memory-resident workload, DLHT surpasses 1.6B requests per second and provides 3.5x (12x) the throughput of the state-of-the-art closed-addressing (open-addressing) resizable hashtable on Gets (Deletes).
"$10 thousand per minute of downtime: architecture, queues, streaming and fin...Fwdays
Direct losses from downtime in 1 minute = $5-$10 thousand dollars. Reputation is priceless.
As part of the talk, we will consider the architectural strategies necessary for the development of highly loaded fintech solutions. We will focus on using queues and streaming to efficiently work and manage large amounts of data in real-time and to minimize latency.
We will focus special attention on the architectural patterns used in the design of the fintech system, microservices and event-driven architecture, which ensure scalability, fault tolerance, and consistency of the entire system.
Connector Corner: Seamlessly power UiPath Apps, GenAI with prebuilt connectorsDianaGray10
Join us to learn how UiPath Apps can directly and easily interact with prebuilt connectors via Integration Service--including Salesforce, ServiceNow, Open GenAI, and more.
The best part is you can achieve this without building a custom workflow! Say goodbye to the hassle of using separate automations to call APIs. By seamlessly integrating within App Studio, you can now easily streamline your workflow, while gaining direct access to our Connector Catalog of popular applications.
We’ll discuss and demo the benefits of UiPath Apps and connectors including:
Creating a compelling user experience for any software, without the limitations of APIs.
Accelerating the app creation process, saving time and effort
Enjoying high-performance CRUD (create, read, update, delete) operations, for
seamless data management.
Speakers:
Russell Alfeche, Technology Leader, RPA at qBotic and UiPath MVP
Charlie Greenberg, host
Session 1 - Intro to Robotic Process Automation.pdfUiPathCommunity
👉 Check out our full 'Africa Series - Automation Student Developers (EN)' page to register for the full program:
https://bit.ly/Automation_Student_Kickstart
In this session, we shall introduce you to the world of automation, the UiPath Platform, and guide you on how to install and setup UiPath Studio on your Windows PC.
📕 Detailed agenda:
What is RPA? Benefits of RPA?
RPA Applications
The UiPath End-to-End Automation Platform
UiPath Studio CE Installation and Setup
💻 Extra training through UiPath Academy:
Introduction to Automation
UiPath Business Automation Platform
Explore automation development with UiPath Studio
👉 Register here for our upcoming Session 2 on June 20: Introduction to UiPath Studio Fundamentals: https://community.uipath.com/events/details/uipath-lagos-presents-session-2-introduction-to-uipath-studio-fundamentals/
[OReilly Superstream] Occupy the Space: A grassroots guide to engineering (an...Jason Yip
The typical problem in product engineering is not bad strategy, so much as “no strategy”. This leads to confusion, lack of motivation, and incoherent action. The next time you look for a strategy and find an empty space, instead of waiting for it to be filled, I will show you how to fill it in yourself. If you’re wrong, it forces a correction. If you’re right, it helps create focus. I’ll share how I’ve approached this in the past, both what works and lessons for what didn’t work so well.
Discover top-tier mobile app development services, offering innovative solutions for iOS and Android. Enhance your business with custom, user-friendly mobile applications.
zkStudyClub - LatticeFold: A Lattice-based Folding Scheme and its Application...Alex Pruden
Folding is a recent technique for building efficient recursive SNARKs. Several elegant folding protocols have been proposed, such as Nova, Supernova, Hypernova, Protostar, and others. However, all of them rely on an additively homomorphic commitment scheme based on discrete log, and are therefore not post-quantum secure. In this work we present LatticeFold, the first lattice-based folding protocol based on the Module SIS problem. This folding protocol naturally leads to an efficient recursive lattice-based SNARK and an efficient PCD scheme. LatticeFold supports folding low-degree relations, such as R1CS, as well as high-degree relations, such as CCS. The key challenge is to construct a secure folding protocol that works with the Ajtai commitment scheme. The difficulty, is ensuring that extracted witnesses are low norm through many rounds of folding. We present a novel technique using the sumcheck protocol to ensure that extracted witnesses are always low norm no matter how many rounds of folding are used. Our evaluation of the final proof system suggests that it is as performant as Hypernova, while providing post-quantum security.
Paper Link: https://eprint.iacr.org/2024/257
zkStudyClub - LatticeFold: A Lattice-based Folding Scheme and its Application...
Data Day 2012_Bakis_American Fact Finder Tool
1. Your Community by the Numbers Accessing the most current and relevant Census data Arthur Bakis, Information Services Specialist U.S Census Bureau Boston Regional Office 617-424-4510 [email_address] [email_address]
8. Program (cont.) American Community Survey (ACS) - Social and Economic information every year rather than just once a decade - Took the place of the census long form (2005) - At the start of each month, the questionnaire is mailed to a scientifically selected random sample of households in counties throughout the Nation - The Census will continue to conduct a short-form-only Census every 10 years - NOT A COUNT! VIEW TRENDS!
9. Program (cont.) American Community Survey (ACS) CURRENT DATA AVAILABLE FOR 2010 ! - Data is currently available for most geographic areas - Areas with a population 65,000+ : 1 Year Estimates (data avail. for 2005, 2006, 2007, 2008, 2009, 2010) - Areas with a population 20,000+ : 3-Year Estimates (data avail. for 2005-07, 2006-08, 2007-09, 2008-2010) - Areas below 20,000 (incl. census tracts & block groups): 5-year estimates (data avail. for 2005-2009, 2006-2010)
14. Data Sets 2000 Census - 2000 Redistricting Data SF (P.L. 94-171) - 2000 SF 1 100% Data - 2000 SF 2 100% Data - 2000 SF 3 Sample Data - 2000 SF 4 Sample Data
15.
16. Summary File 4 (SF4 = Sample Data) Summary File 4 Cross references detailed race, ethnic, and ancestry groups with all data subjects in SF3 Now collected by ACS and available through Selected Population Profiles
19. Nation Zip Code Tabulation Area Metropolitan Areas States Congressional Districts Places Counties County Subdivision Census Tracts Block Groups Blocks Cities and Towns
Good morning my name is ________________ and I am ____________________ with the Boston Regional Office. Today we are going to learn about census data and how to access it. The workshop is broken down into two segments. The first half is a presentation that explains the various programs the census runs, the data that is released by these programs and the geographies that the data is available for. What many people don’t realize is that the census that most people know….the one that’s conducted every 10 years….is only one aspect of what we do. You are especially going to enjoy learning about the American Community Survey which will allow you to access new detailed social, economic and housing data for your state, county and community every year, rather than waiting every 10! We’re talking about data like income and poverty, education, language, place of birth, commute to work….the real rich data. And that’s the main thing we want everyone to take away from this workshop – to know which program or census or survey to use to get the data that you’re looking for. The other thing we want you to take away from this is our contact information. We don’t expect anyone to remember everything we’re going to talk about today so understand that our department’s job at the Census is to answer public inquiries and get you to the data you need. So please use our e-mail address and phone number. So let’s get started!
What you’re looking at here is a screen shot of www.census.gov – the US Census Bureau homepage. There’s a lot of great stuff on this page but what we’re going to use it for at this workshop is as a gateway to our online data access tool – the American FactFinder. It’s circled in this screen shot.
When you click on the American FactFinder link from the home page it brings you to this screen. Currently there are two versions of the American FactFinder. The NEW American FactFinder is releasing the 2010 Census data. So if you are looking for data for your state or community from the 2010 Census you are going to be using the NEW FactFinder. The old version – or Legacy – currently includes everything else. All the other data we release besides the 2010 Census data can only be accessed through the Legacy version. Eventually, the data that’s in the Legacy system will be migrated over to the NEW FactFinder. We’re hearing Fall 2011. For now, it is a bit of a curveball because you have to learn how to navigate both systems. But we’ll get through it together! We’re going to revisit this screen at the end of the presentation to explain a bit further which data you can get in which version.
So, like I said, now we’re going to look at each of those components in much more detail. We’re going to start with ‘Programs’
Program refers to the survey or census that you are interested in. We’re going to focus in this workshop on the first three programs listed on this slide – the Decennial Census, the Population Estimates Program and the American Community Survey. The Decennial Census is the Census ‘program’ that everyone knows. Whether it’s through civics class or by actually receiving and completing the questionnaire. It’s the one that’s conducted every 10 years and provides a complete count of the residents of the United States. In regards to the Population Estimates Program, just think of it this way. The Decennial Census is done every 10 years - and that’s great – but what about the years in between? Well that’s where the Pop Estimates Program comes in. It provides the official census ‘count’ for the years in between the decennial census. Now, what is the American Community Survey? I can promise that those of you not familiar with this survey will leave this workshop in love with it. The ACS is a survey we began in 2005 that allows the detailed Social, Economic and Housing data to be released every year, rather than every 10. We’re going to focus on these 3 programs for this workshop, but be aware that the Census conducts a number of other censuses and surveys. The Economic Census is done every 5 years and provides a ‘count’ of businesses. You can use the EC to find the number of establishments in an industry, industry sales, number of employees and payroll in your state, your county or your city/town. The Current Population Survey is a survey we conduct for the Bureau of Labor Statistics. This survey provides a lot of data on income, poverty, employment and health insurance and one of it’s main tasks is providing the official Unemployment Rate. So any news stories you hear or read regarding the unemployment rate – they are sourcing this survey. I’ll also mention the Consumer Expenditure Survey which provides information on the populations spending habits. This survey is also conducted for the Department of Labor and is used to determine Cost of Living. And this is only a few Programs that I decided to mention. We also do surveys on Health and Crime and Housing. But again, for this workshop we’re going to focus on our ‘Big 3’ Programs and we’ll discuss each of them in detail – and the differences between them – now!
We’ll first talk about the decennial census. First, I want to speak to a big difference in this most recent census in 2010 than in past censuses. The 2010 Census is what we call a ‘Short Form’ only census. In 2000 (and many prior censuses) one in every six households received the census long form. This long form was about 40 pages long and asked 53 questions. But the data that came from this long form was enormously important for non-profits in grant writing, planners and community officials. It released what we call the ‘bread and butter’ data: income, poverty, education, language spoken at home, birthplace/nativity and detailed housing stats like value of home and heating fuel used. This long form is no longer part of the decennial census. But don’t worry because we didn’t stop collecting this data. We’ll talk a bit later about how that data is collected and released. As we mentioned, the 2010 Census is a ‘short form’ only! 10 questions….that’s it. We had a motto, 10-10-2010 – 10 questions, 10 minutes, 2010 Census! Now I won’t lie to you, if you had more than one person in your household it might take a bit more than 10 minutes but 10-13-2010 didn’t roll off the tongue as well. The 2010 Census collected the following information: Name, Sex, Age, Race, Ethnicity, Household Relationship and Tenure (whether you own or rent) - that’s it!
Now to the American Community Survey. For all of you data users that were worried about what happened to our ‘bread and butter’ data fear not! It is now collected by the American Community Survey The ACS is a monthly survey that allows the detailed social, economic and housing data to be released annually rather than waiting every 10 years. When we refer to detailed social, economic and housing data we’re talking about things like income and poverty, education, language, citizenship and place of birth, disability, commute to work….the really rich data. Basically, the Census Bureau realized that this data needed to come out more frequently. If you think about the last few years and the tumultuous economy and housing market, looking at data from 2 years ago is useless to us let alone from 10 years. The ACS has taken the place of the decennial census long form that we mentioned earlier. The way it works is that at the start of every month, the questionnaire is mailed out to a random sample of households in every county throughout the Nation. In general, 250,000 per month and 3 million per year. And it works kind of like jury duty. If your address is in sample for any given month, it will be taken out of sample for at least 5 years and probably longer. However, if you move, I can’t promise you won’t get it in consecutive months. Remember it’s all based on addresses. It’s sent to ‘Current Resident’. So if you are living at one address say in May and receive the questionnaire and then move, you could receive it at your new address in June. The Census will obviously still conduct a short form census every 10 years to get a count of the population A very important thing to remember about the ACS as you begin to use the data is that you don’t want to use it as a count of the population. You don’t want to look at say families in poverty in the city of Waterbury and say ‘Oh the Census Bureau says that there were 12,937 people living in poverty in 2009. The estimates provided are based on a sample. The data is collected and then weighted to represent the entire population of a given geographic area. You’ll notice as we start to work with the data that every table from the ACS provides a Margin of Error for EVERY data item. So the estimate provided is the BEST estimate based on the sample but it could fall anywhere between that Margin of Error. What you want to do with this data is View Trends and Make Comparisons. What you want to do – using the poverty example again – is say whether the number of people living in poverty in Waterbury is increasing or decreasing or has stayed the same. Or you want compare the number of people in poverty in Waterbury to another city, Hartford Cty, or to the state of Connecticut.
So what data is available from the ACS? Well, you can tell by the text that there is currently data available from 2009. And as the slide mentions, data is available for all geographic areas. What you see in the middle of the slide is a sort of data release timeline for ACS. The best way for me to describe this is to start from the beginning of the survey. The first ACS data release was in 2006. 1-yr estimates – or 12 months of sample – were released for areas with a population of 65,000+. This provided data for most large cities, most counties, all states and the Nation. These large areas have received new 1-yr estimates every year since the 2005 data release. So for a large city like Waterbury, you have annual data for 2005, 2006, 2007, 2008 and 2009. In 2008, the Census Bureau began releasing 3-yr estimates – or 36 months of sample – for areas with a population of 20,000+. So in 2008 we got our first 3 yr estimate for the years 2005-2007. And we will receive a new 3 yr estimate every year. In 09 we released a 3 yr estimate for 2006-2008 and we recently released the 3yr estimate 2007-2009. So even though it’s a 3yr estimate we will still be able to use the data for what the ACS is intended – to view trends and make comparisons. More on that in a minute. And finally, this past December, the Census Bureau released data for the remaining geographic areas down to the block group level. (For those of you that aren’t familiar with Block groups or census tracts they just allow for more localized data access. We’ll talk about them in more detail later in the presentation). These areas of less than 20,000 in population had 5-year estimates – or 60 months of sample – released for them. So the first 5-yr estimates were for the years 2005-2009. And we’ll receive a new 5-yr estimate every year going forward so we can view trends and make comparisons. Now bear with me for a second. I mentioned that one of the main things you want to use ACS data for is to make comparisons to other geographic areas. Say, for example, you wanted to compare data for a community that’s 10,000 in population with state data. You don’t want to compare a 5yr estimate with a 1yr estimate. You want to compare a 5yr estimate to another 5yr estimates. For the reason, areas with over 65,000 in population receive not only a 1yr estimate every year – but also a 3yr estimate and a 5yr estimate. And areas between 20,000 and 65,000 receive a 3yr and a 5yr estimate every year. Now these multiple releases can also be used to access more reliable data but we’ll talk about that a little later. And quickly let me mention when ACS data is released every year. ACS data is released in the fall and winter of every year for the previous year. So this fall/winter we’ll release the 2010 ACS data. Generally, the data is released by estimate. So in Sept the 1yr estimates are released. In Oct/Nov the 5yr estimates are released. And in Dec/Jan the 3yr estimates are released.
Now we’re going to talk about Data Sets. Again, Data Sets refer to the data file that you are pulling the data from. Examples include 2010 Redistricting Data, 2000 Summary File 1, and ACS 2009 1yr Estimate. Let’s see all of the Data Sets available.
This slide strictly refers to data sets available from the 2010 Census. The most recent released data set is the Census 2010 Redistricting data. This data is the first community level data. Redistricting data provides total population, age (over 18), race, ethnicity, total housing units and occupancy vs. vacancy statistics down to the BLOCK level. That’s the smallest level of geography we provide data for – and in an urban area it is generally equivalent to a city block. This summer we will be releasing the second Data Set from the 2010 Census – Summary File 1. This releases ALL the data collected by the 2010 Census. Not only will you get the data that was released in the Redistricting file, you’ll also get data on households and families, relationships, tenure and detailed race and ethnicities. By ‘detailed’ race and ethnicities we are referring to the specific groups. So instead of Asian as a whole – which can currently be found in the Redistricting data set, SF 1 releases counts of the Chinese, Japanese, Korean and Vietnamese populations. And instead of Hispanic as a whole – also released in the Redistricting data set, we release counts of the Puerto Rican, Dominican, Cuban and Guatemalan population. Finally, the other major Census 2010 data set you see on this list is Summary File 2. What Summary File 2 allows you to do is cross reference those detailed race and ethnic groups with the data released in Summary File 1. All SF 1 does is give you counts of these detailed groups. SF 2 allows you to actually see demographic information on these groups. So if you are looking for an age breakdown for the Asian population you will find that in Summary File 1. But if you are looking for an age breakdown for the Chinese, Japanese or Korean population, you would go into Summary File 2. Similarly, if you are looking for the number of Hispanic Households you would look in the Summary File 1 Data Set but if you wanted the number of Puerto Rican or Cuban or Dominican Households you would look at the Summary File 2 data set.
This slide just reiterates the data that’s available in Summary File 1. Actually, you might want to take a look at the handout in your kits that deals with Data Sets. This will serve as a great reference tool for understanding which files to use depending upon the type of data you are looking for. So, referring to that form, the data released by Summary File 1 is listed in the ‘yellow’ section. We also refer to this data as ‘100% data’ since it is asked of every household/address in the country. This was the basic demographic information that was asked of all residents. Again, it includes data like sex, age, race, ethnicity, household relationship and tenure (whether you own/rent your house).
And this slide just talks about what the Summary File 2 data set includes. Again, it allows us to cross reference the detailed race and ethnic groups with the data released in Summary File 1.
You’ll notice that a lot of the data sets that were available from Census 2000 are exactly the same as those available in Census 2010. There’s the 2000 Redistricting Data data set, as well as, Summary File 1 and Summary File 2. The big difference is that in 2000, data sets Summary File 3 and Summary File 4 were included. These data sets released the data that was collected from the Census long form. If you remember, the long form was the questionnaire that went to approximately 1 in every 6 households and collected the really rich, detailed social, economic and housing data. It’s the data that is now collected and released annually by the American Community Survey. Summary File 3 was the main data set for the long form data. It released all of the data listed in the dark blue section of the Data Sets handout. You’ll notice that the data is much more detailed than what is released in SF1. Summary File 4 served the same purpose for SF3 data that Summary File 2 did for SF1 data. It allowed you to cross reference the detailed race and ethnic groups with the data found in Summary File 3. So if you wanted an income breakdown for the Total Population or one of the 6 major race groups you would find that in SF 3. But if you wanted the income breakdown for the Chinese or Vietnamese populations or the Dominican or Colombian ethnicities you would use Summary File 4. Remember, SF 3 and SF 4 no longer exist. That data is now collected and released in the American Community Survey Data Sets.
This just shows you the actual data items collected and released by SF 3 in 2000. Notice the bottom. “Now collected by the ACS”
And this just mentions SF 4 and what type of data is available there.
So here are a few of the Data Sets from the American Community Survey. The data for the ACS is released by year and by estimate type. You have you’re 2005-2009 ACS 5yr Estimate. This would provide ACS data for ALL geographic areas regardless of size. The 2007-2009 3yr Estimate releases the ACS data for areas 20,000 or more in population and the 2009 1yr Estimate release the most current ACS estimates for areas with a population of 65,000 or more. Then I’ve included the 2006-2008 ACS 3yr Estimate and the 2008 ACS 1yr Estimate Data Sets. Remember, there is no 5yr estimate from the 2008 data. The 2009 ACS data was the first release of a 5yr estimate. But from now on, we’ll have a new 5yr estimate every year! The Data Sets will go back to 2005 which is the year we began conducting the American Community Survey. Now let’s imagine you want ACS data for the city of Waterbury. We know it is more than 65,000 in population but which Data Set are you going to use. I think most of use will use the 1yr Estimate Data Set from the given year we are interested in because we want the most current data. Understand that the 5yr Estimates are going to be the more accurate estimate because they are using a 60 month sample rather than a 12 month. So it’s entirely up to you to determine which data set to use. In essence you need to figure out which is more important to you – currency or reliability.
Our Final Component we’re going to discuss today is the Summary Levels. Anytime you hear or see the term ‘Summary Level’ just think of one thing – Geography.
So let’s take a minute or two to talk about Census Geography. You’re looking at the Census geography hierarchy. These are the Geographic Areas for which Census Data is available. At the top we have the Nation. Next comes States and Counties which are pretty self explanatory. You want to pay particular attention to the areas off to the right and left in this section – Places and County Subdivisions. You’ll notice that you won’t really see any mention of ‘Cities’ and ‘Towns’ as you use the FactFinder. Well Places and County Subdivisons are Census Jargon for cities and towns. There are pretty detailed definitions for each of these areas but we’ll simplify it for data access concerns. In most cases, Places are your cities and County Subdivisions are your towns. Living in New England and New York makes it a bit more convenient because in all New England states and New York both cities and towns can be accessed using the ‘County Subdivision’ geography. However, ‘villages’ are considered Places and won’t be found in the ‘County Subdivision geography. It’s important to know this because when we get into the FactFinder and get to the screen where we choose our geographies we’re going to prompted to first choose a Geographic Area. The terms ‘city’ or ‘town’ will not be an option. But ‘Places’ and ‘County Subdivisions’ will. The bottom 3 geographies are pretty unique to the Census Bureau – Census Tracts, Block Groups and Blocks. They allow for more localized data access. Census Tracts generally have a population thereshold of 1500 to 8000 with an optimum population of 4000. Tracts usually follow physical boundaries – streets, rivers, etc. And they are identified by 1 to 4 digits – (1 to 9999). Census Tracts are unique to the county they are in. So there could be a Census Tract 216 in Hartford Cty and Litchfield Cty and Fairfield Cty. Block Groups are generally between 300 and 4000 in population with an optimum population of 1500. Block Groups generally follow physical boundaries. And are identified by 1 digit. (eg. Block Group 1, Block Group 4, etc.) Blocks are the smallest geographic level the census bureau provides data for. There isn’t actually a population threshold for blocks. In rural areas blocks could be hundreds of square miles in size and have no one living in them. But in urban areas like Boston a block is generally a city block. Blocks are identified by 4 digits with the first digit representing the Block Group it is in. For instance blocks 1001, 1002 and 1003 are in BG 1. A better way to explain these geographies is visually so we put together some maps on the next 3 slides.
So let’s take a look at some of these geographies that we just talked about. This is a map of Census Tract 3518 in Waterbury, CT. Census Tracts generally have a population thereshold of 1,500 to 8,000 with an optimum population of 4,000. Tracts usually follow physical boundaries – streets, rivers, etc.
This is the same map, just zoomed in a bit. The light pink line delineates Block Group 2, in Census Tract 3518 in Waterbury, CT. Block Groups are generally between 300 and 4,000 in population with an optimum population of 1,500. Block Groups generally follow physical boundaries.
And finally, zoomed in a bit more. The yellow lines delineate the blocks. Specifically we’re looking at Block 2004 in Block Group 2 in Census Tract 3518 which is in Waterbury. Blocks are the smallest geographic level the census bureau provides data for. There isn’t actually a population threshold for blocks. In rural areas blocks could be hundreds of square miles in size and have no one living in them. But in urban areas, a block is generally a city block.
This is also a great time to talk about what we call FactFinder 101. These are the 2 elements that you need to know before you even turn on your computer. Number 1 – Know what data you want. Are you interested in income and poverty data? Do you need information on the languages spoken in your area? Are you interested in the elderly population and want an age breakdown? That’s number 1. Number 2 – you need to know which geographic area or areas you want the data for. For the most part you are all going to know what area you want since most of you are interested in a certain community or have a specific service area. But always know these 2 things. The reason being, each of these items are going to determine your selections in they system. For instance, knowing you are looking for income data will force you to select the ACS if you are looking for the most current income data. And if you are interested in looking at income data for census tracts you will need to look at the 5yr Estimate.