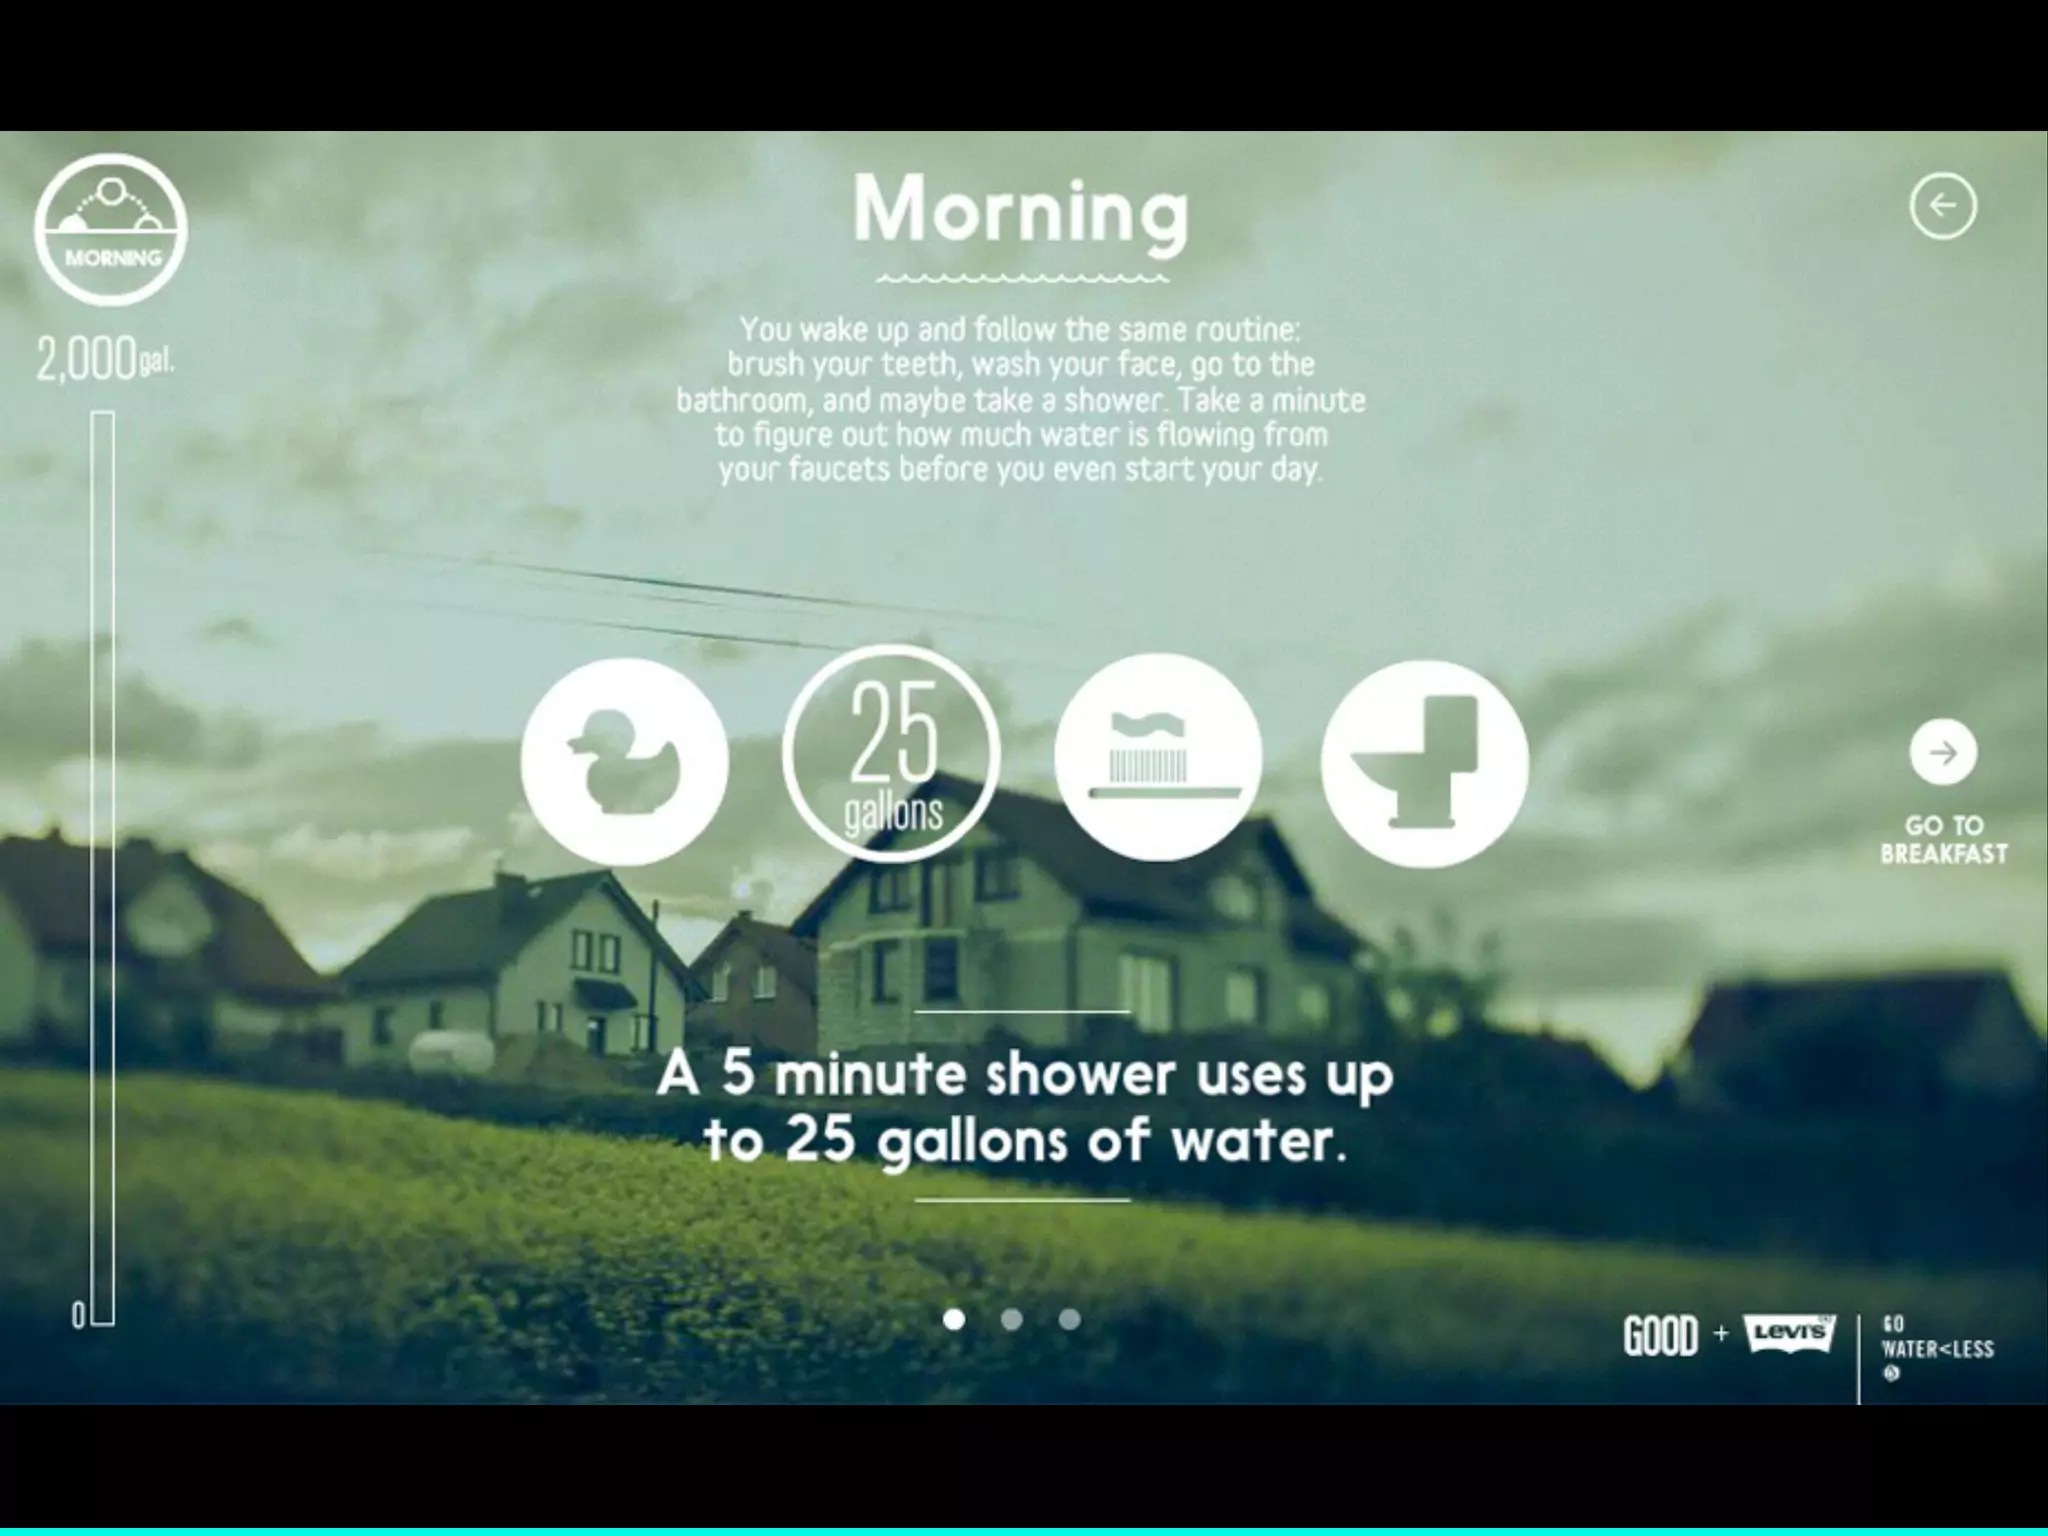
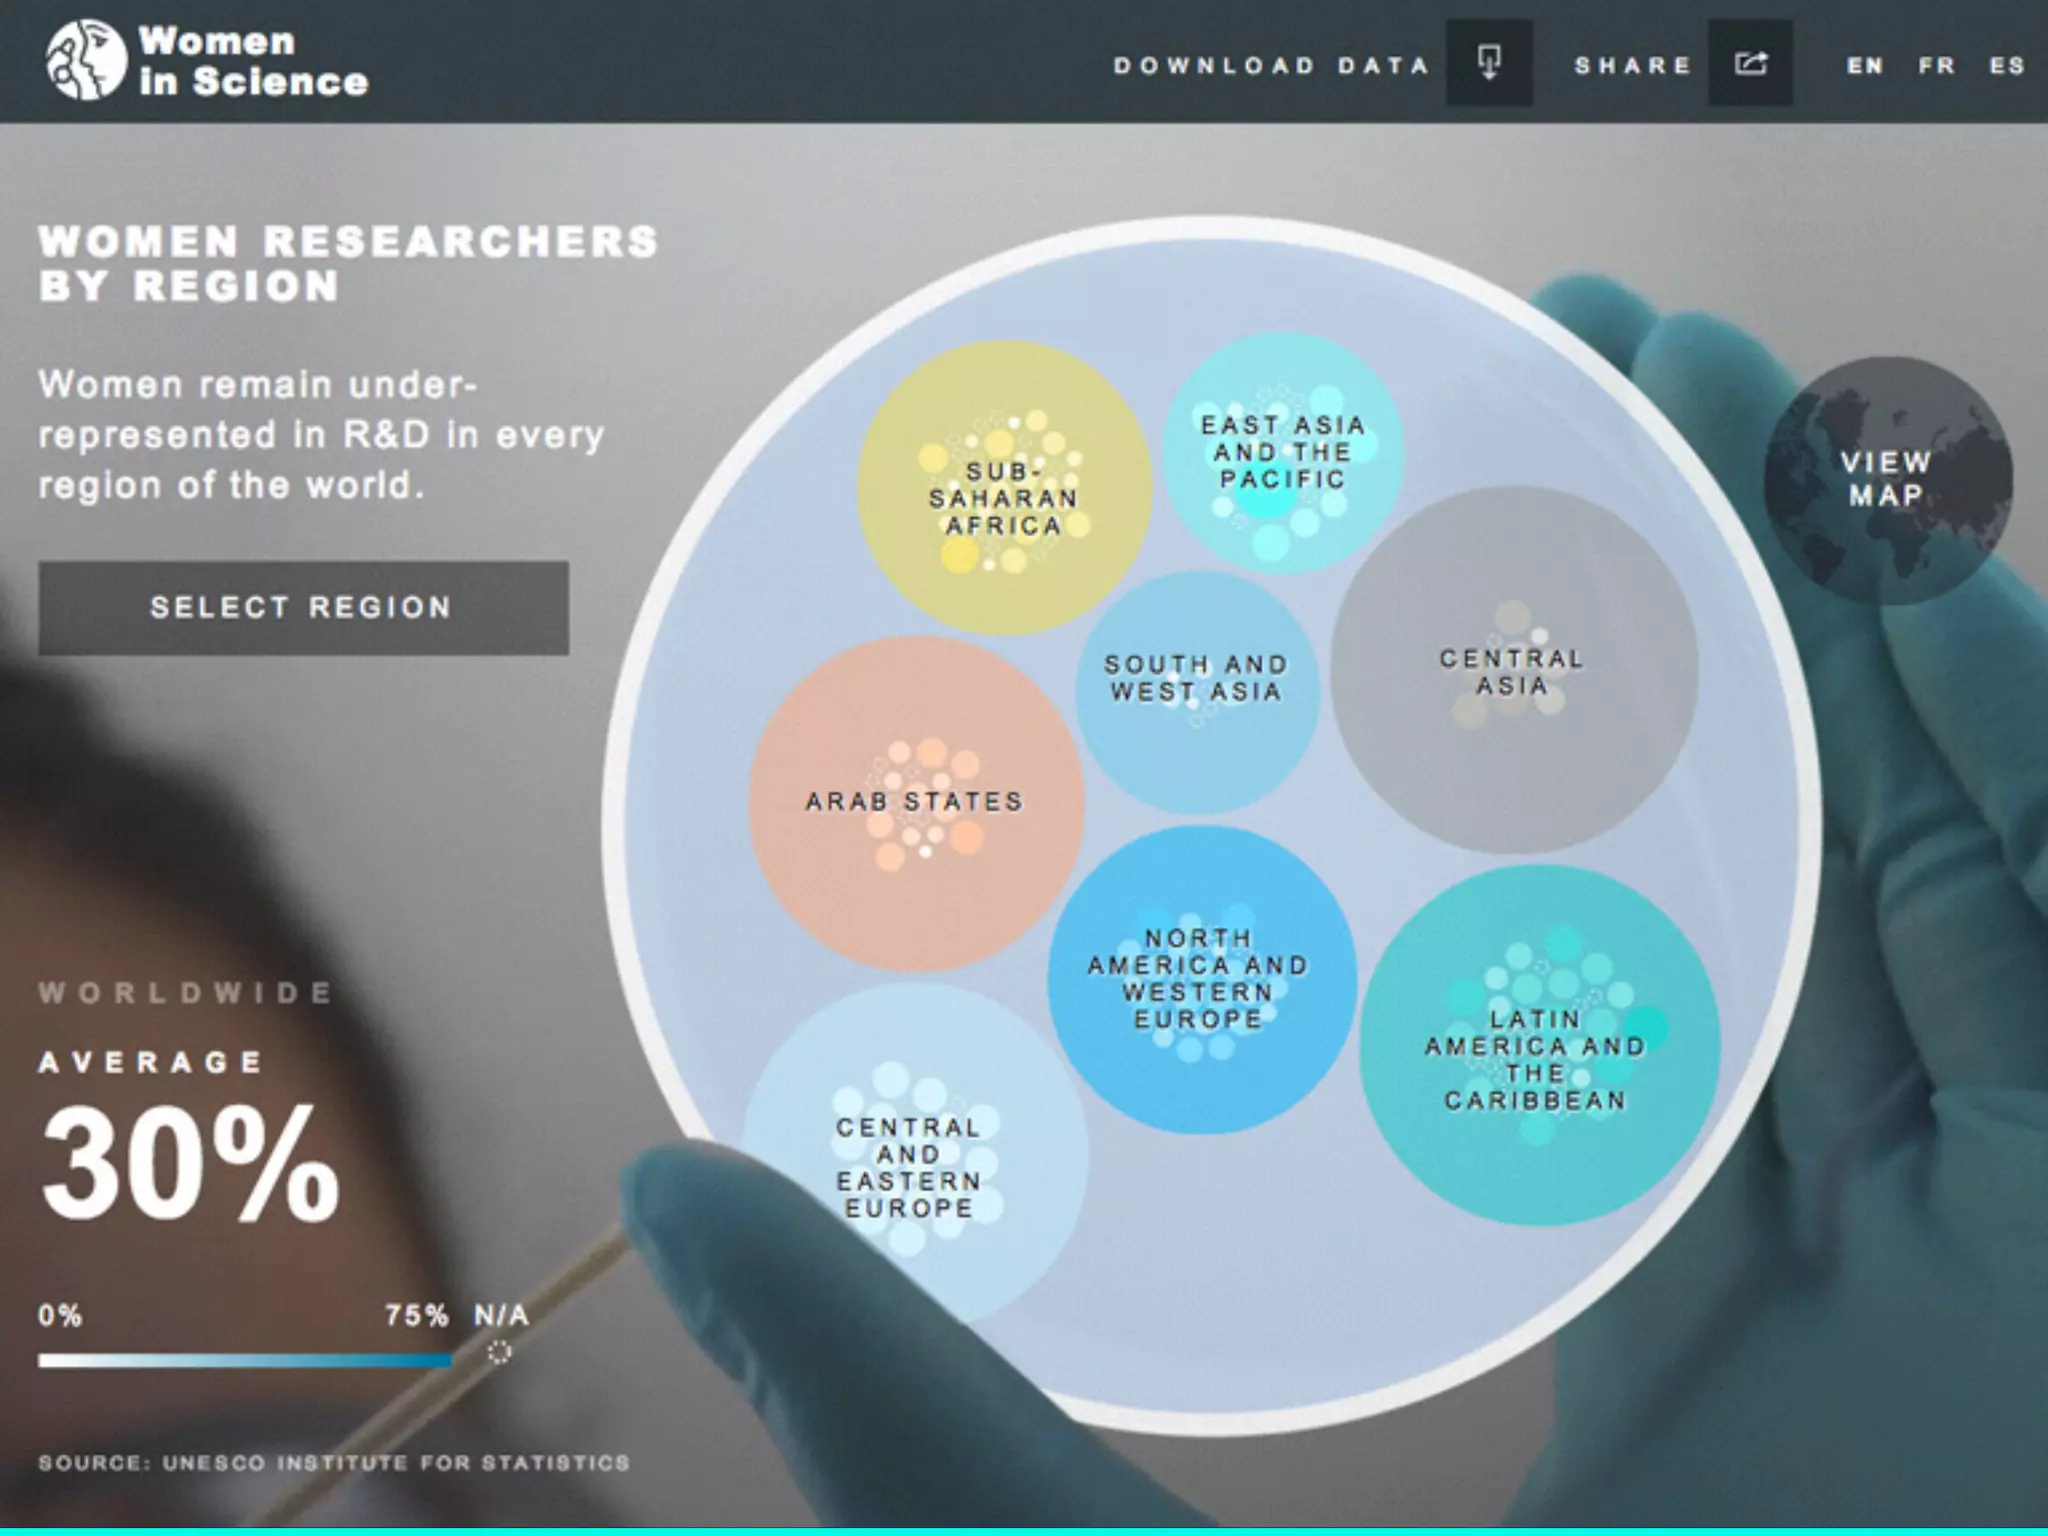
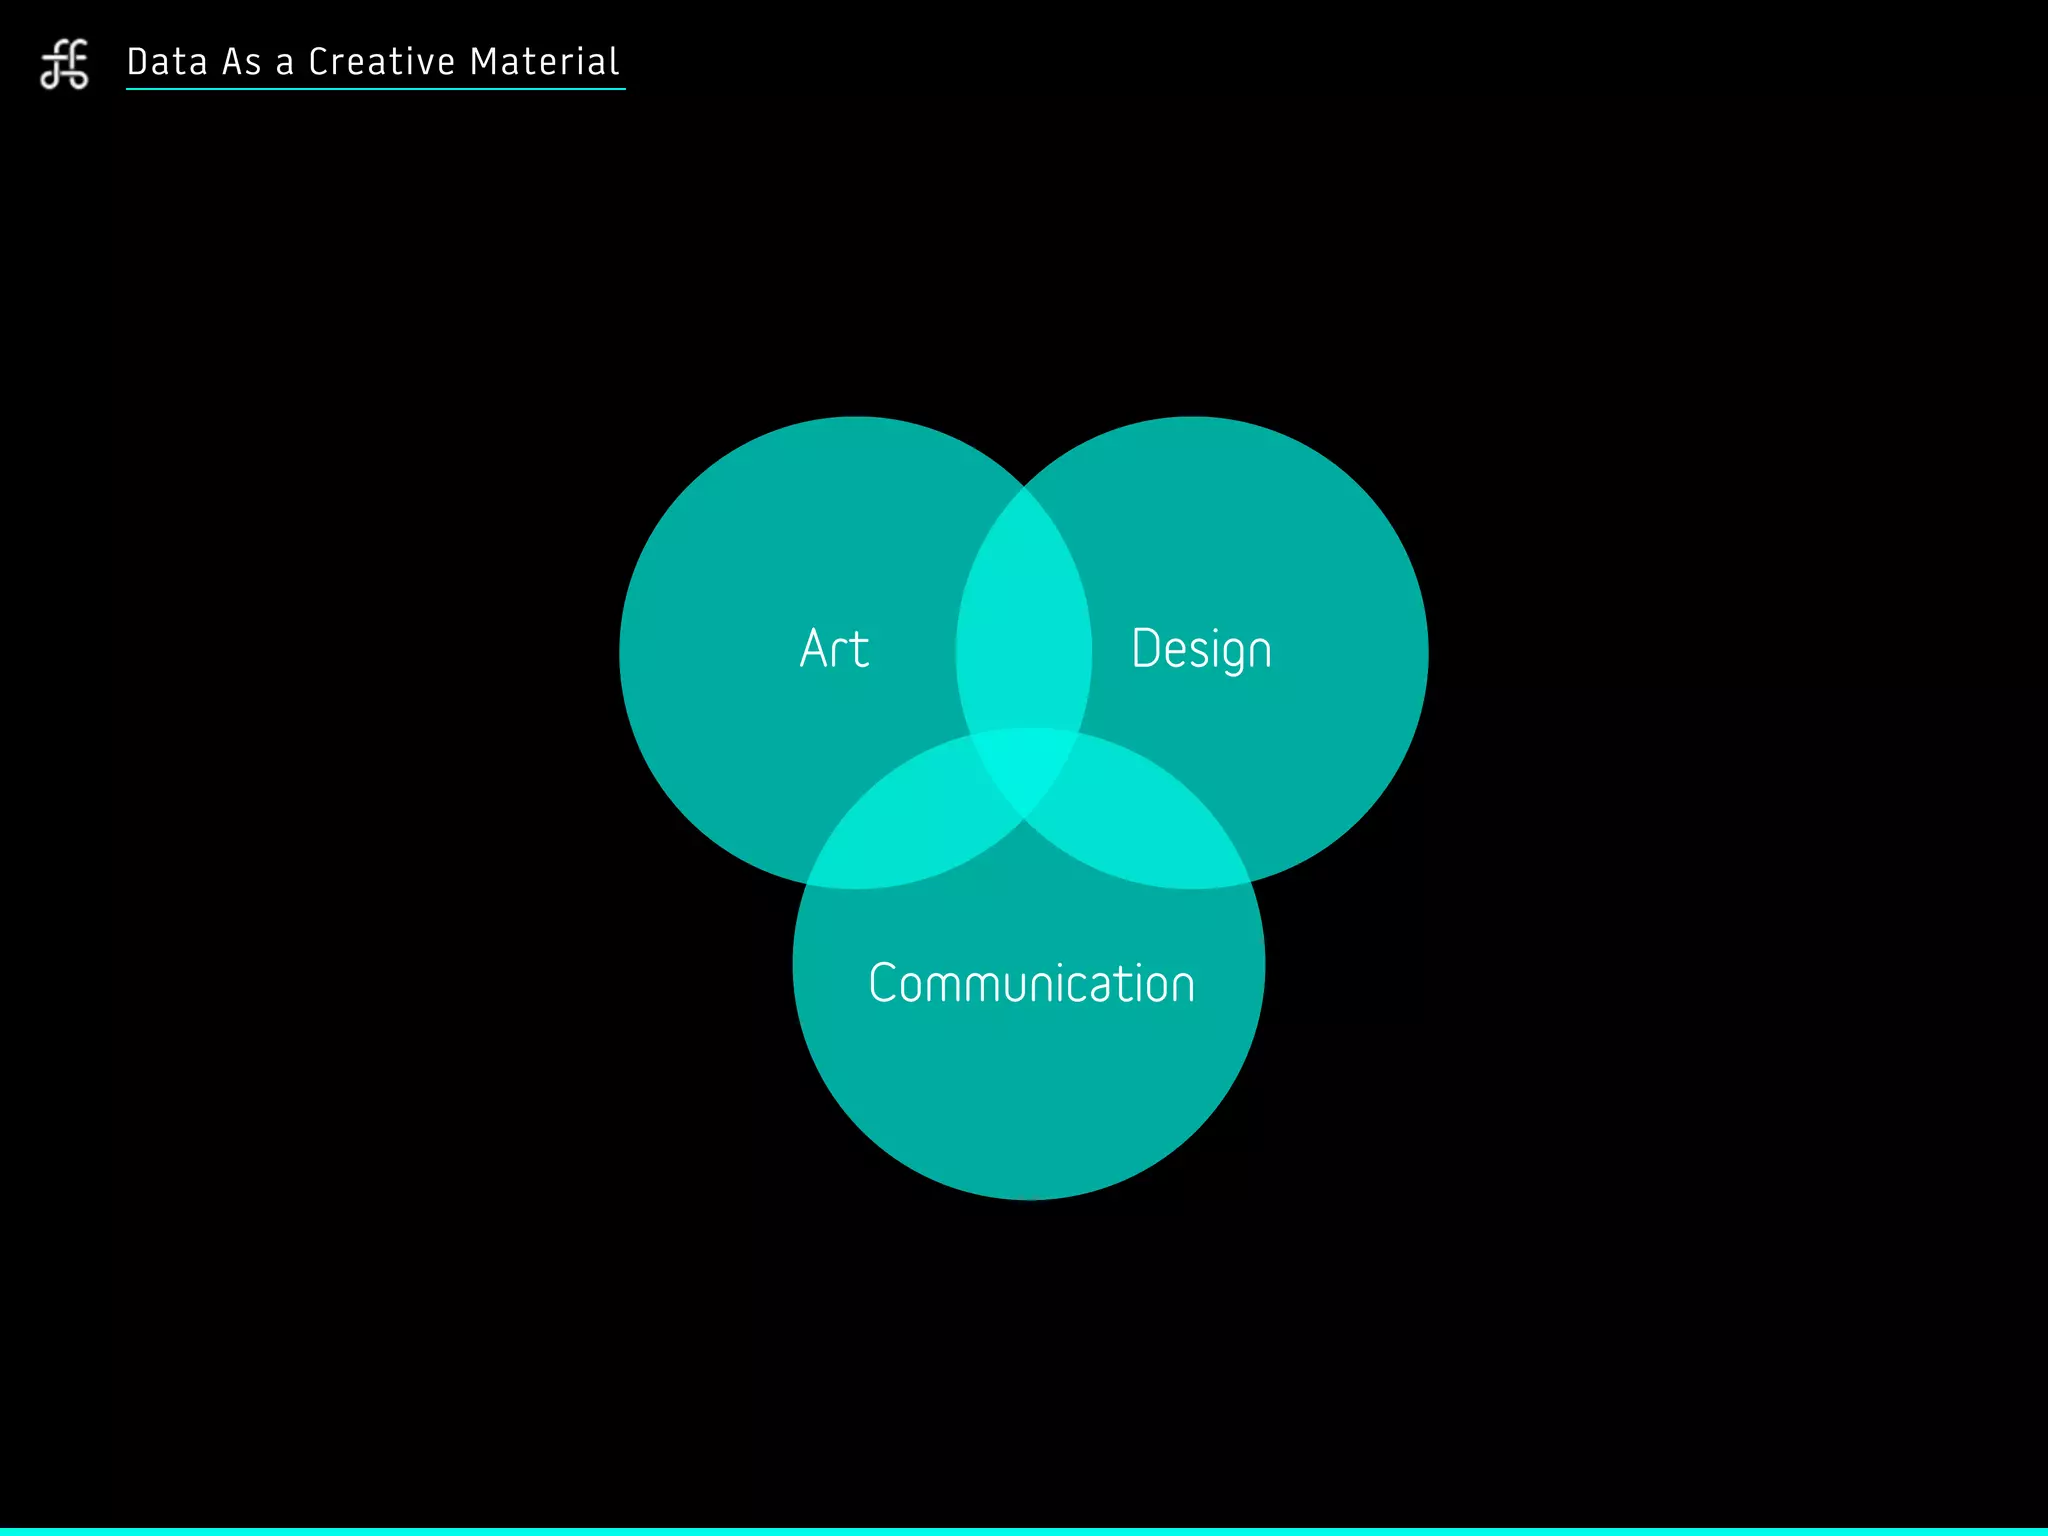
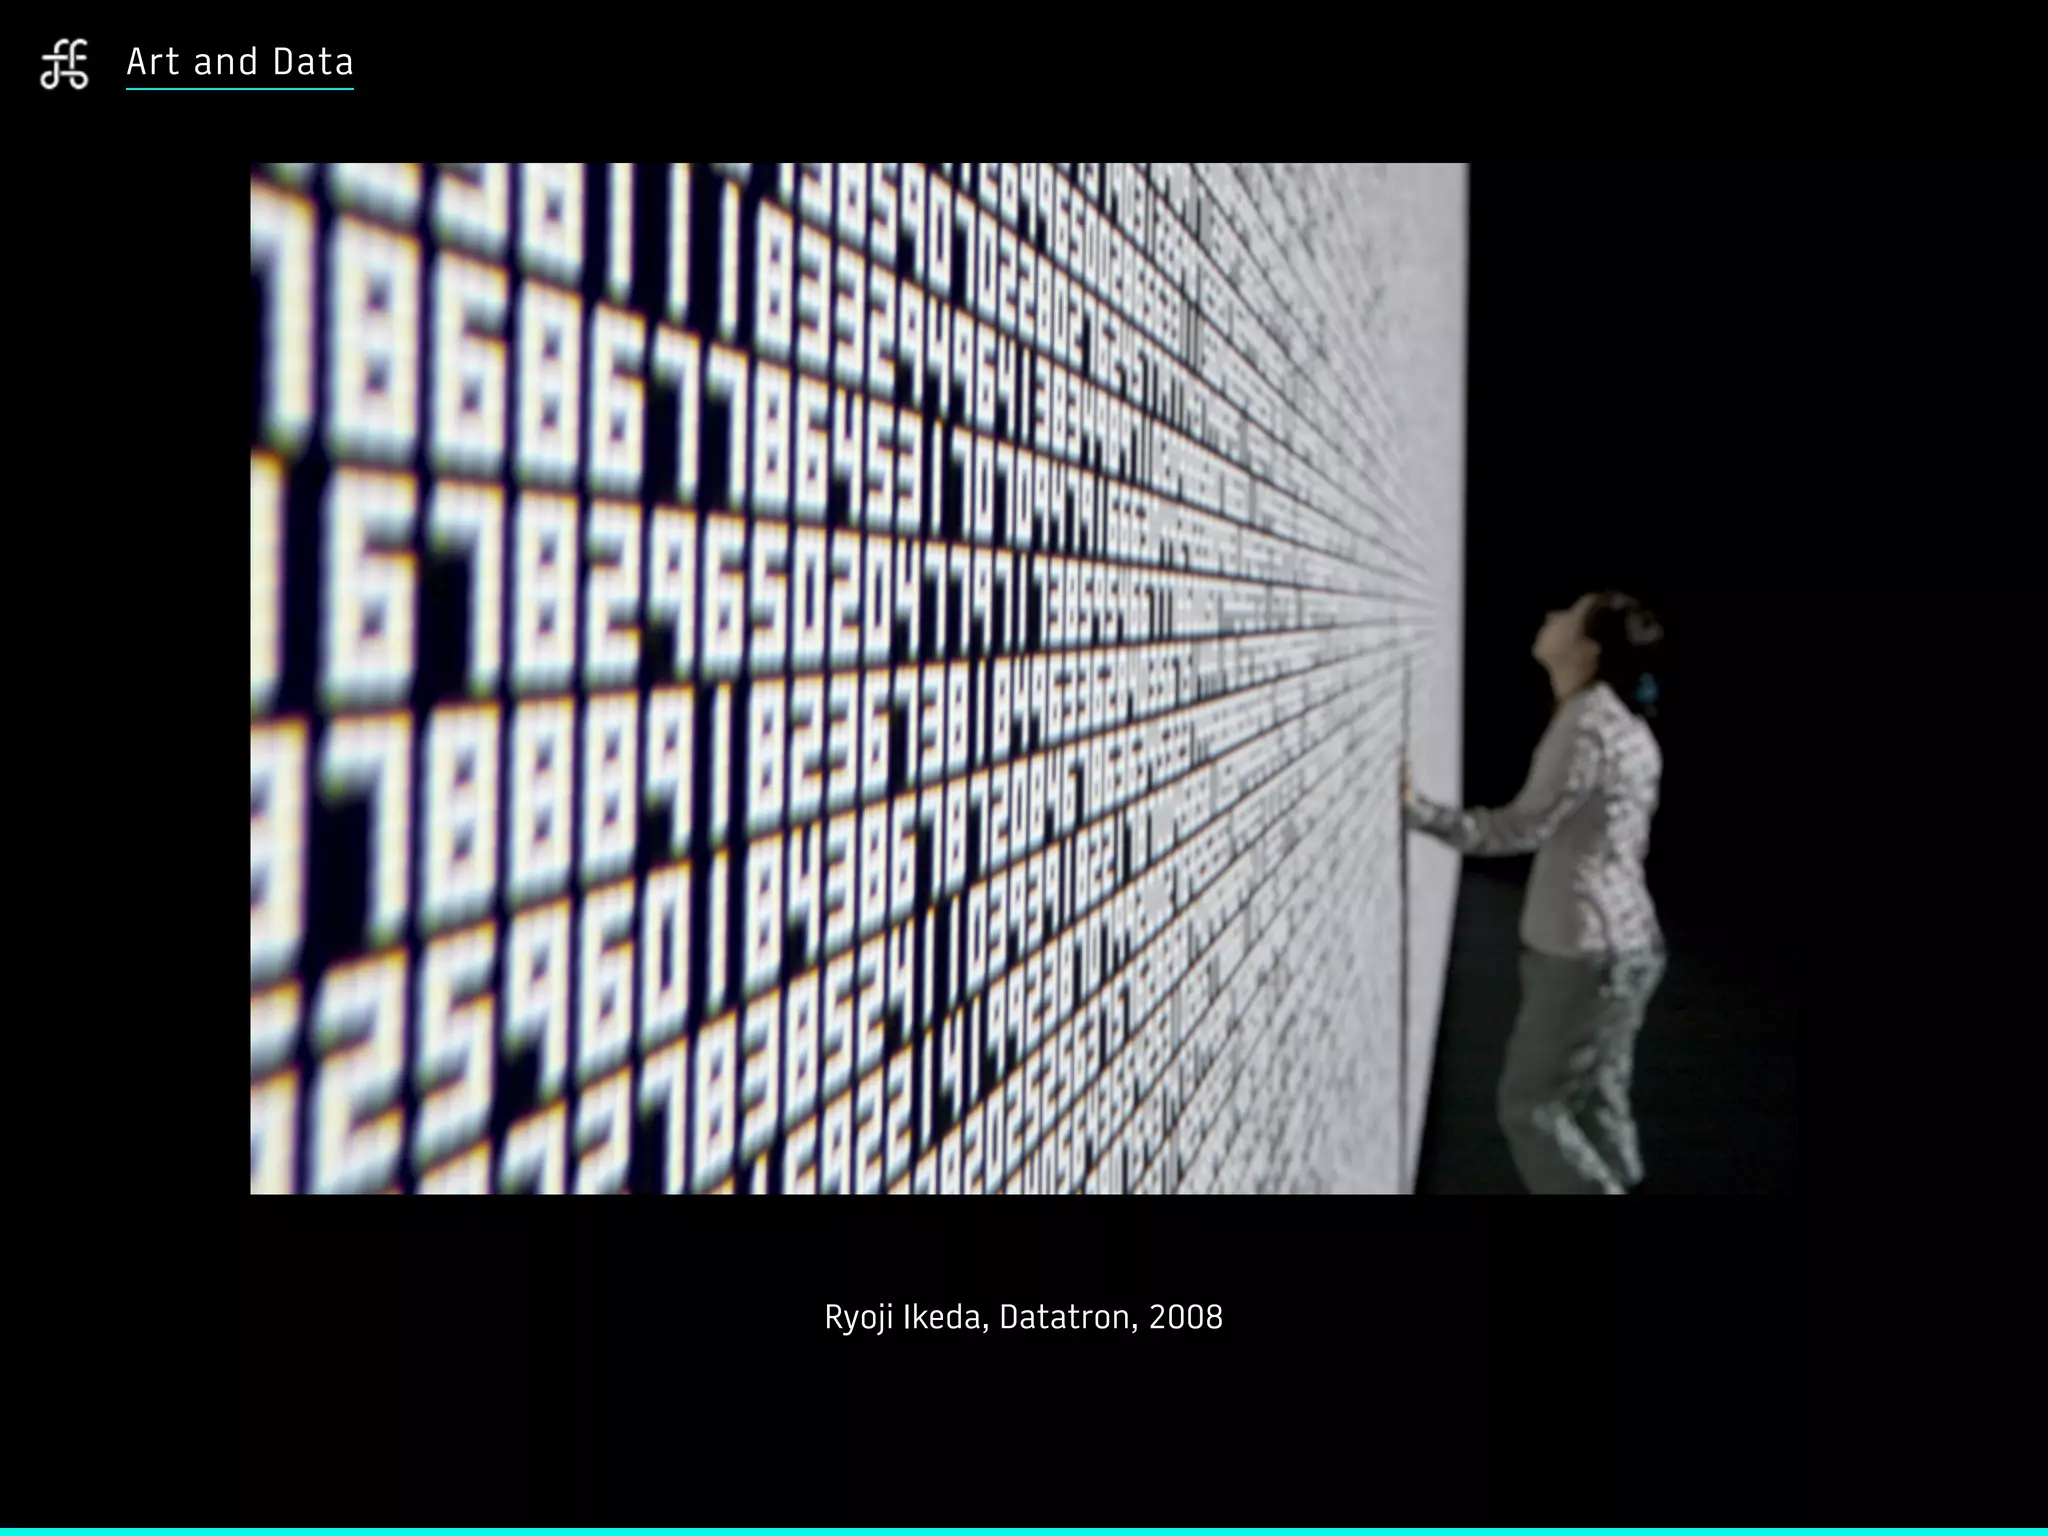
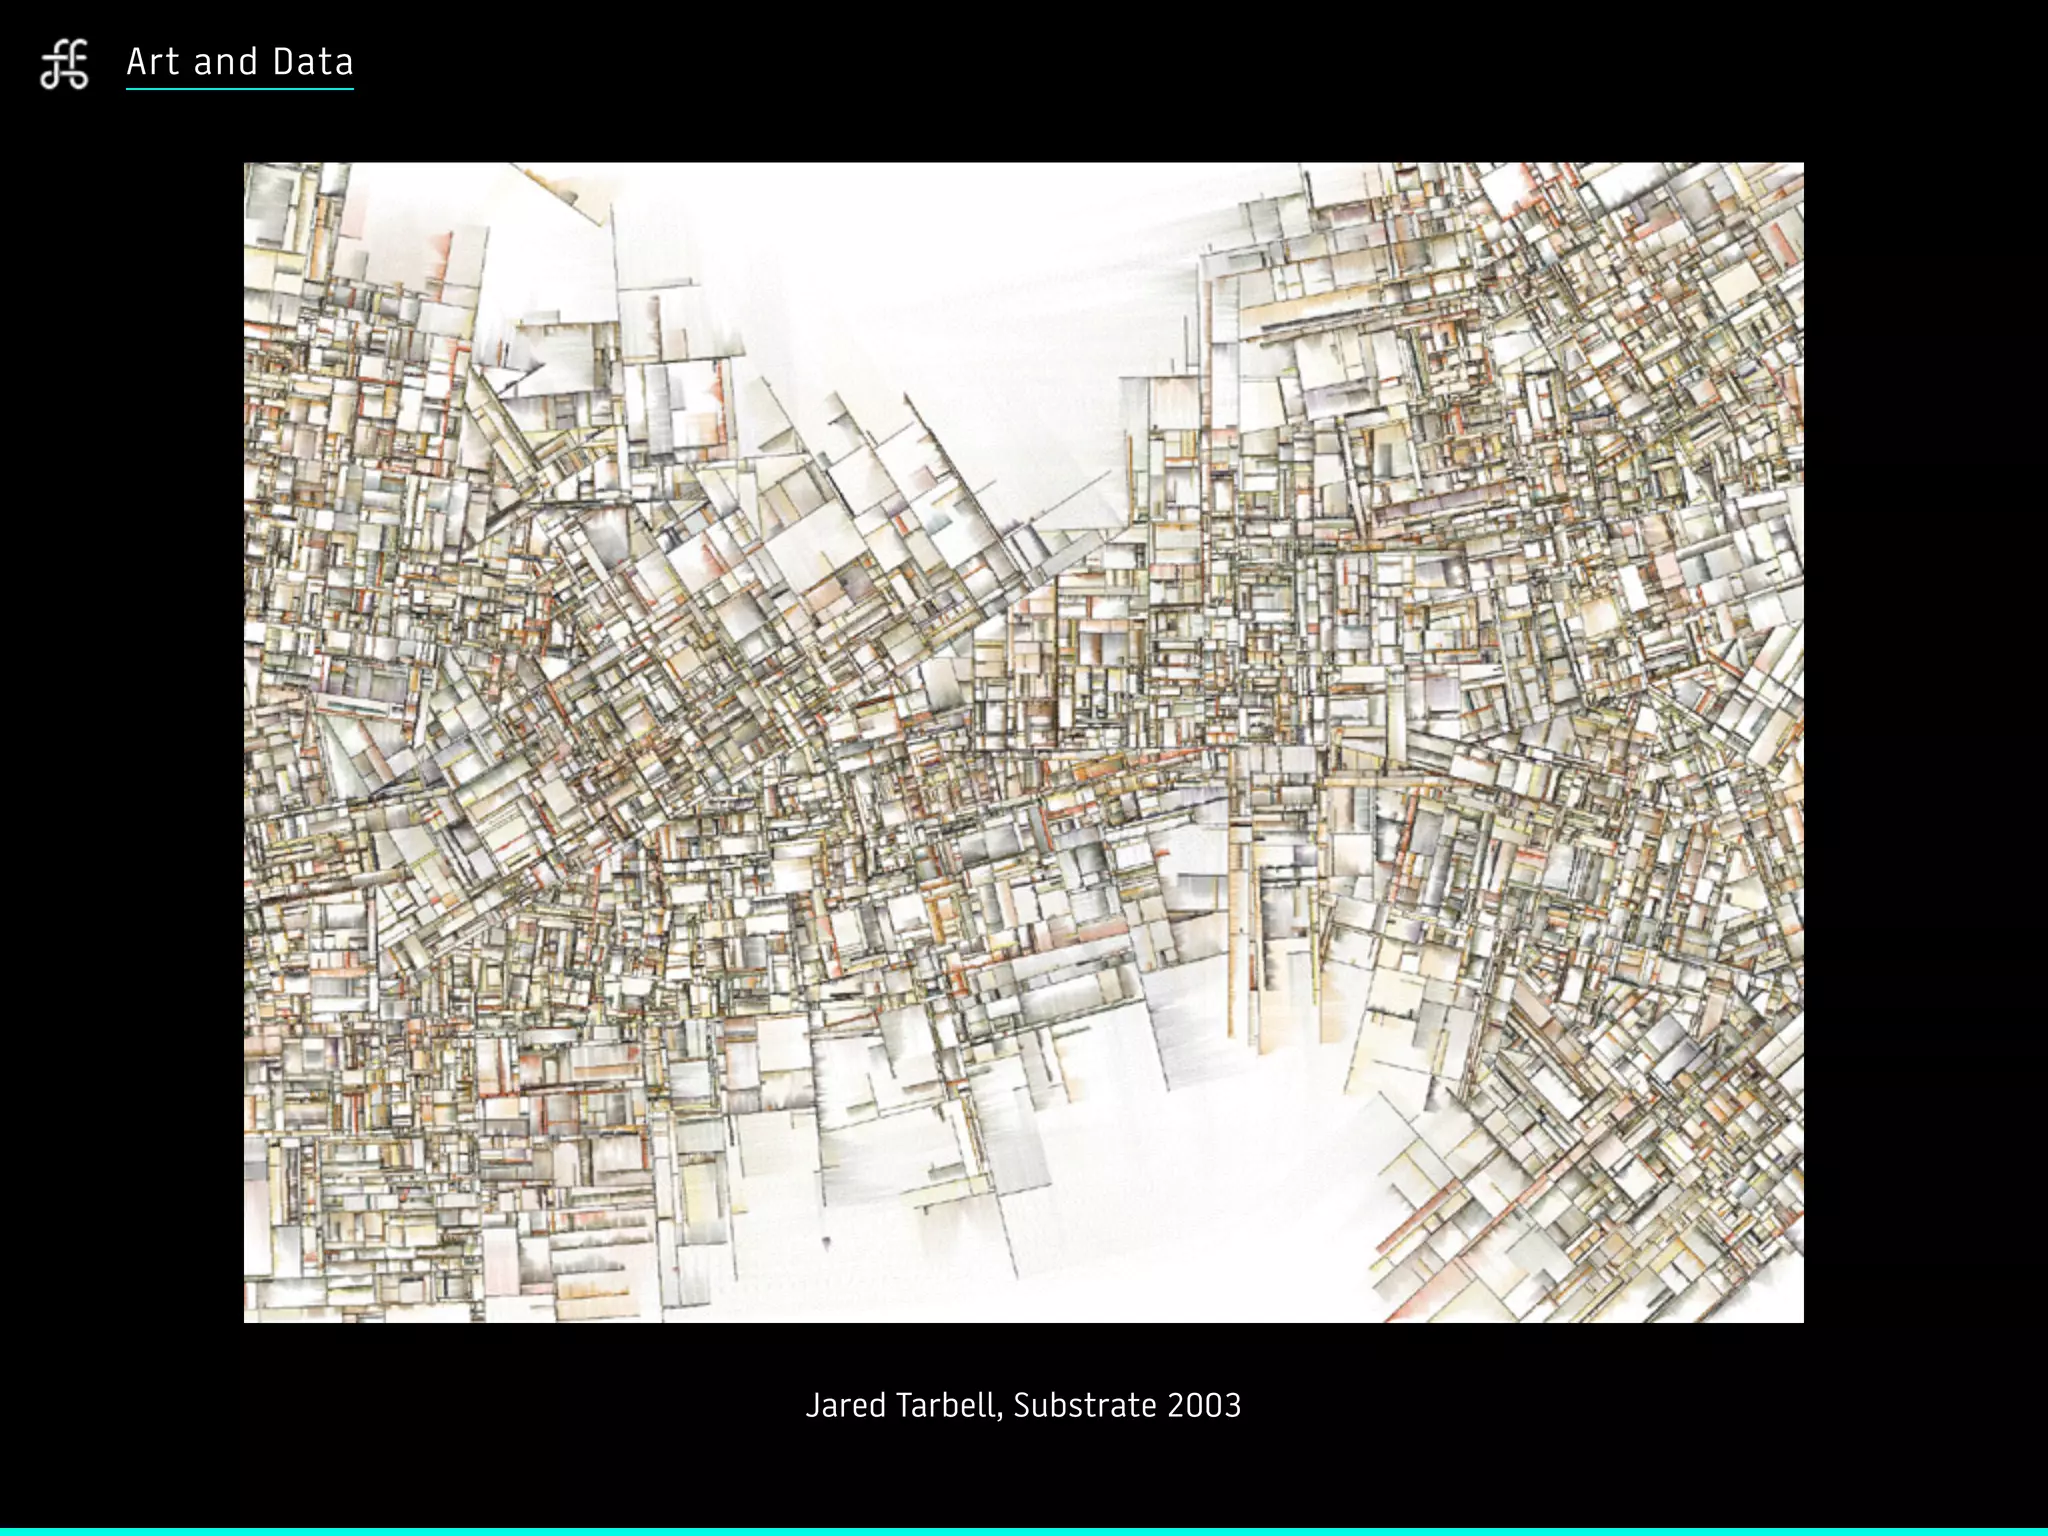
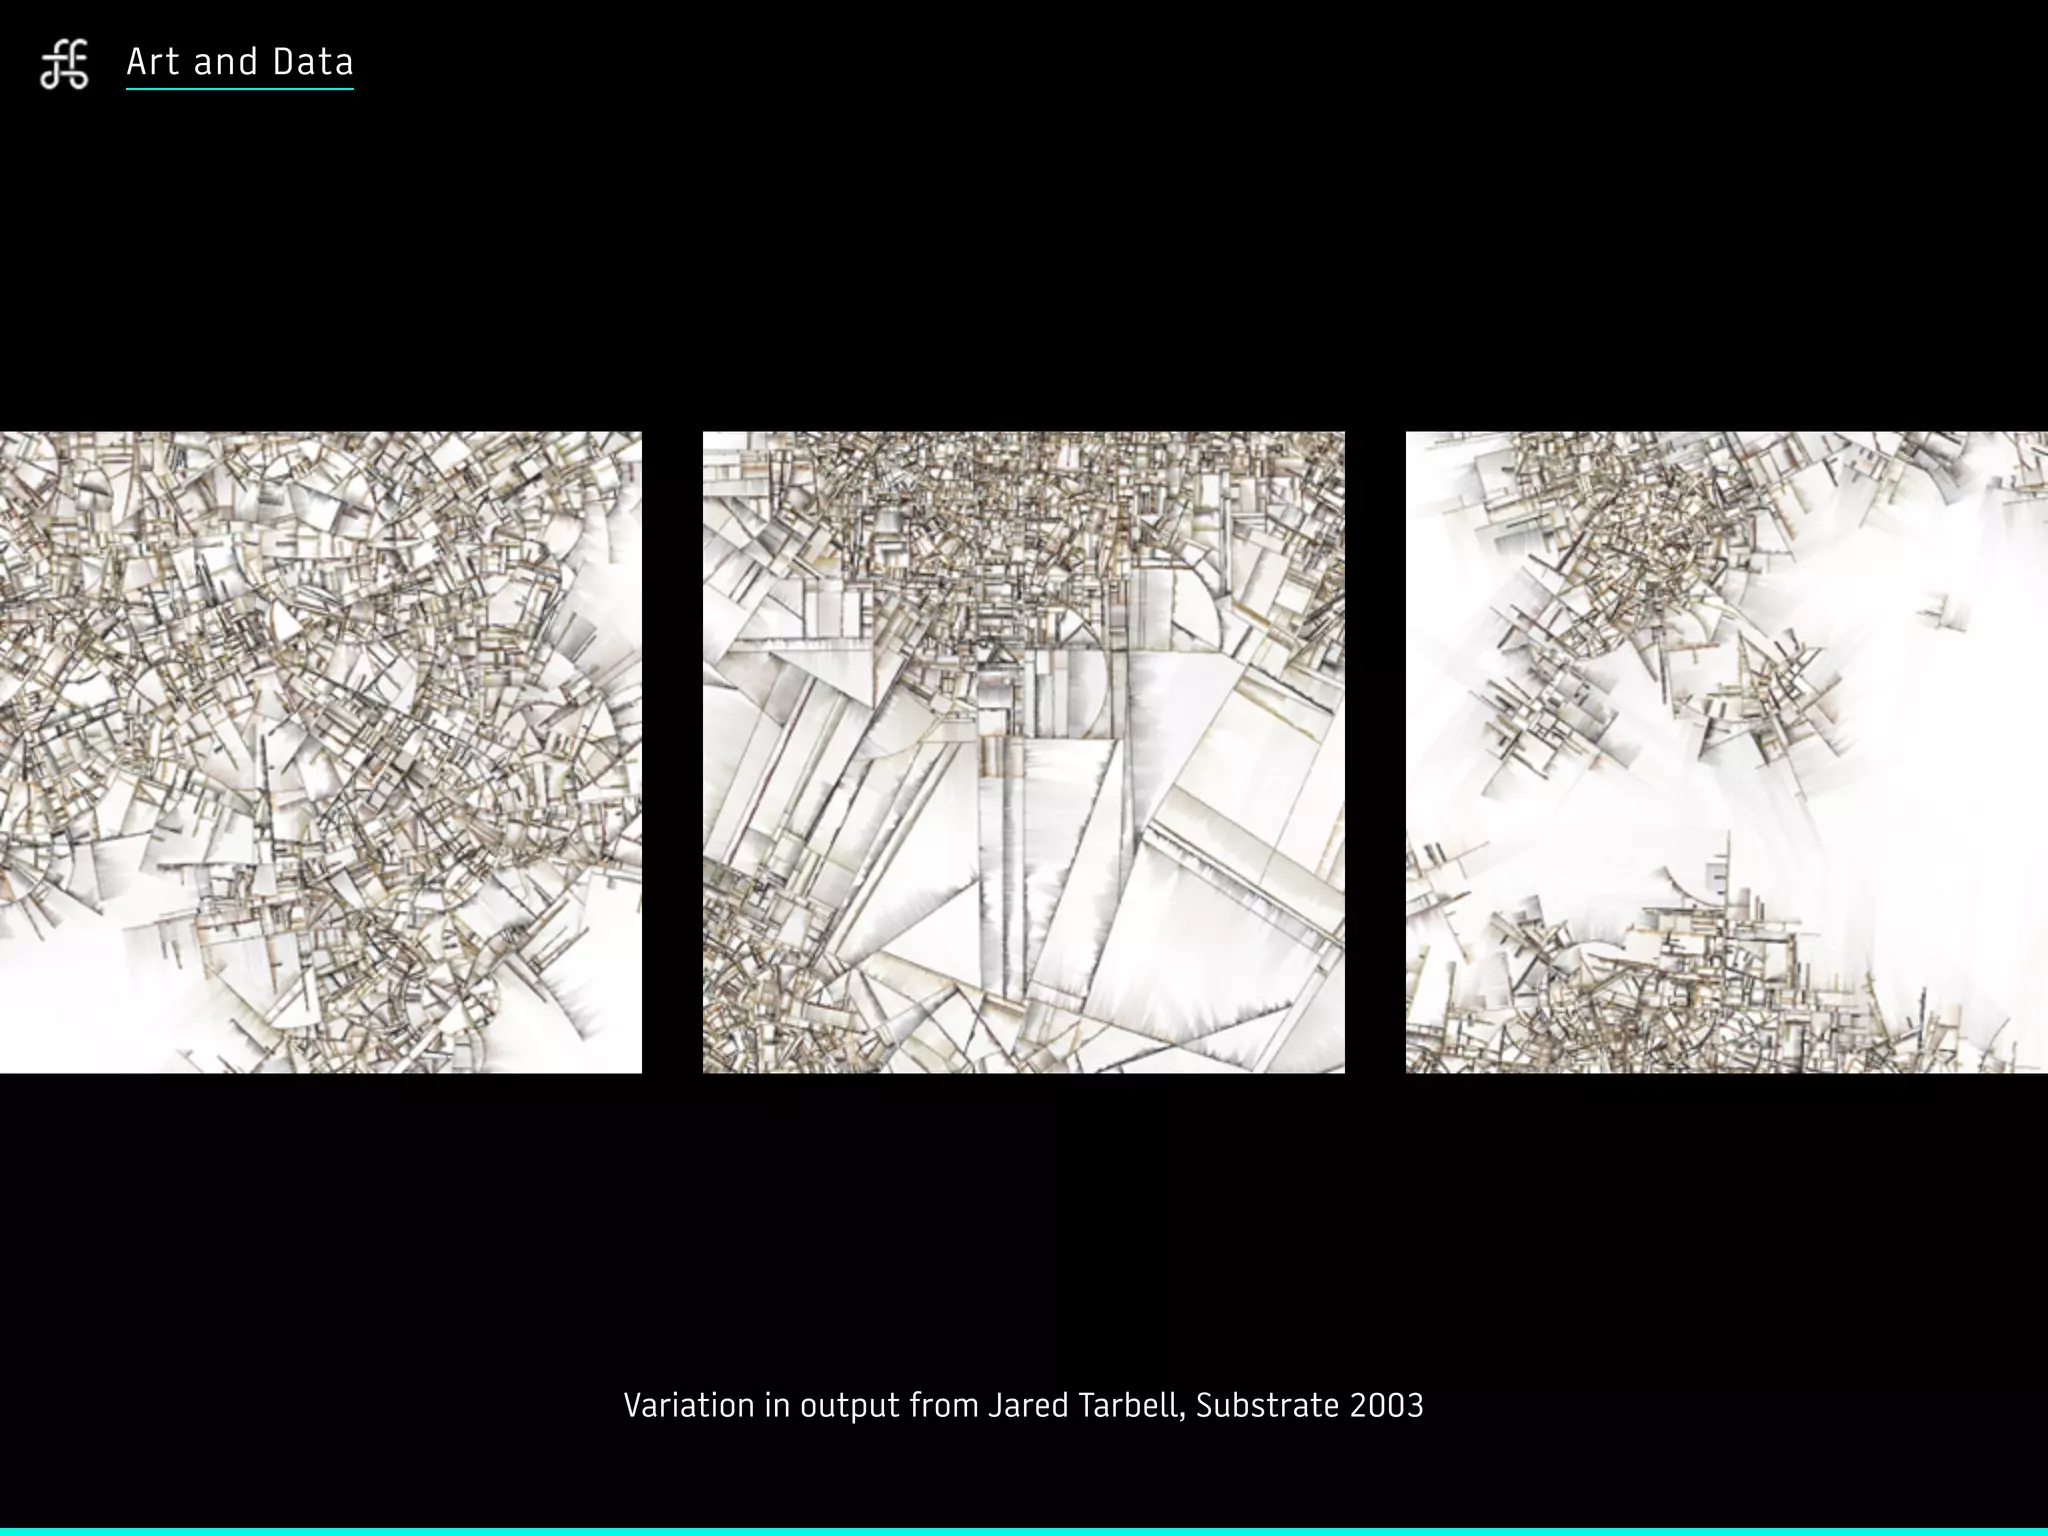
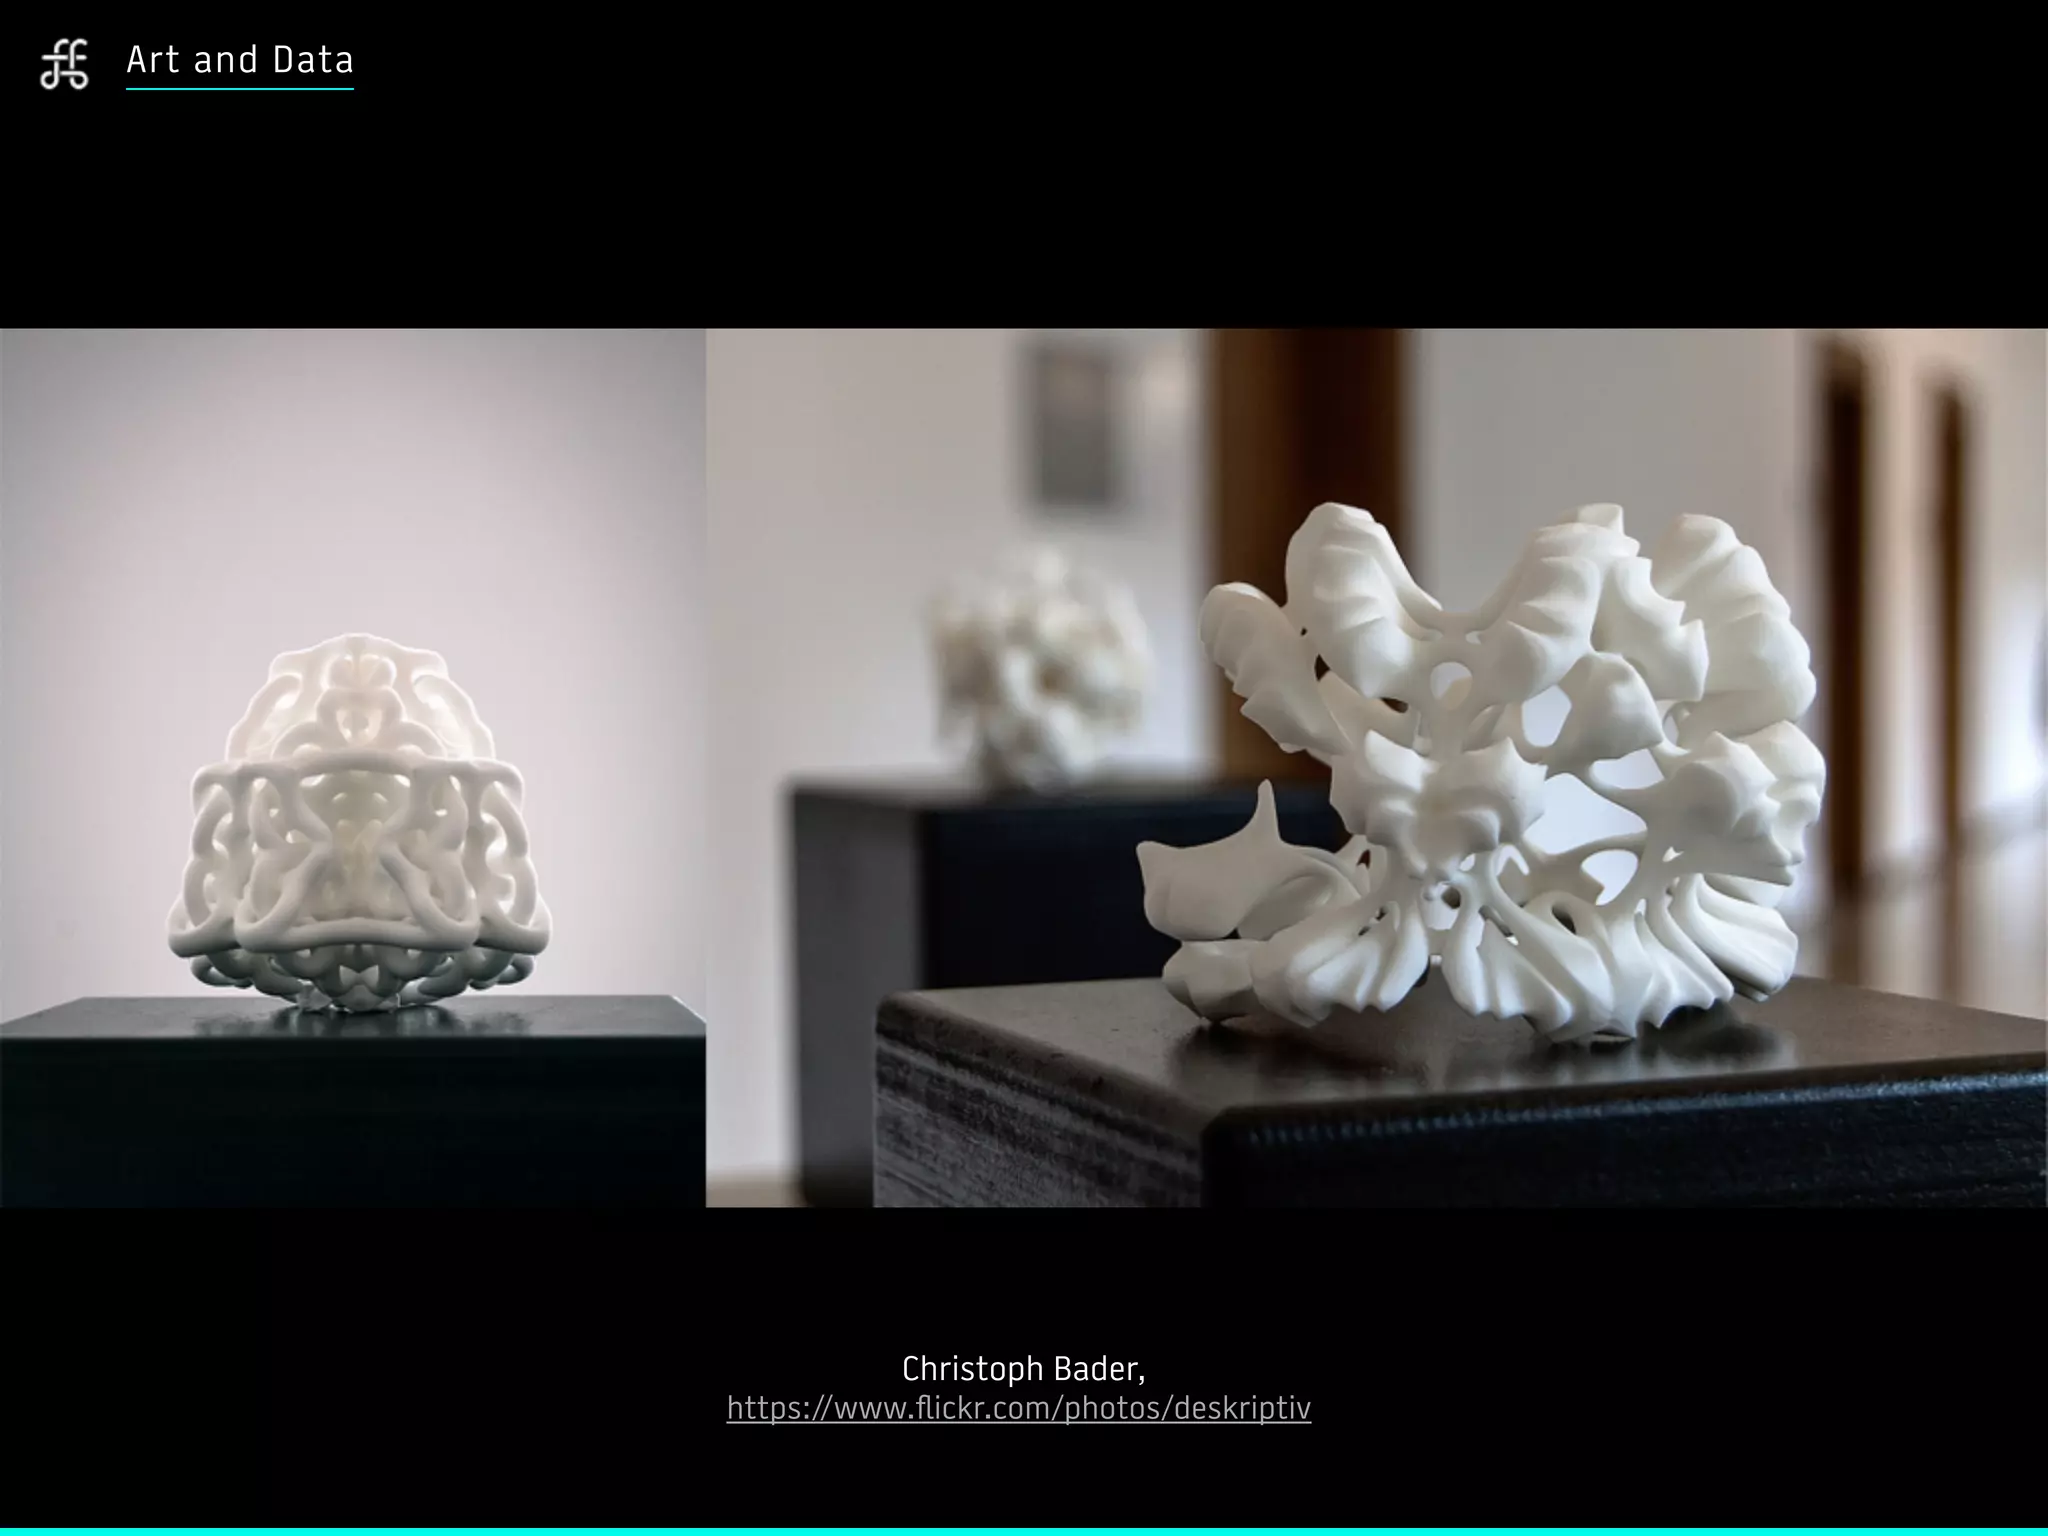
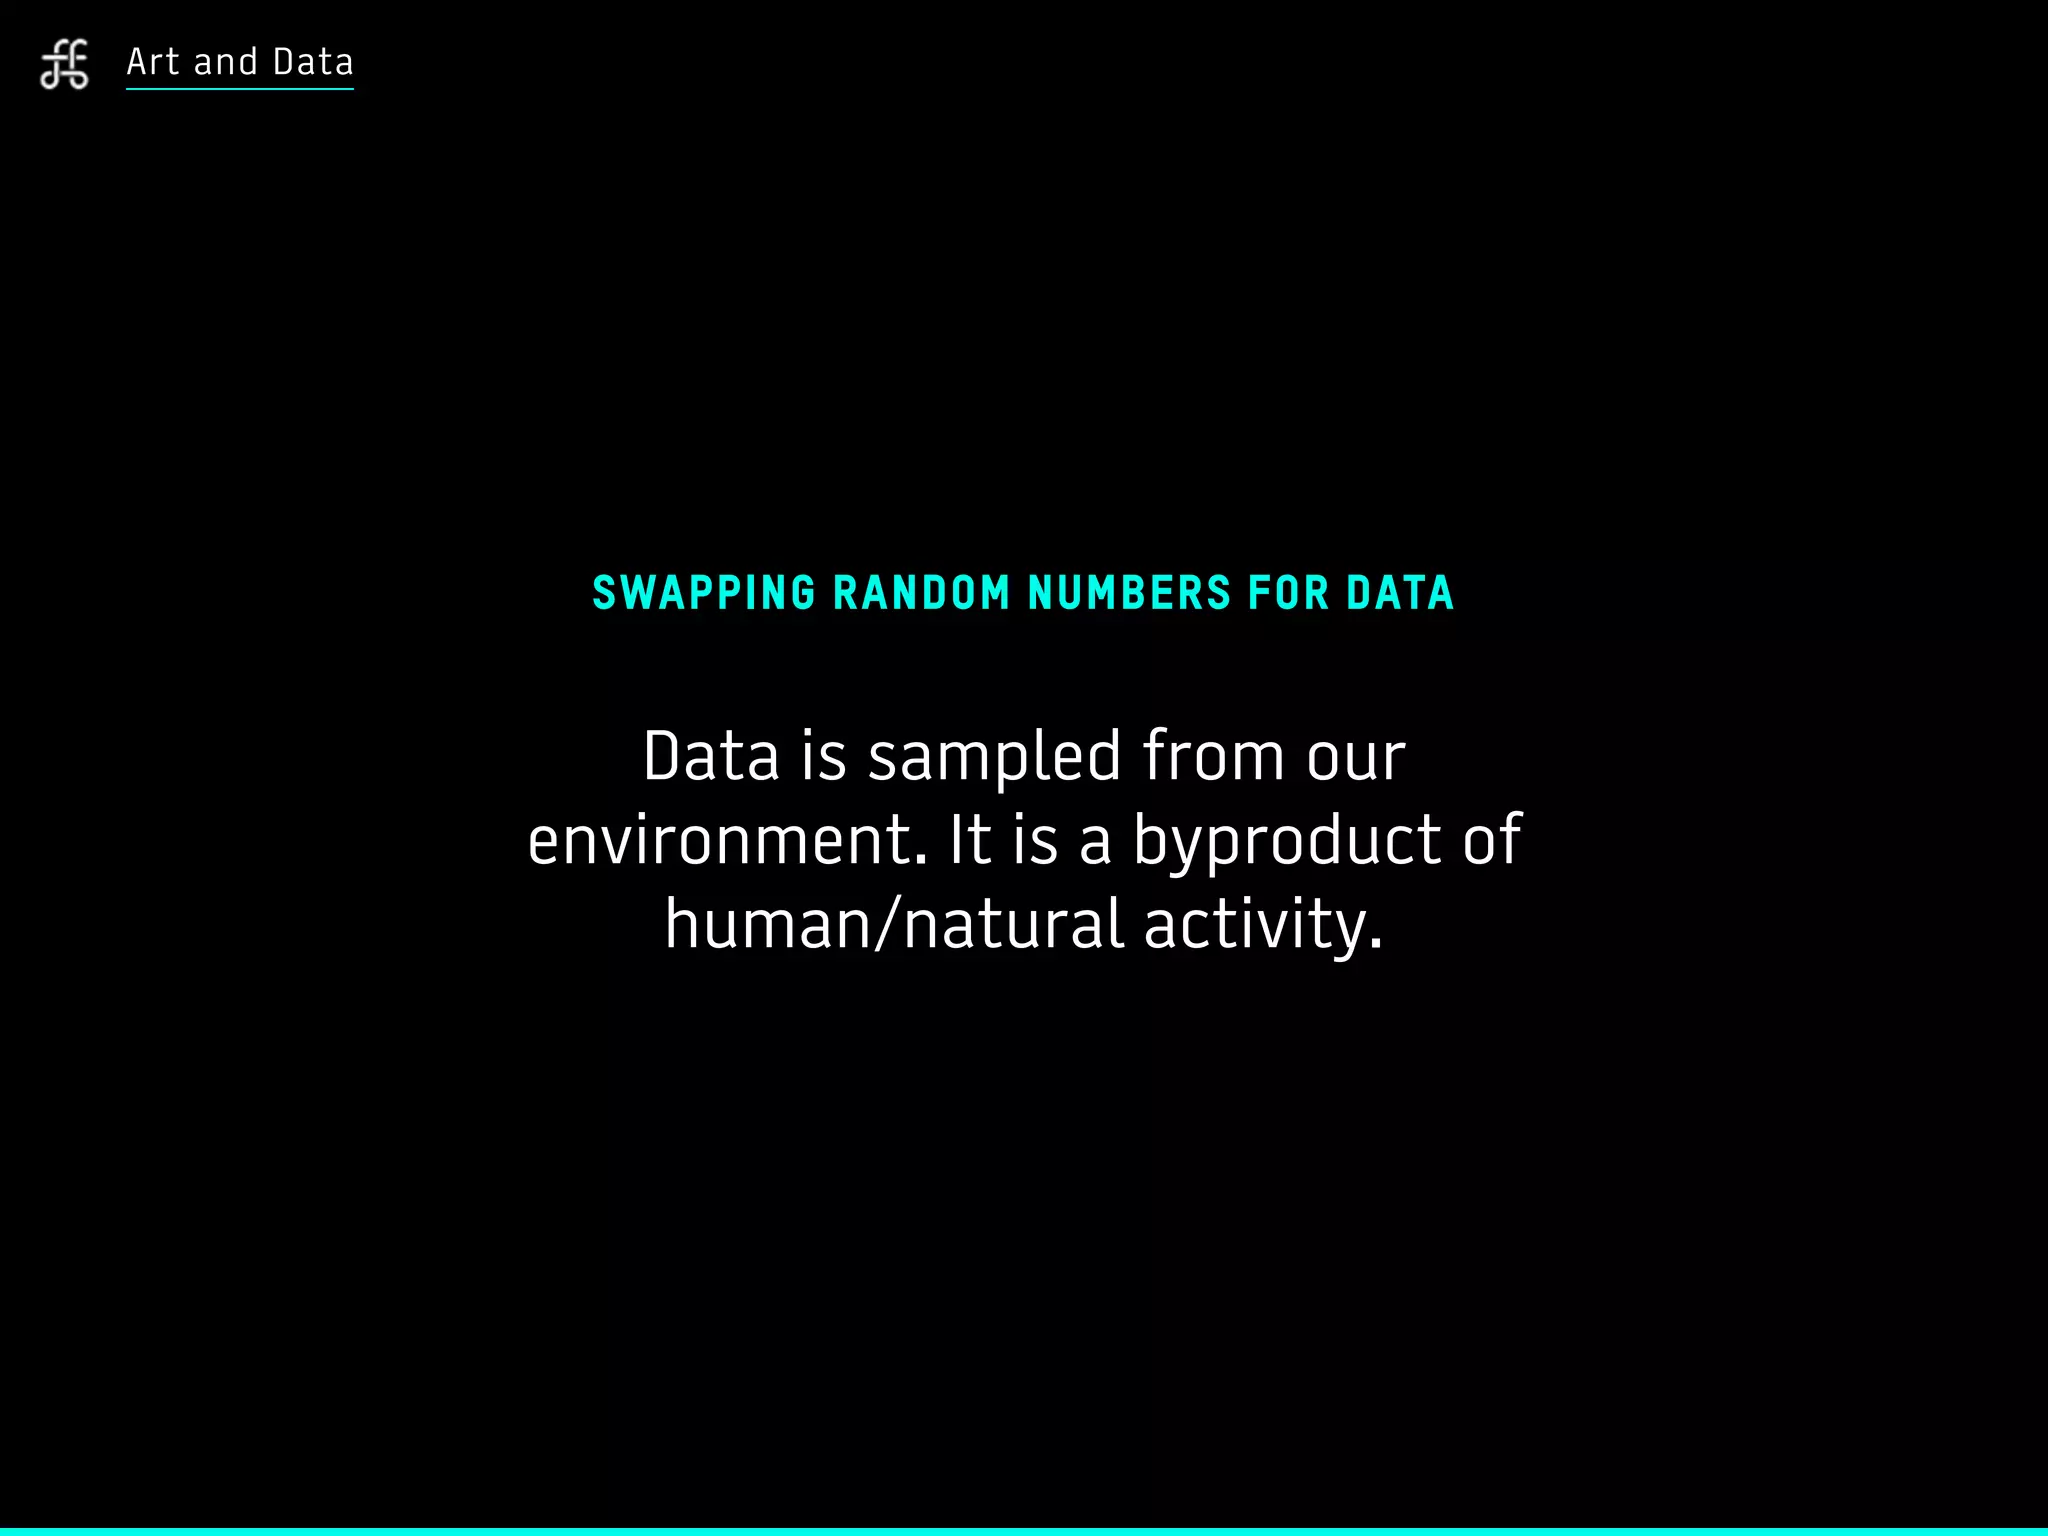
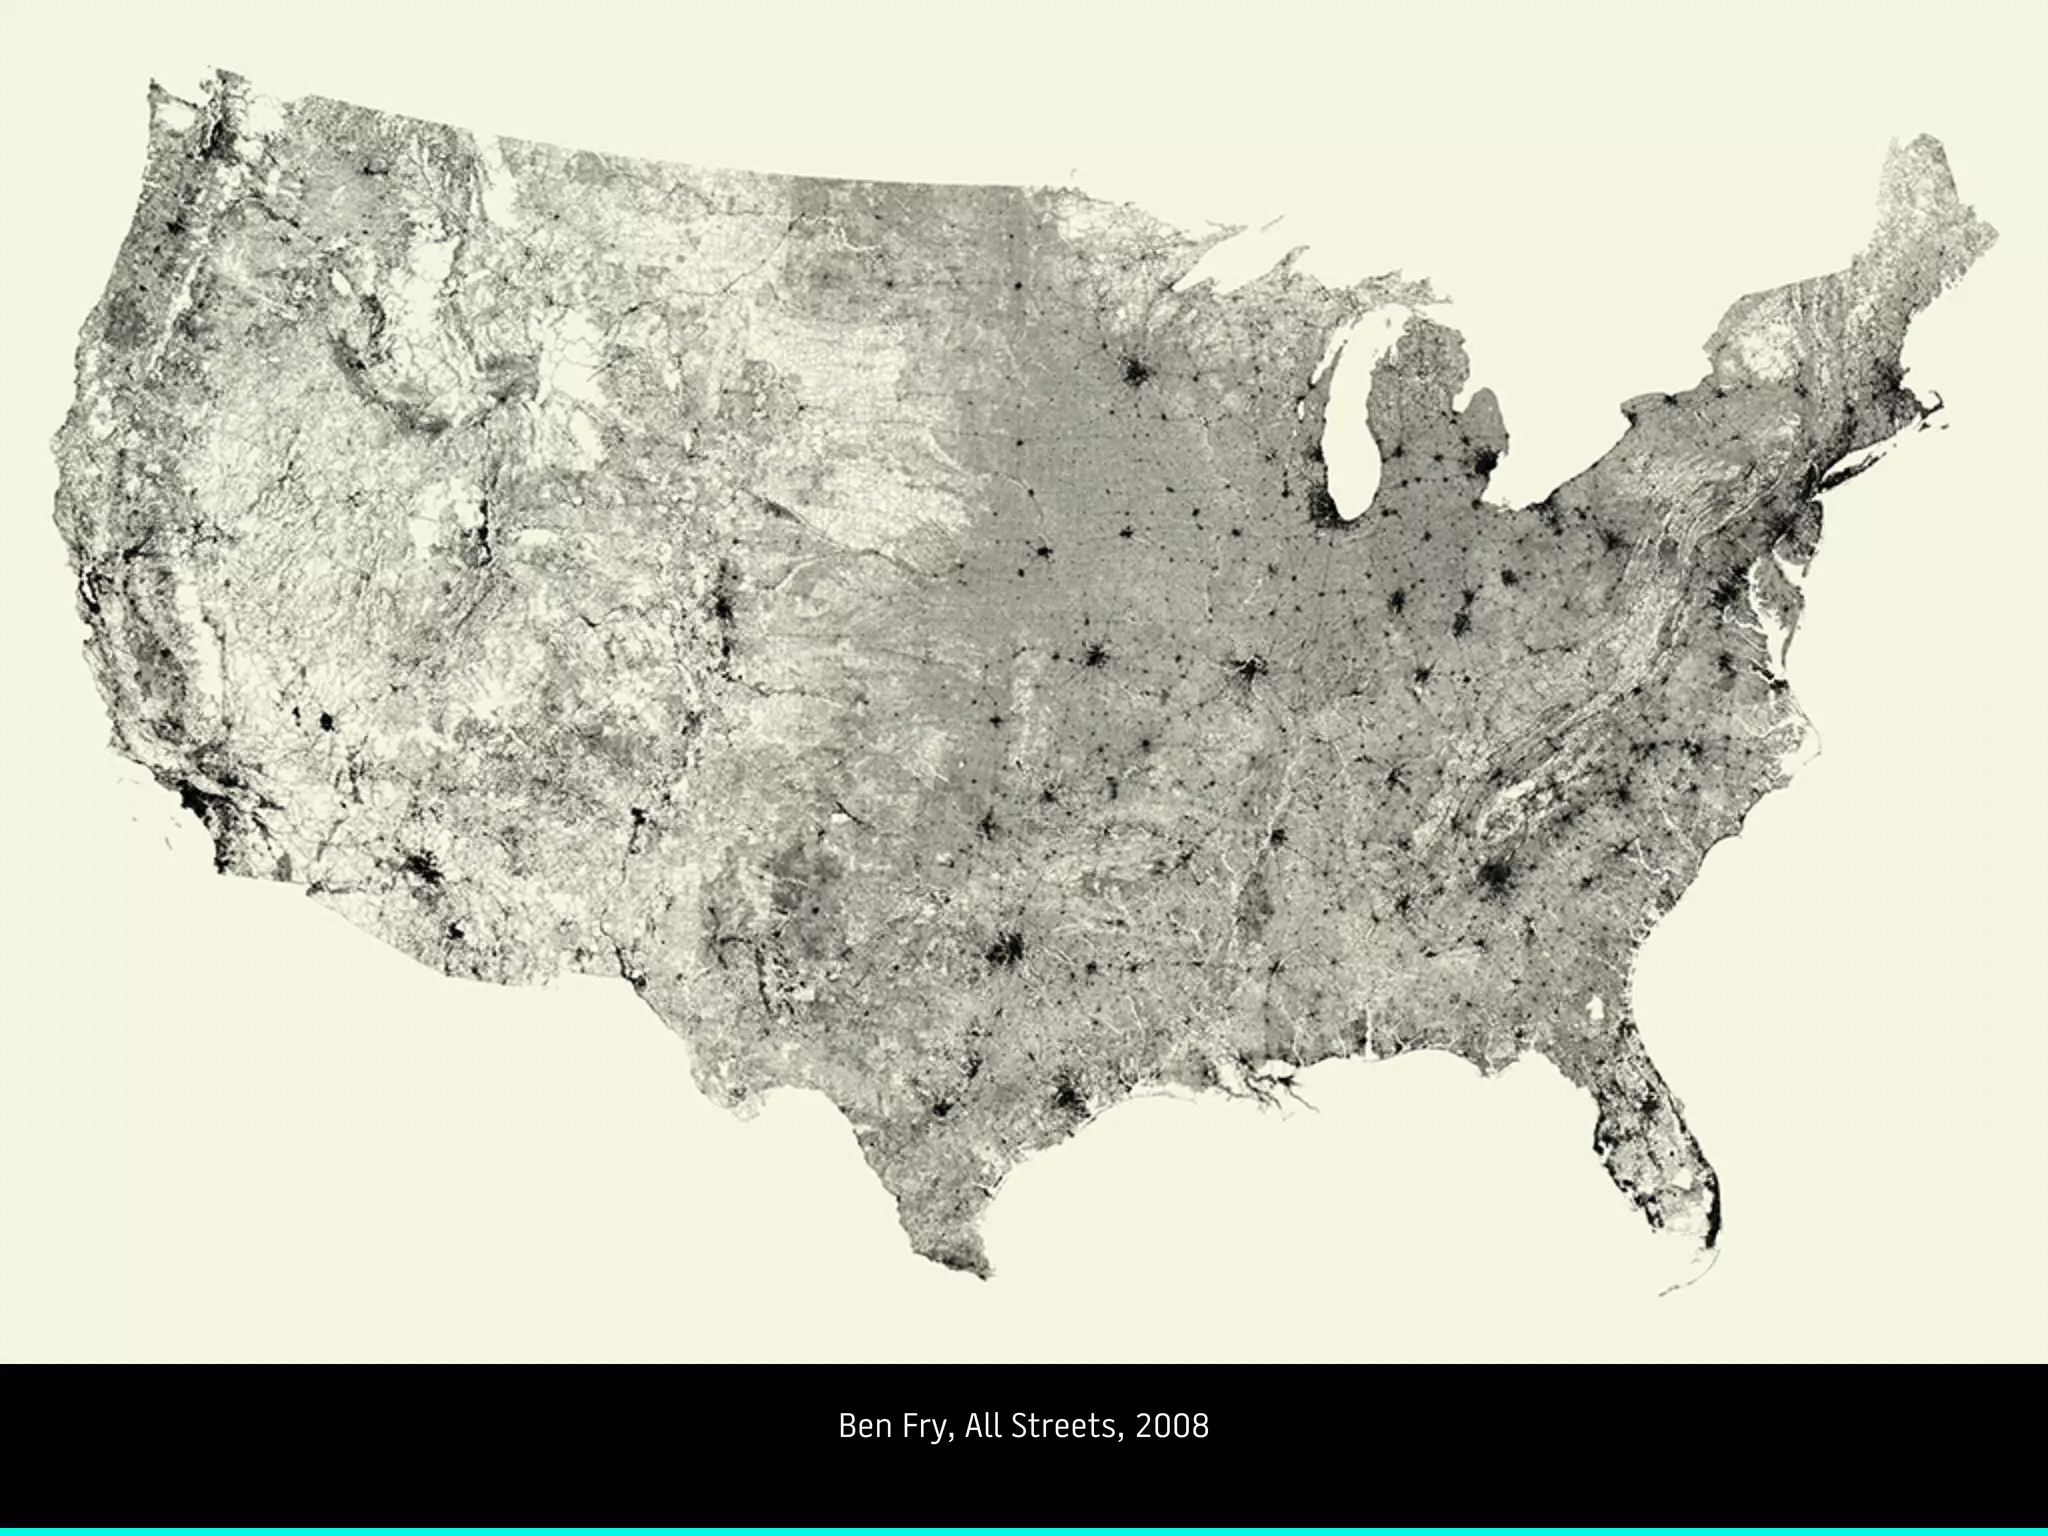
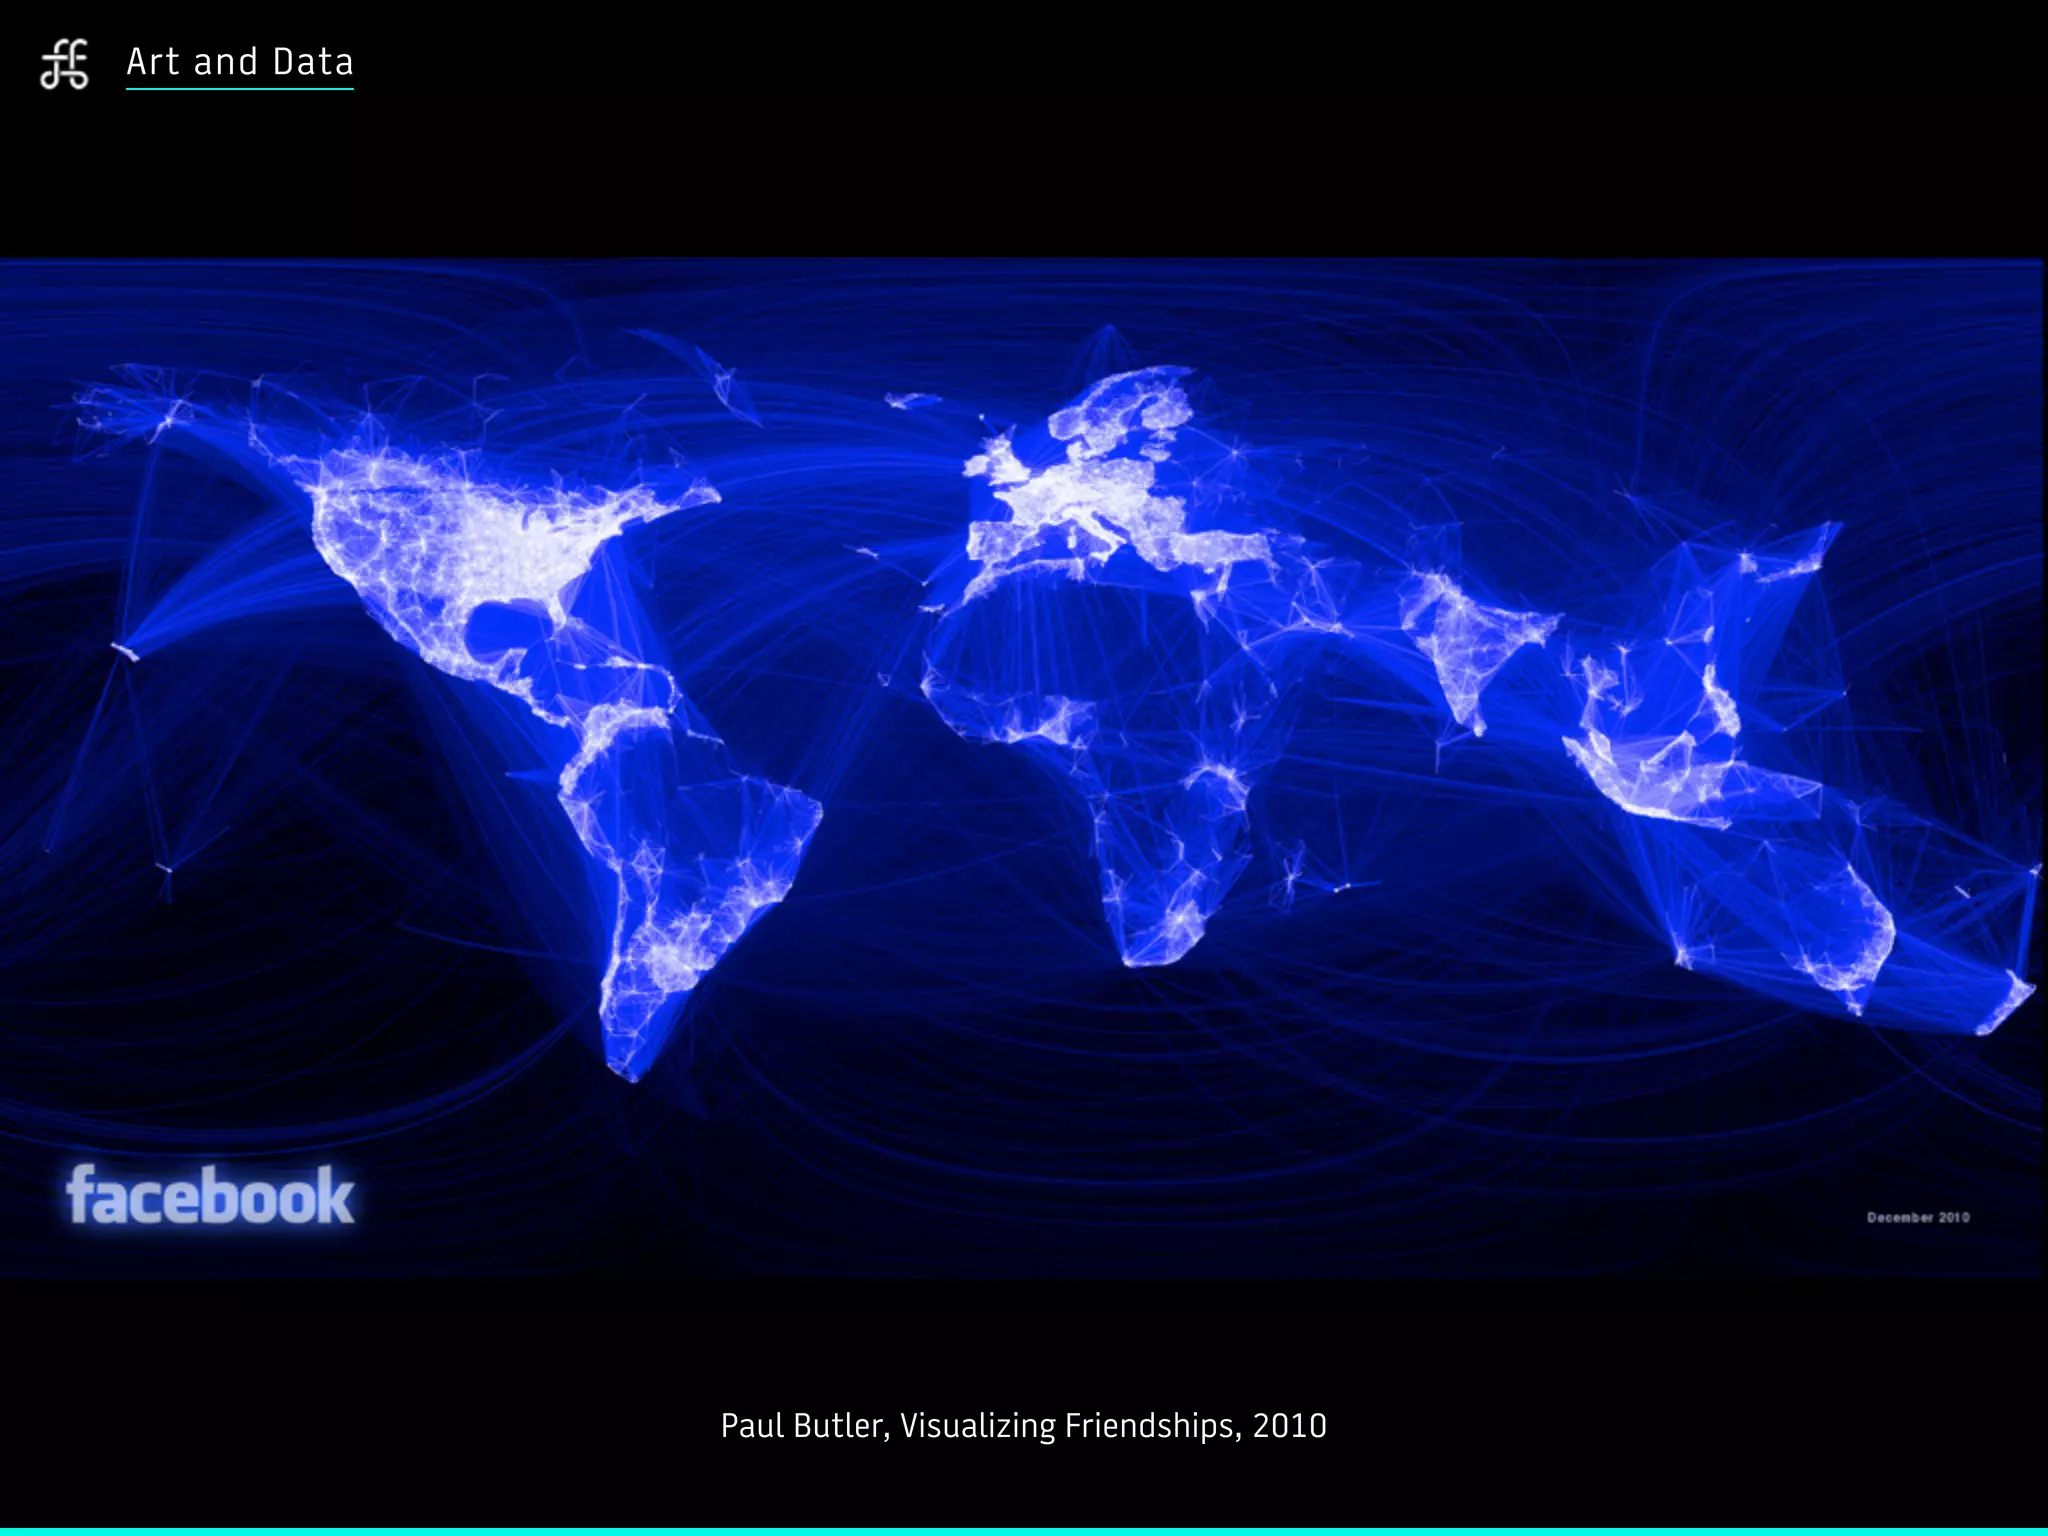
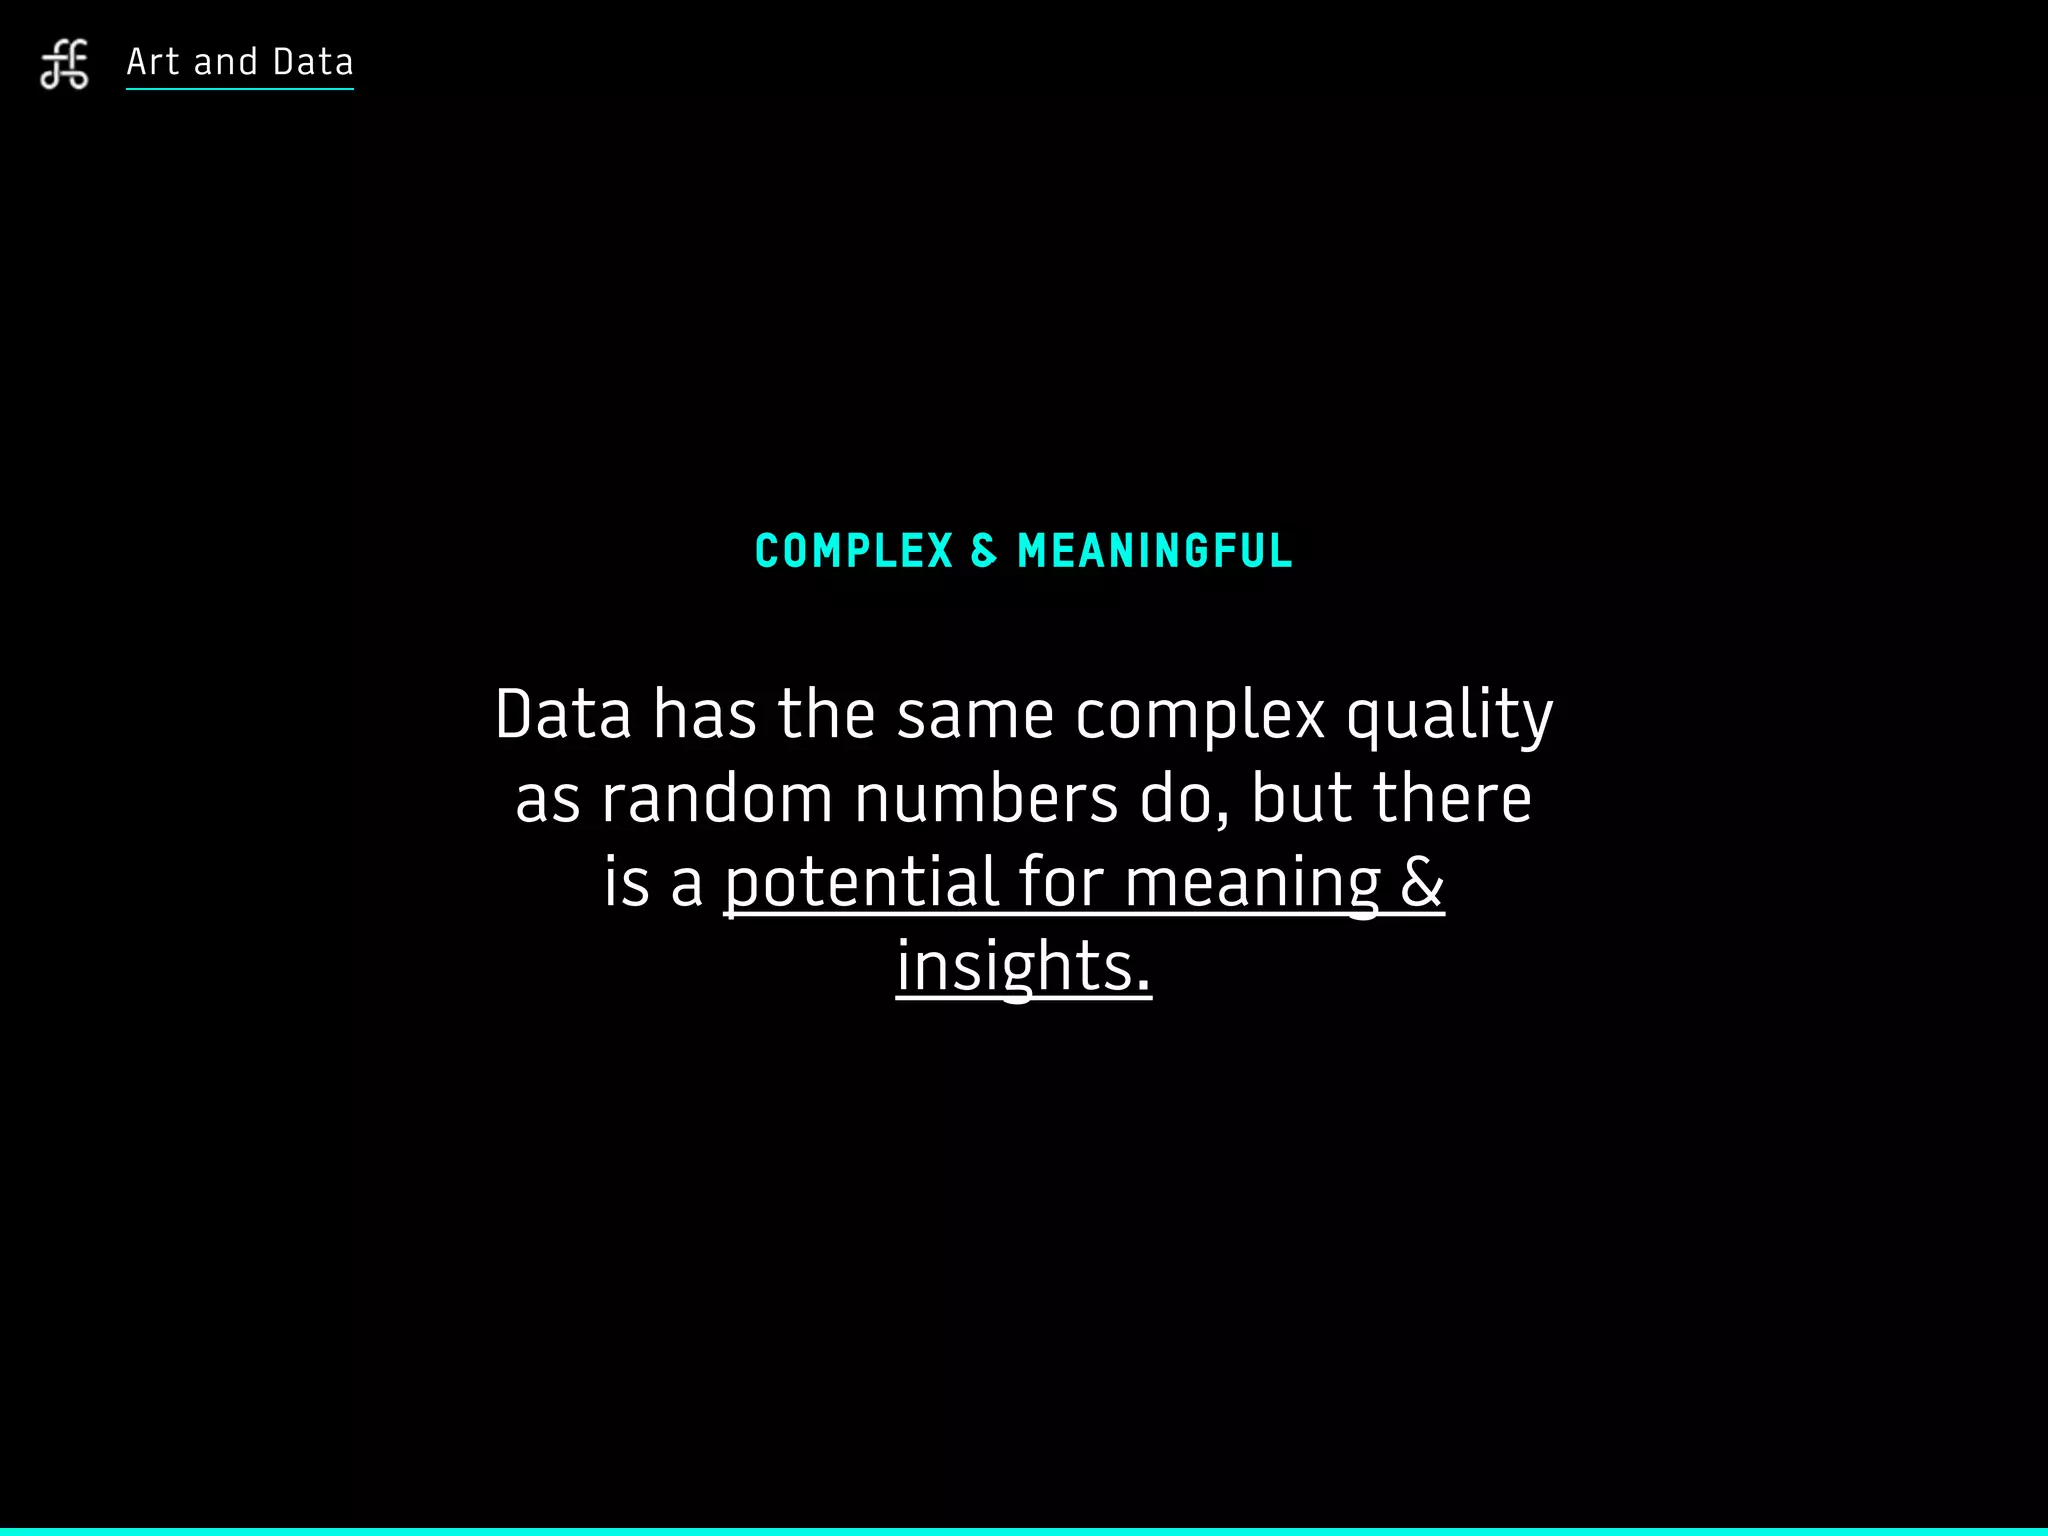
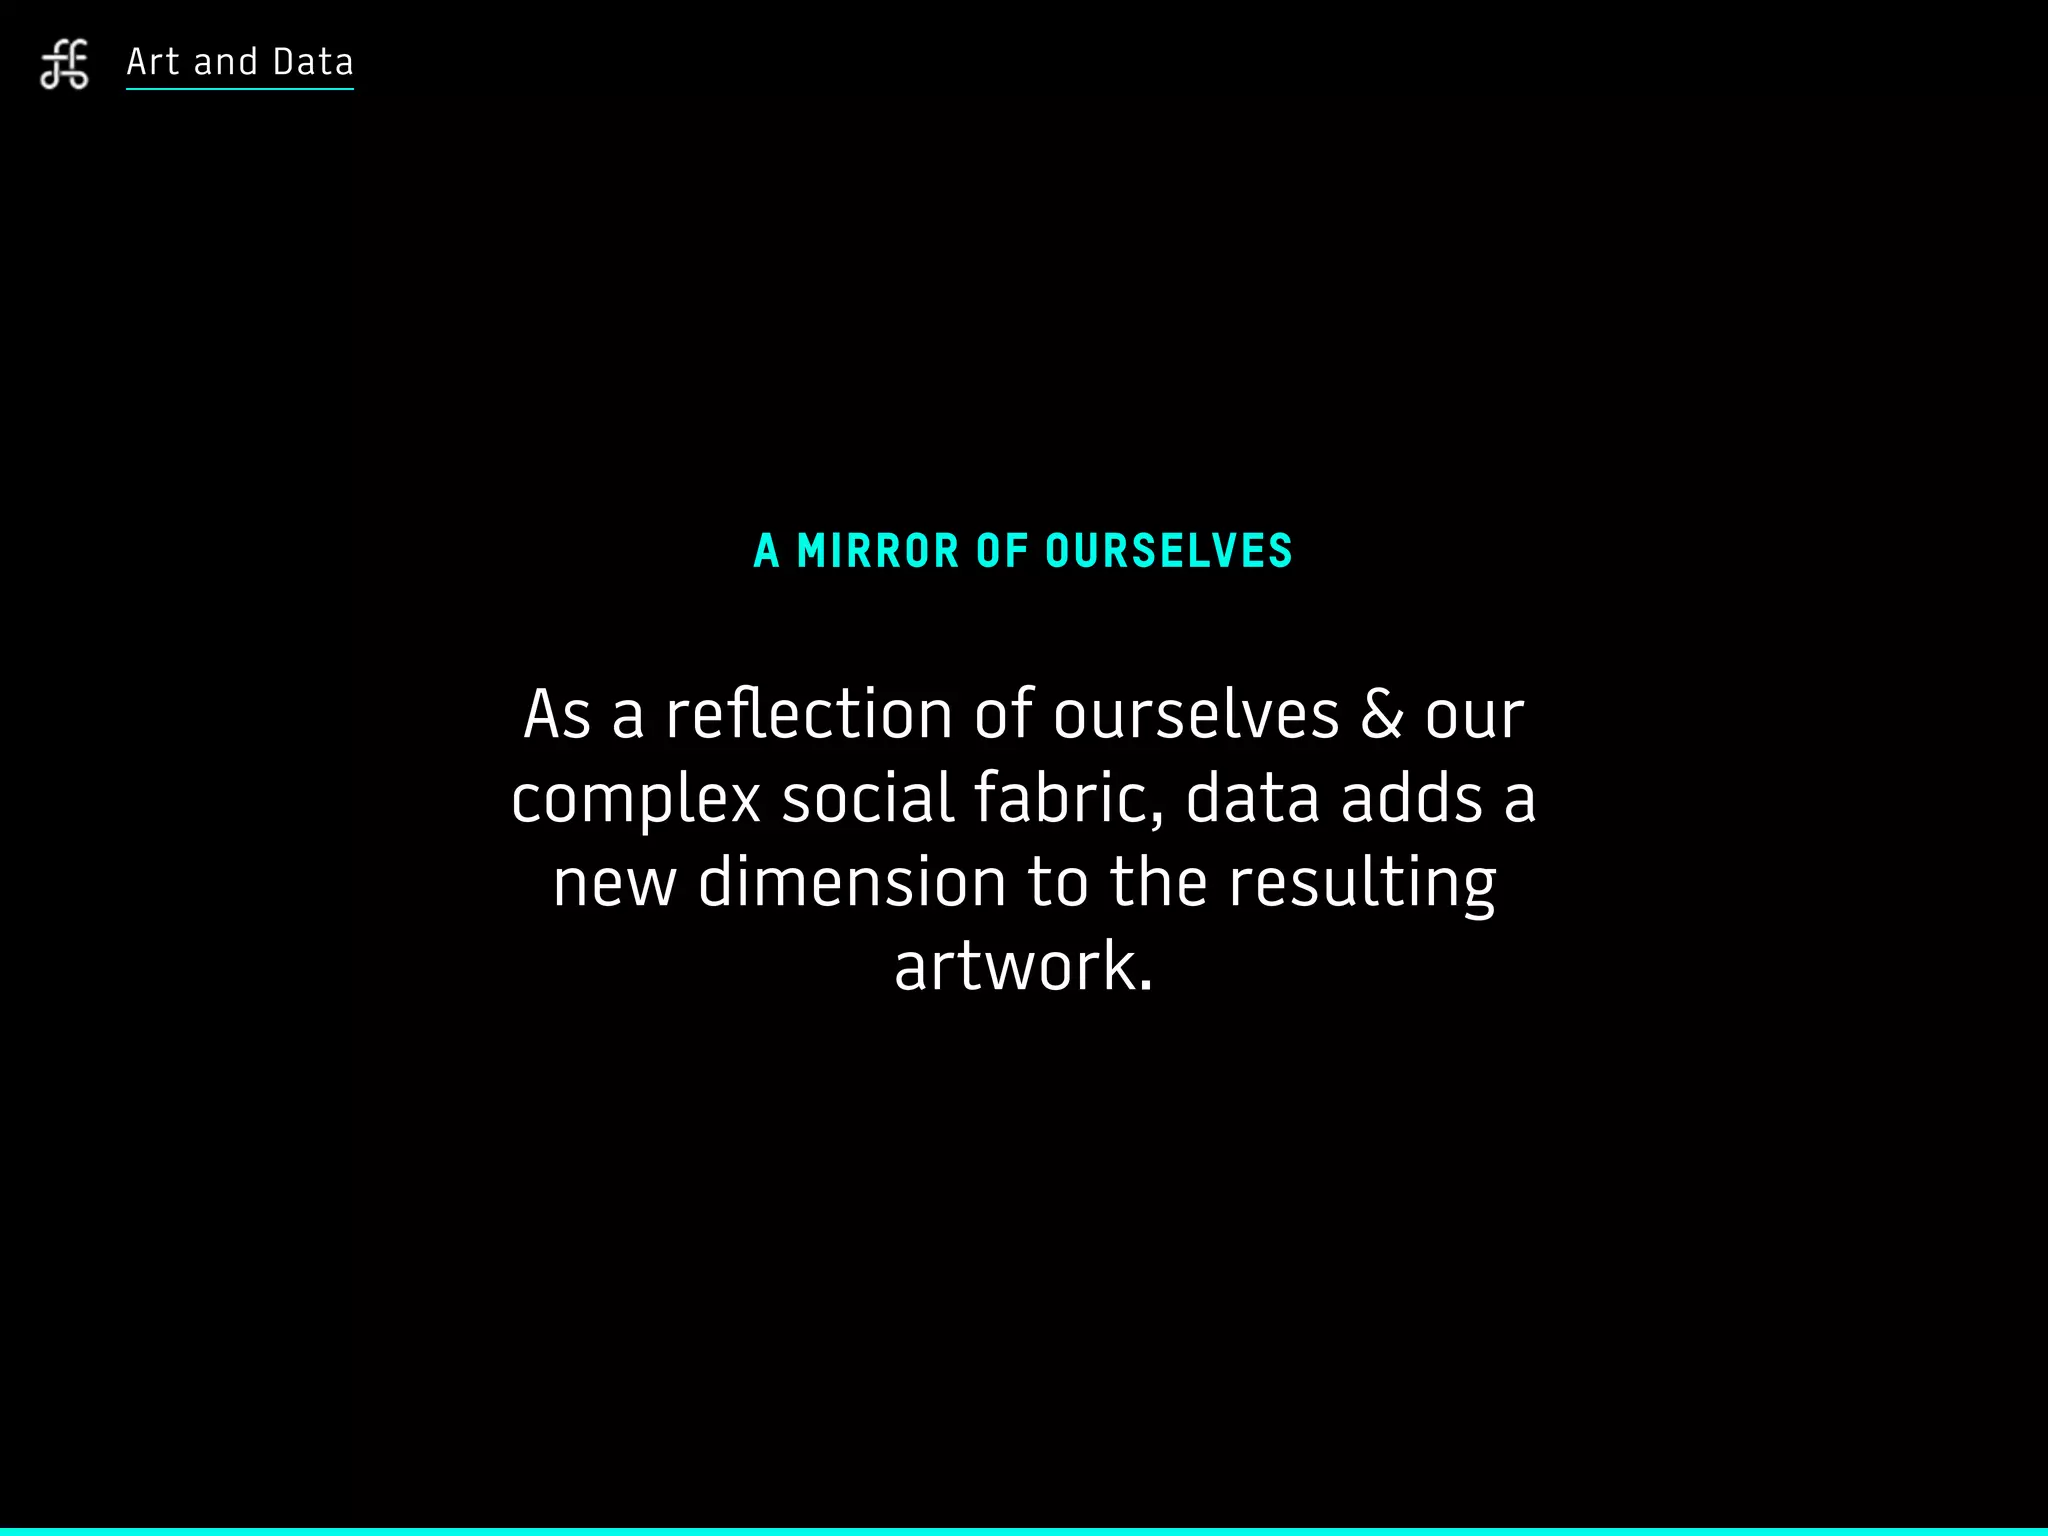
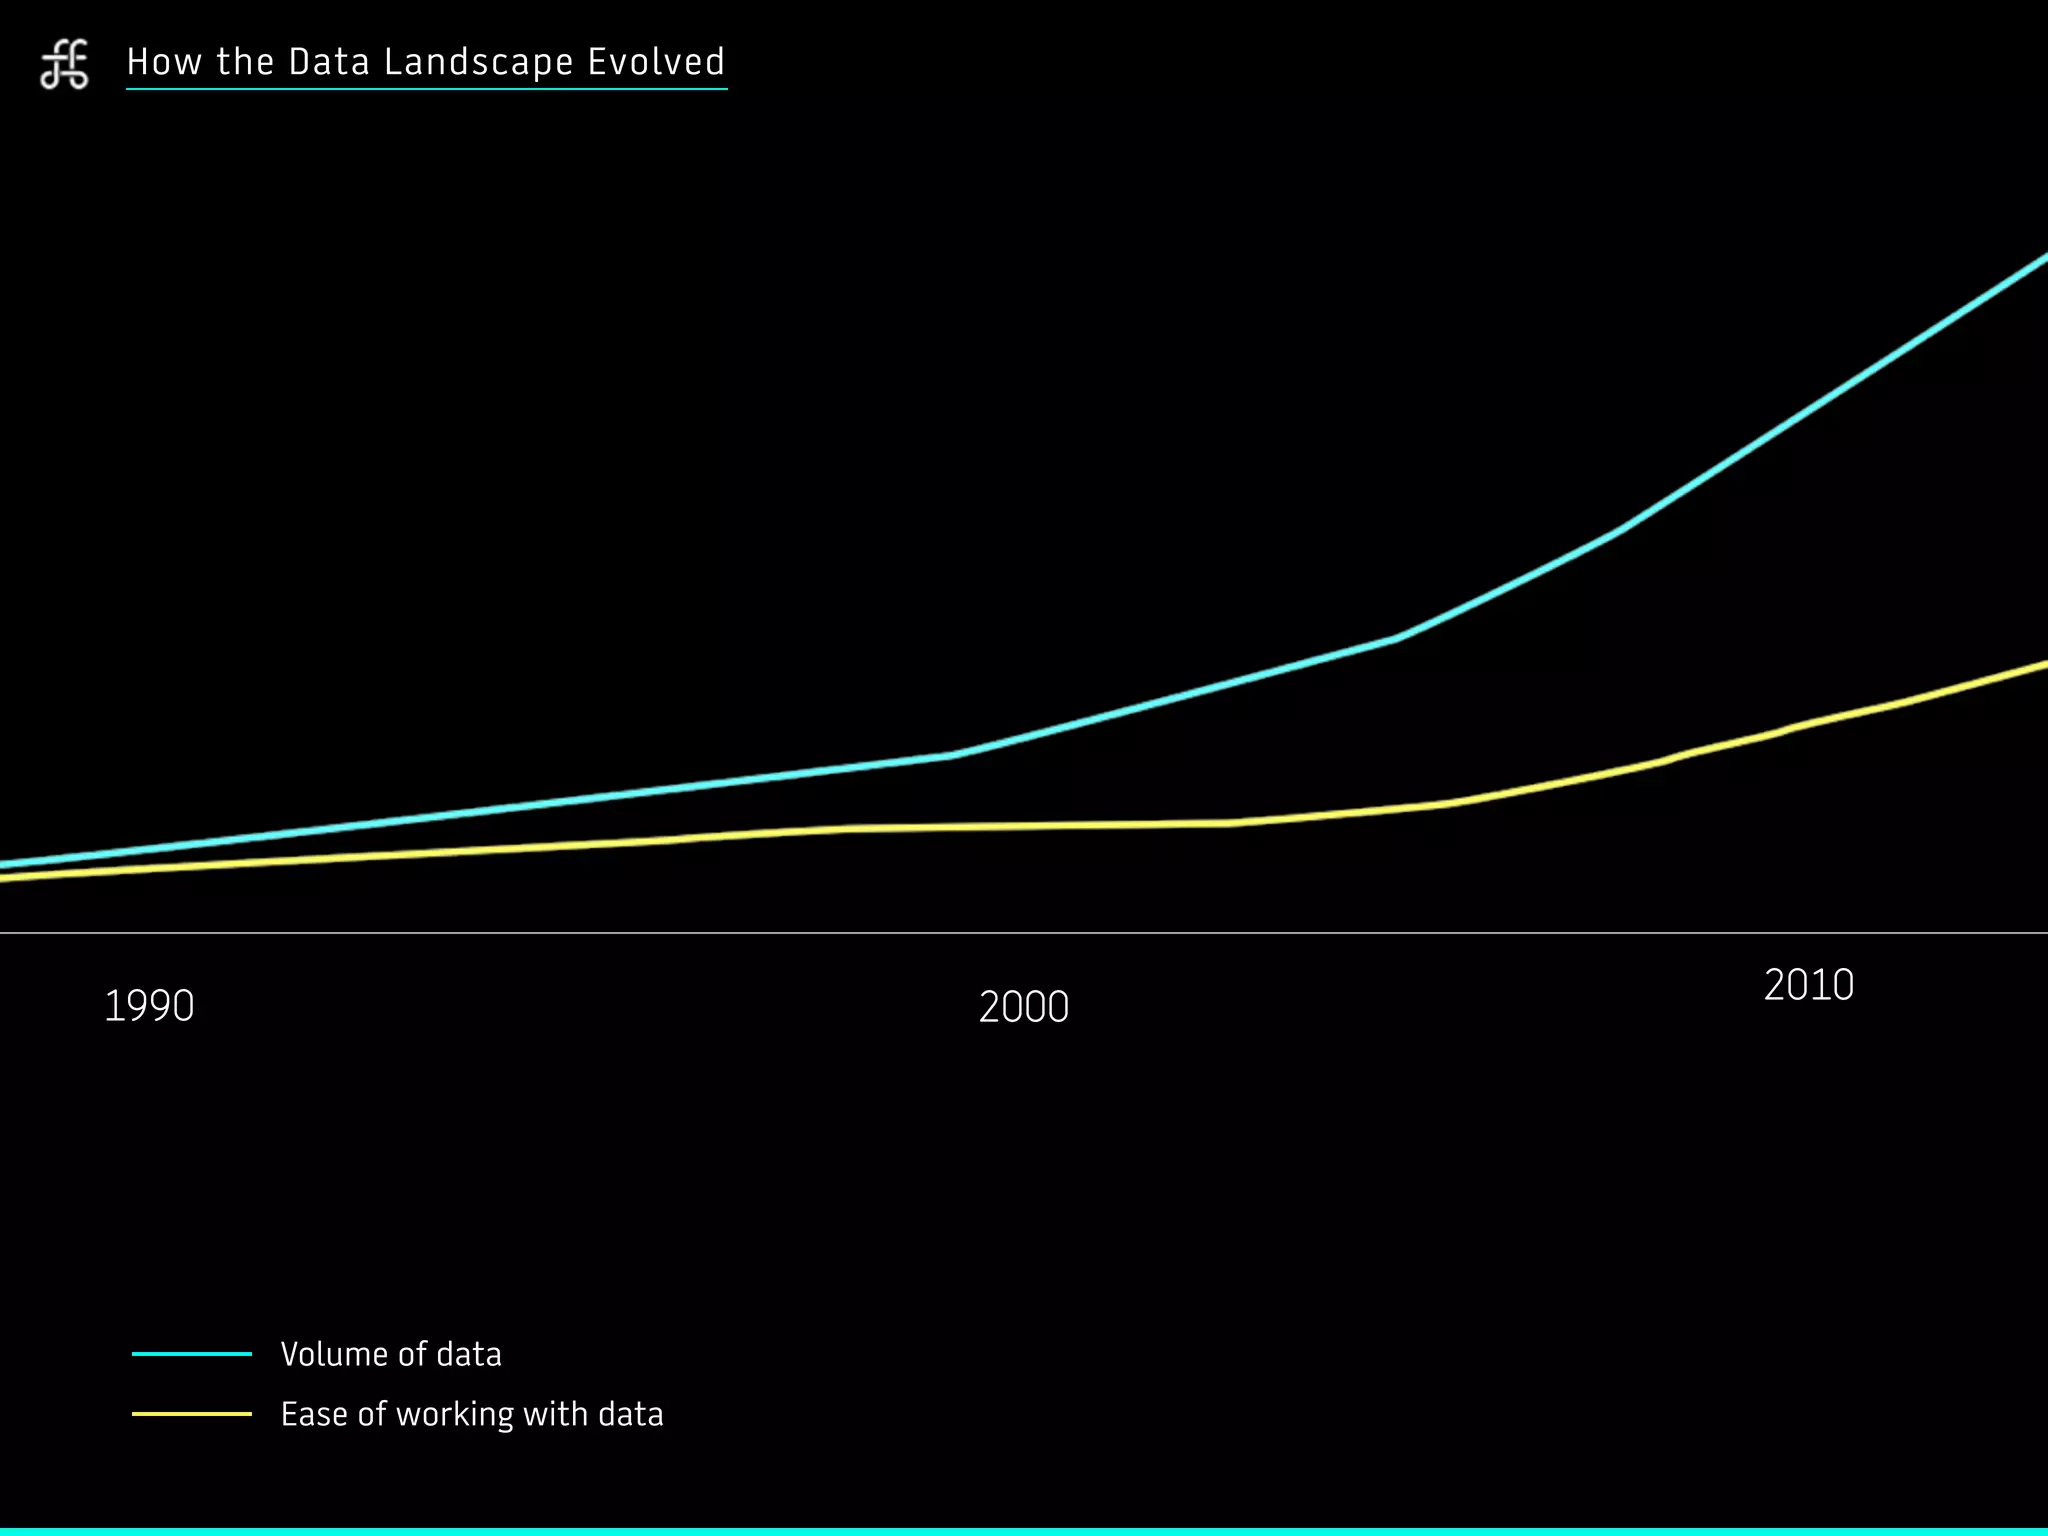
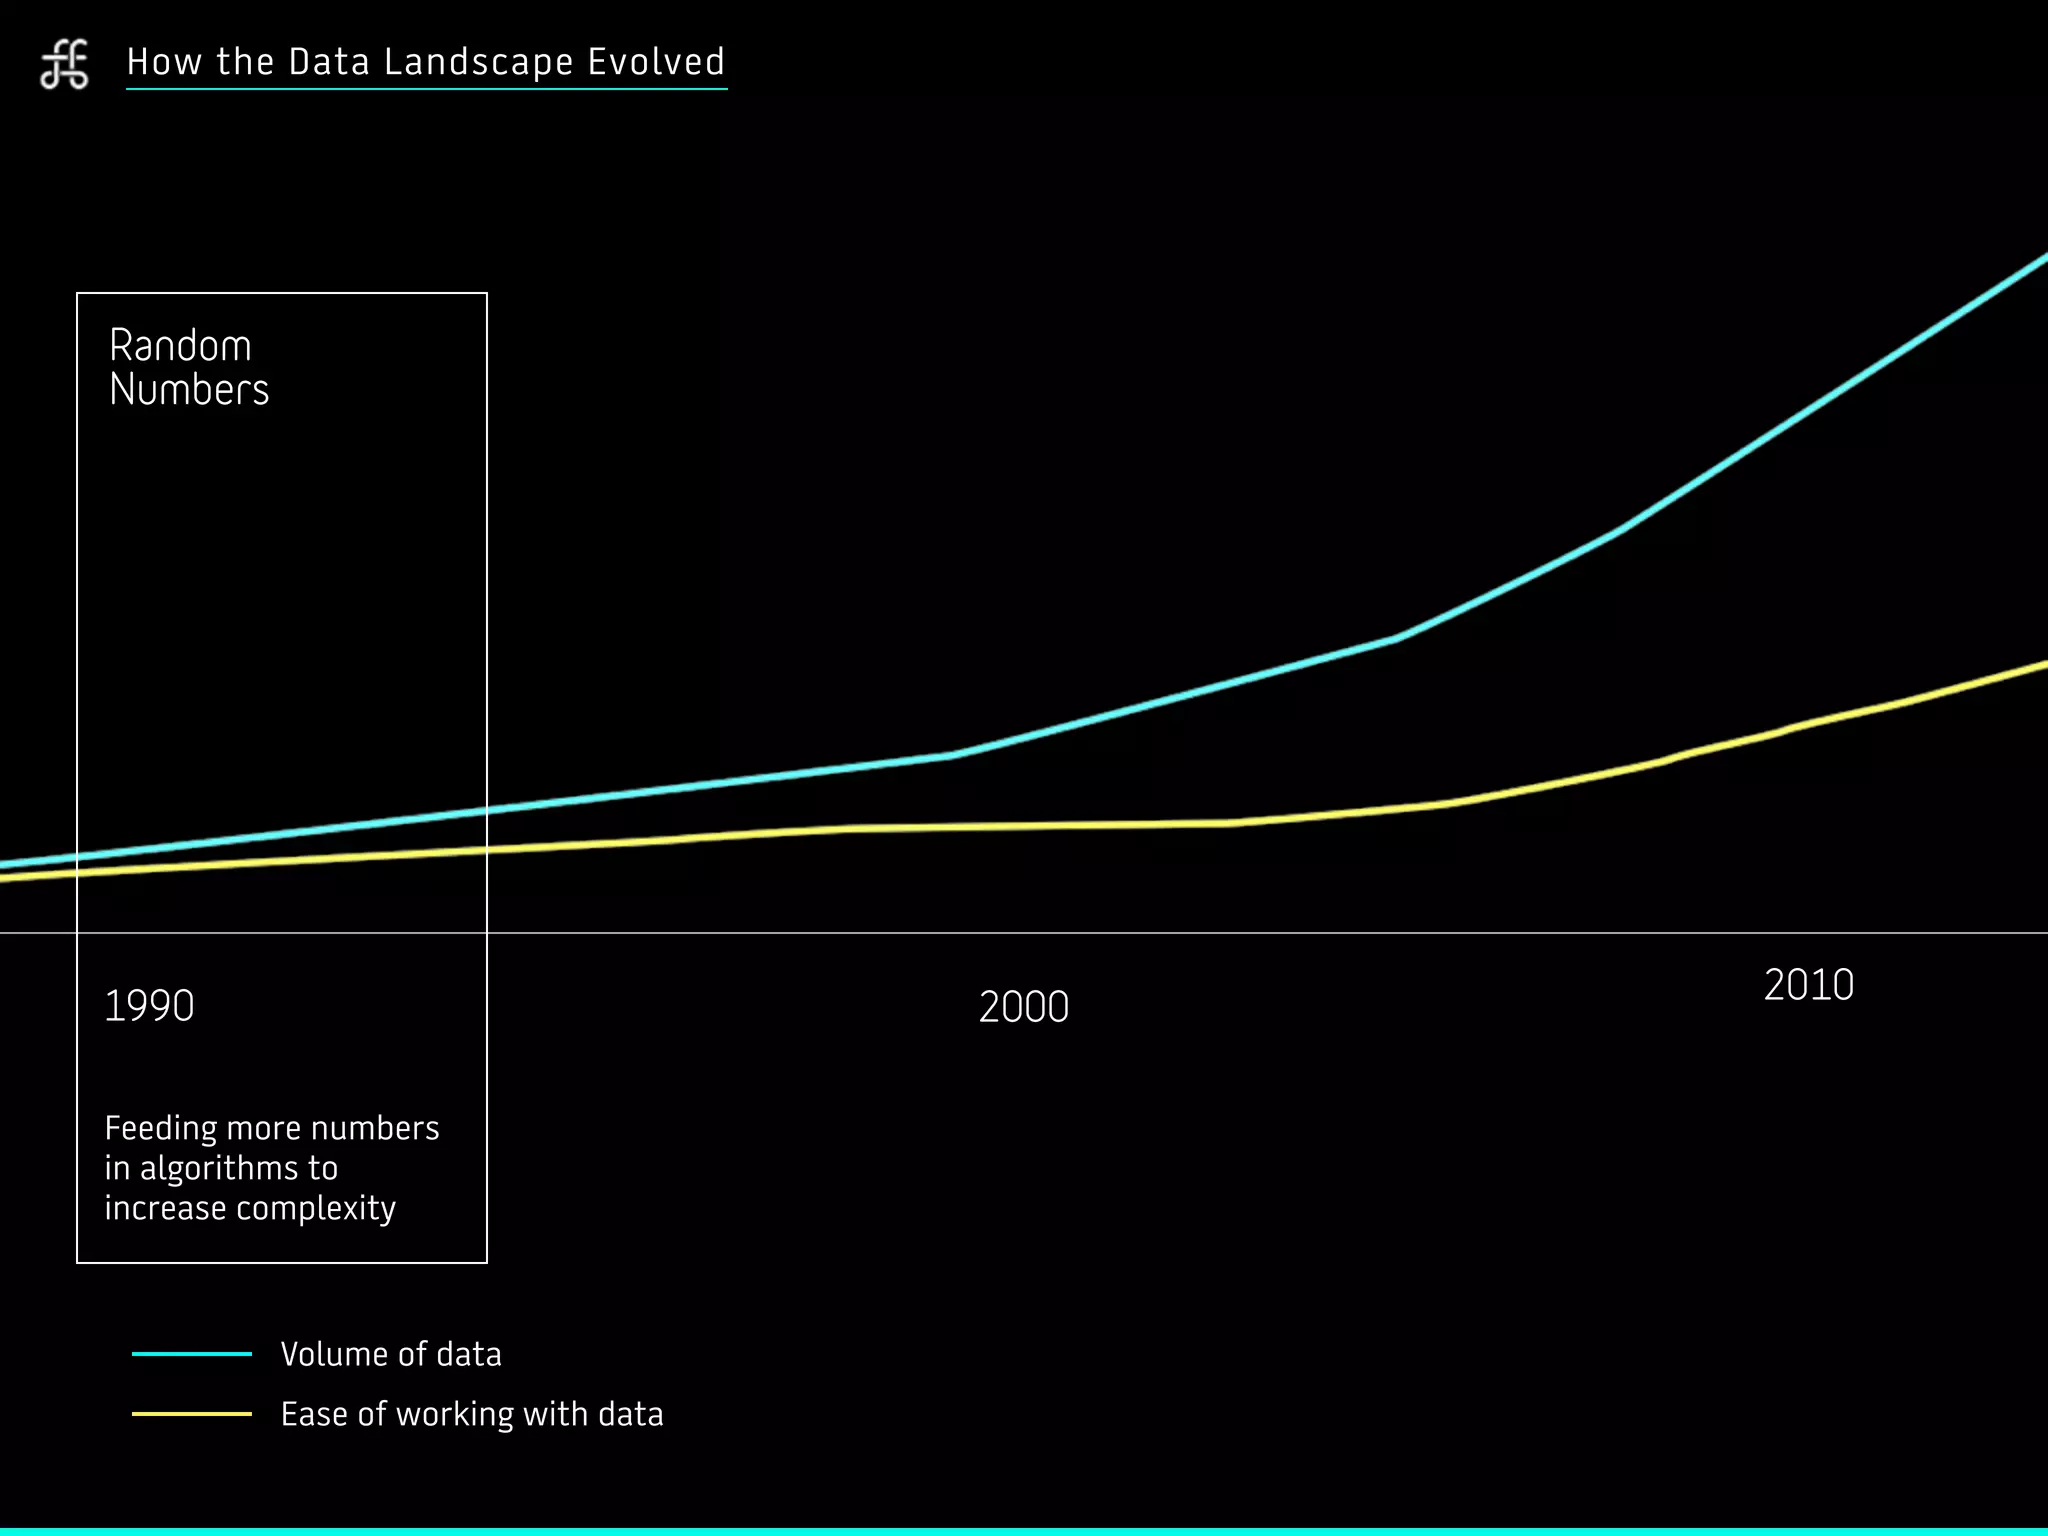
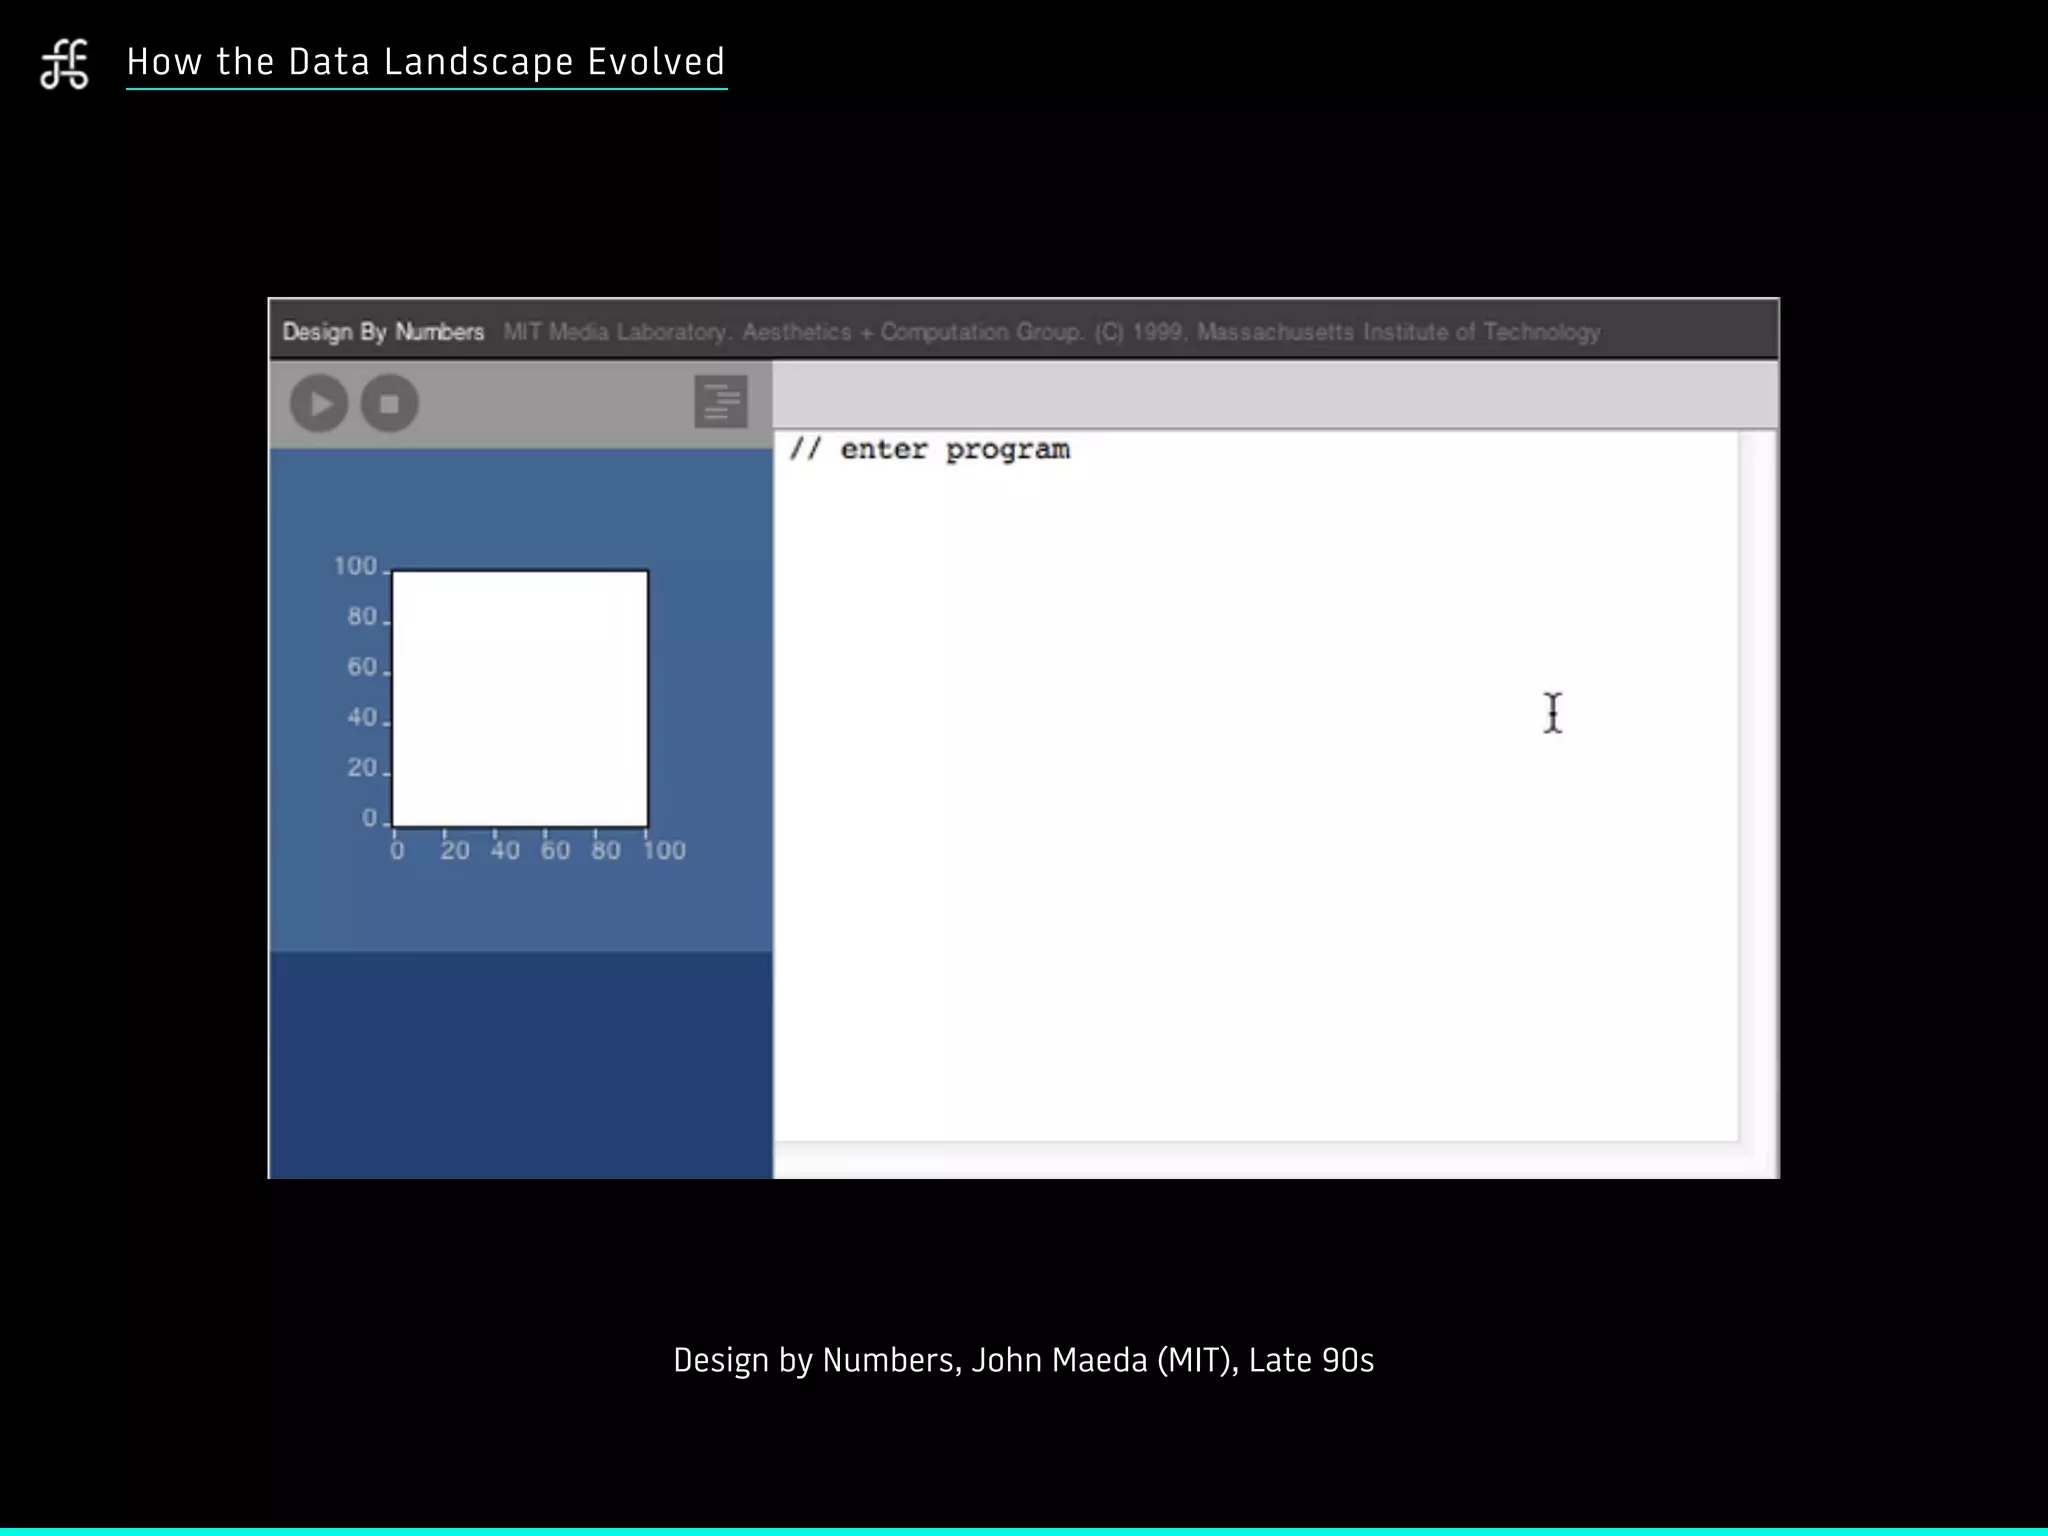
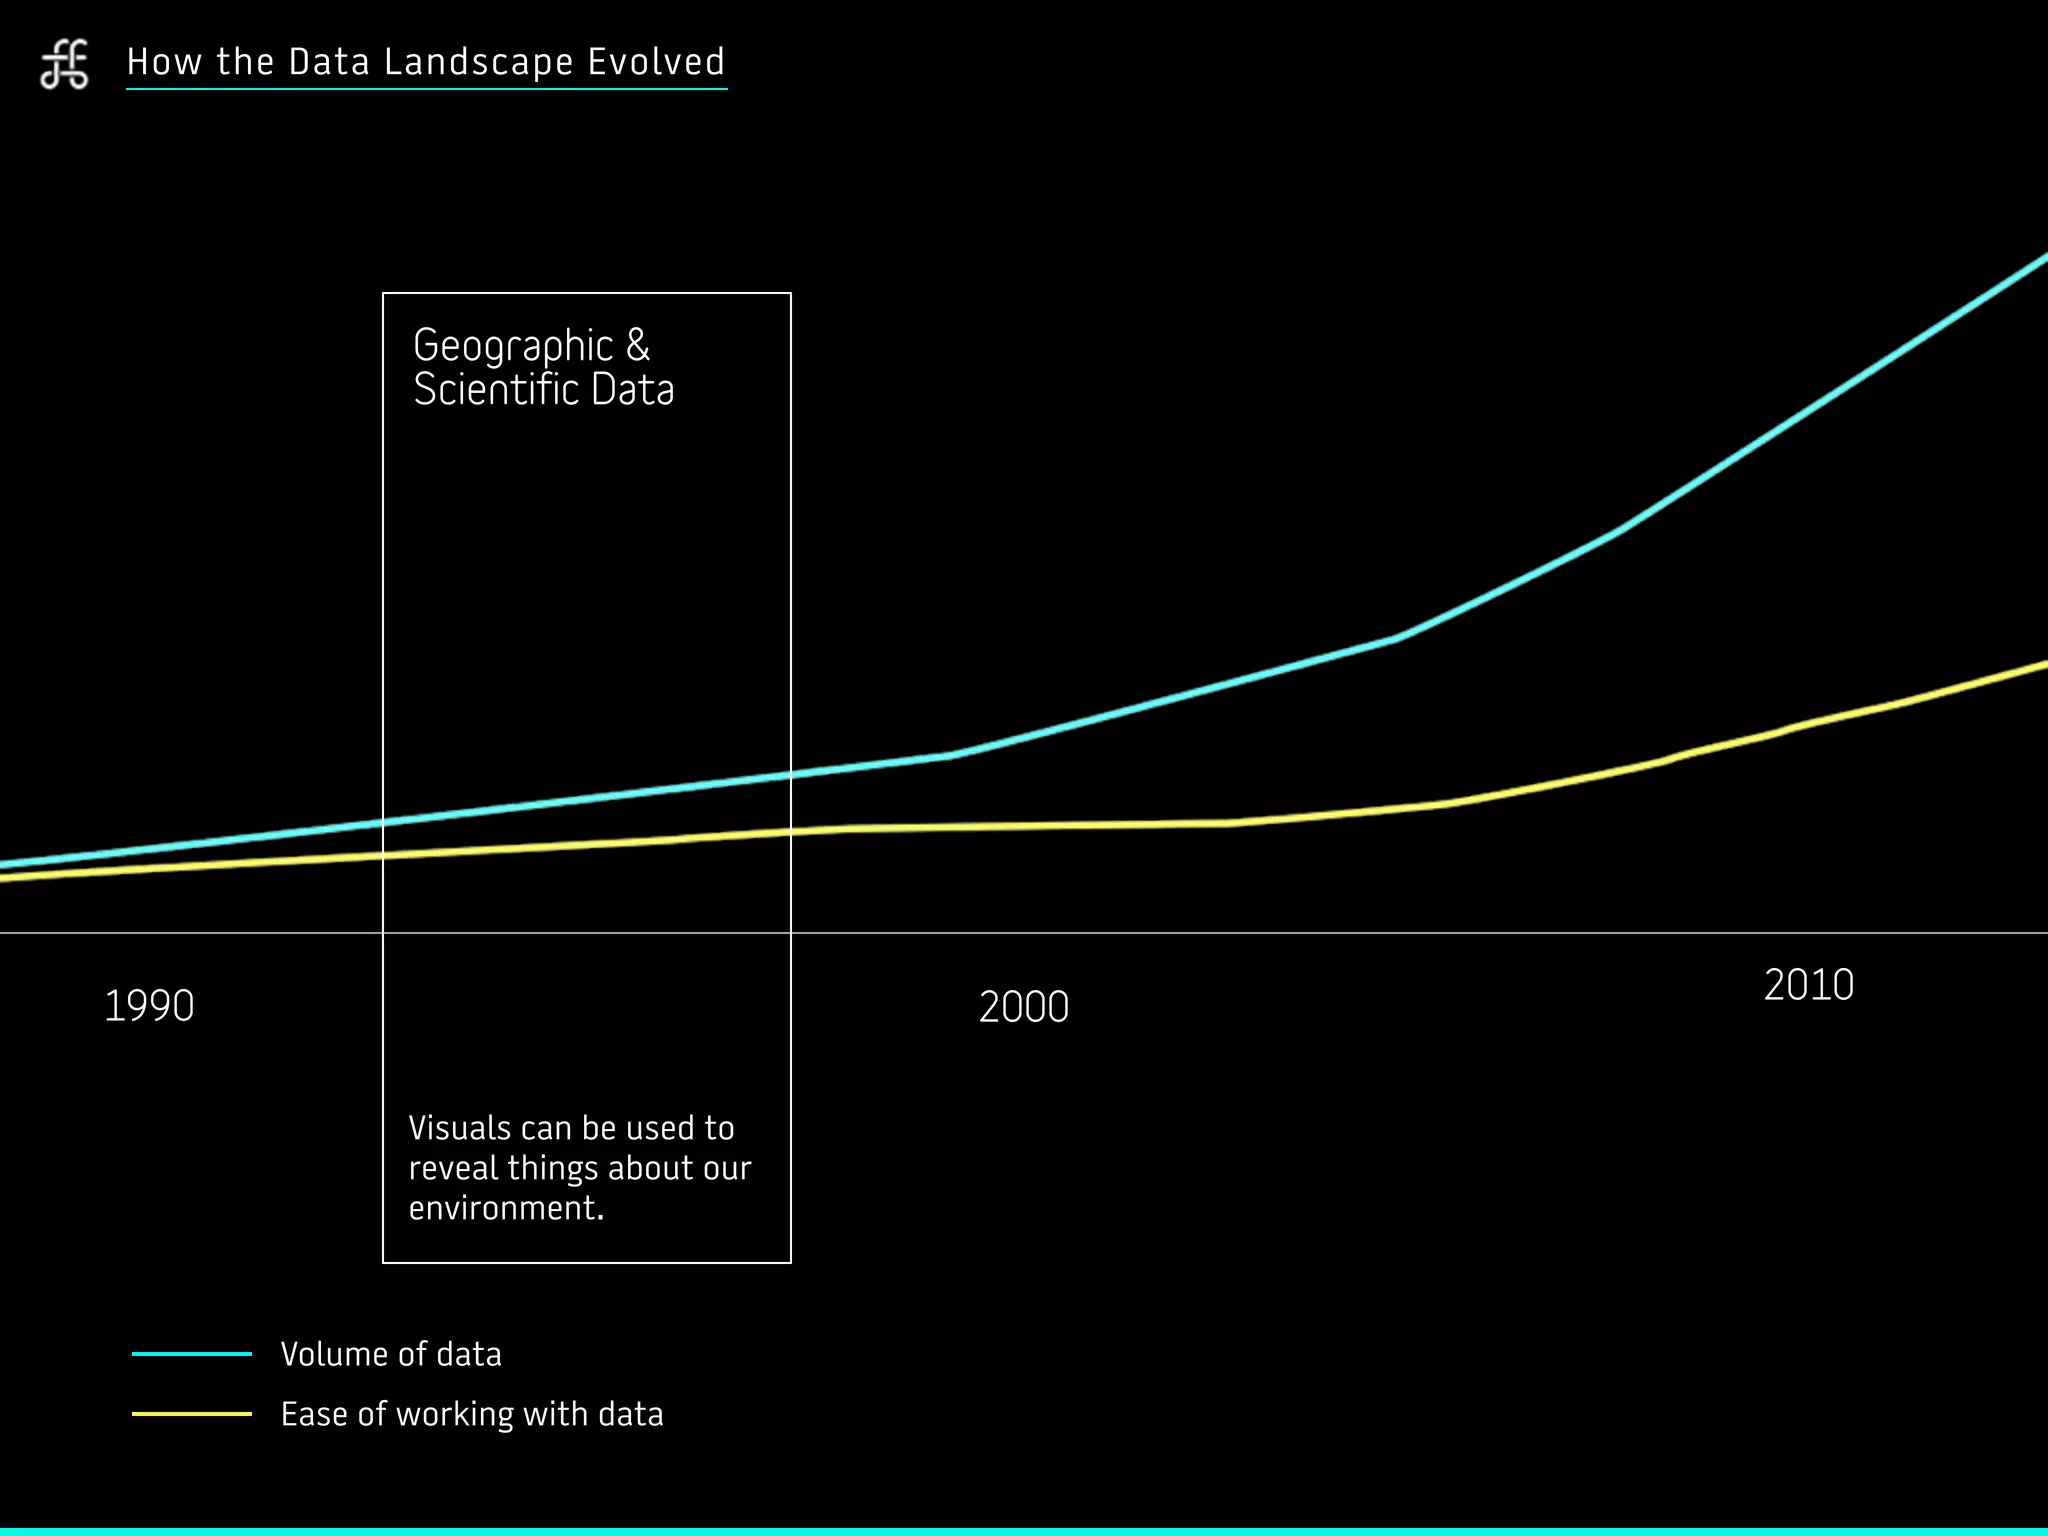
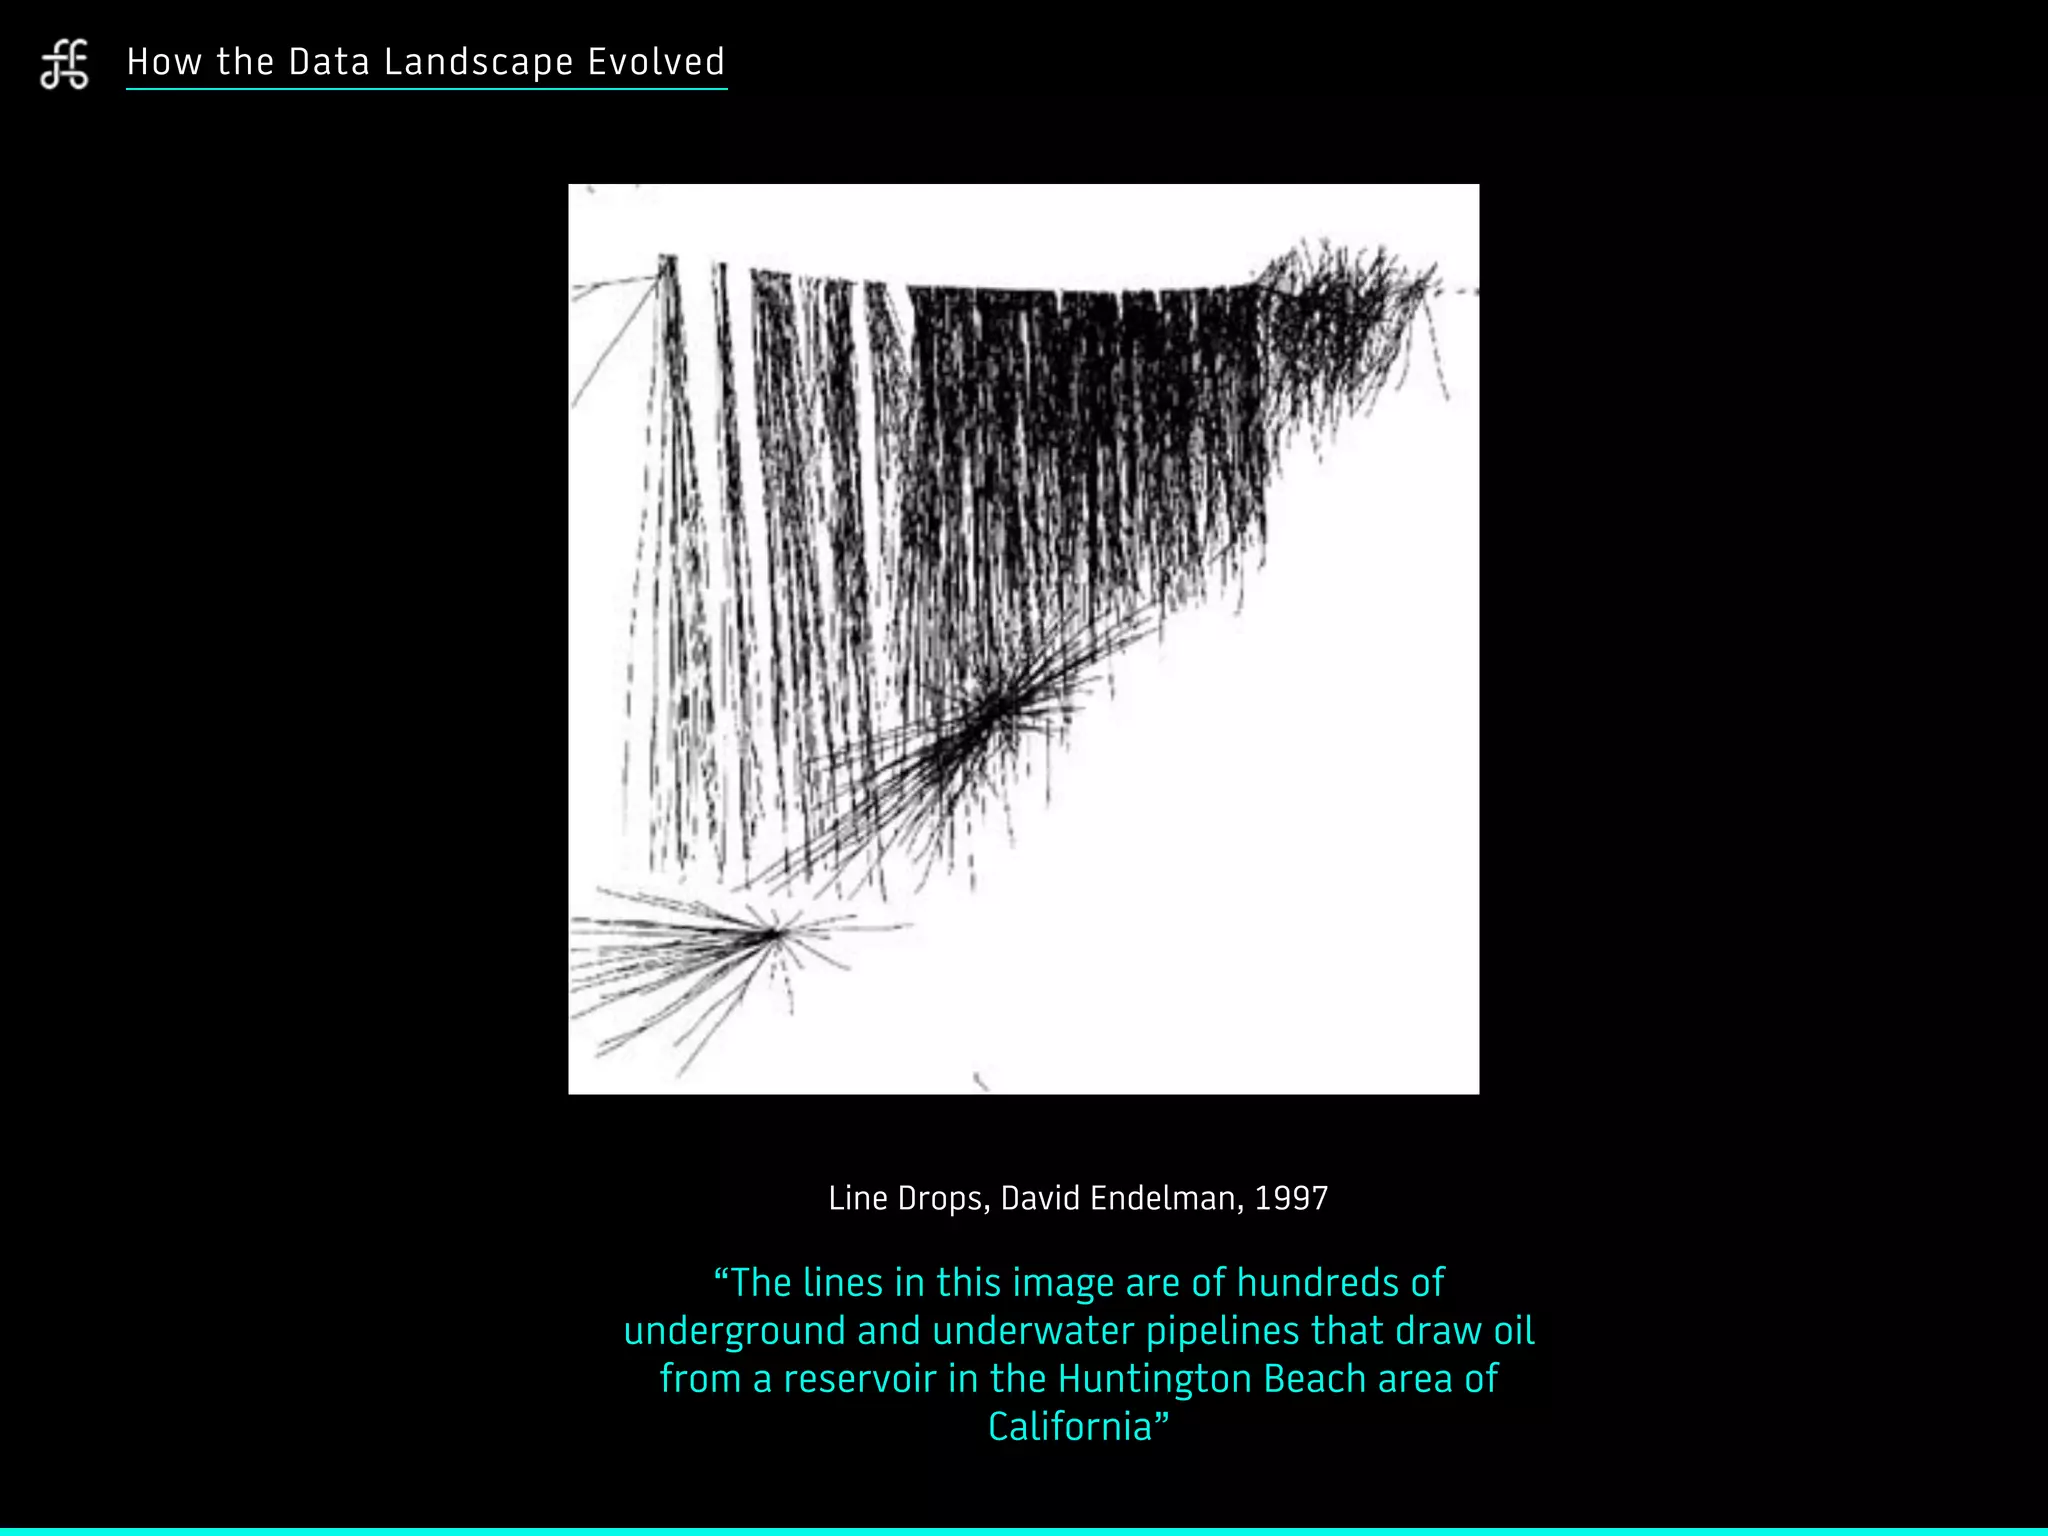
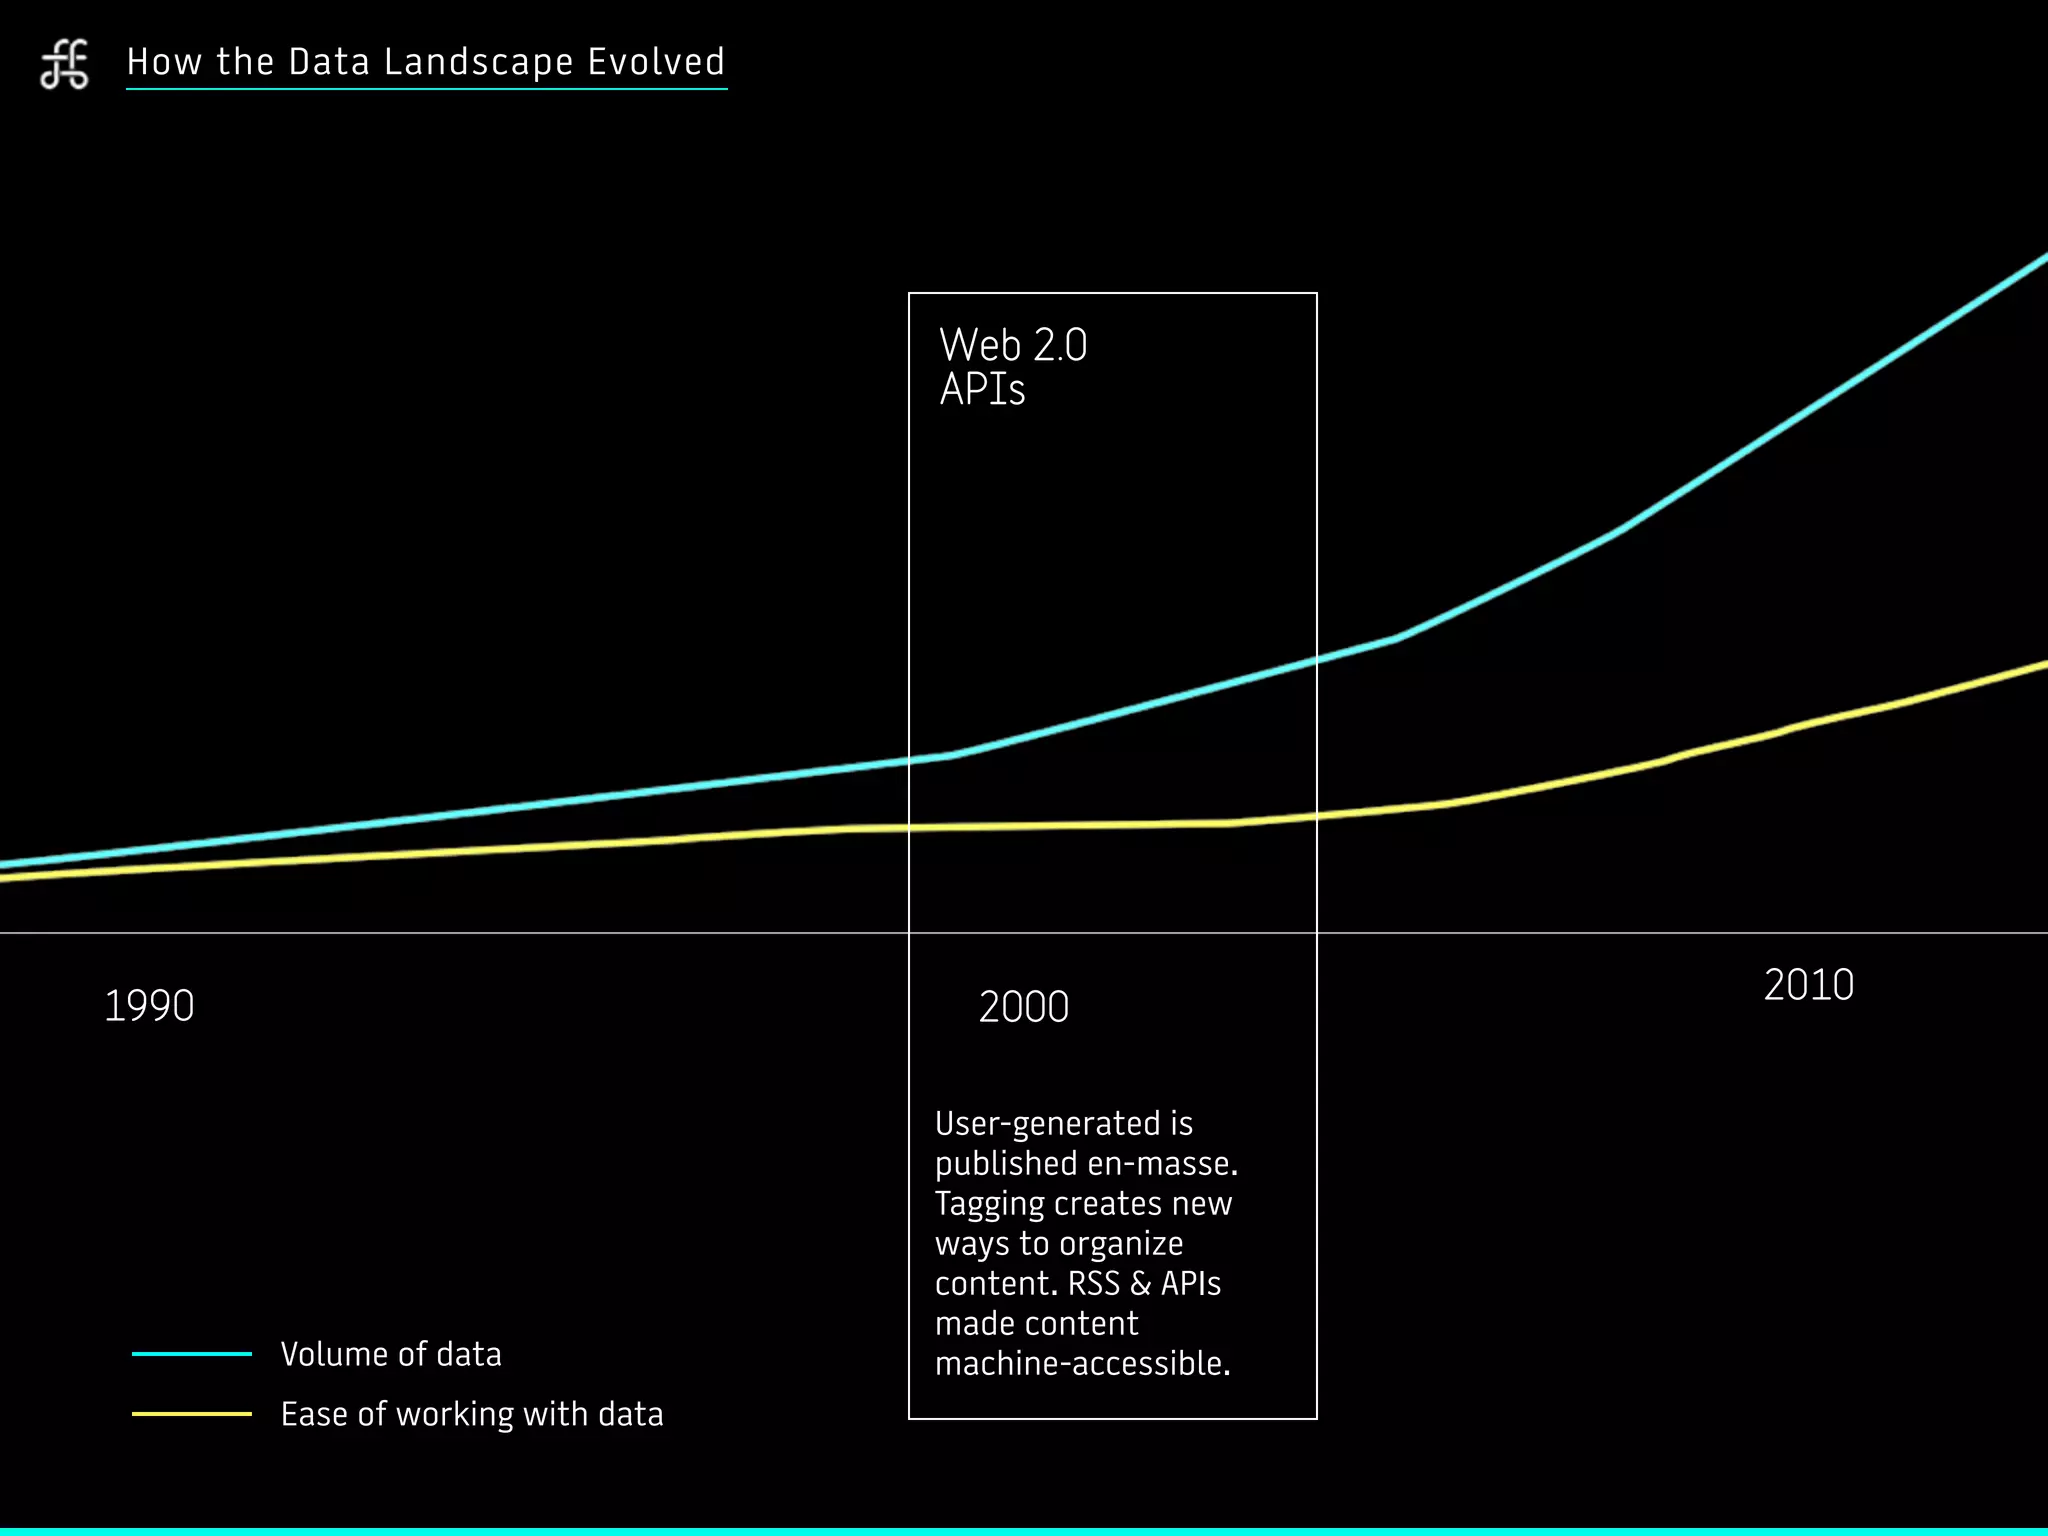
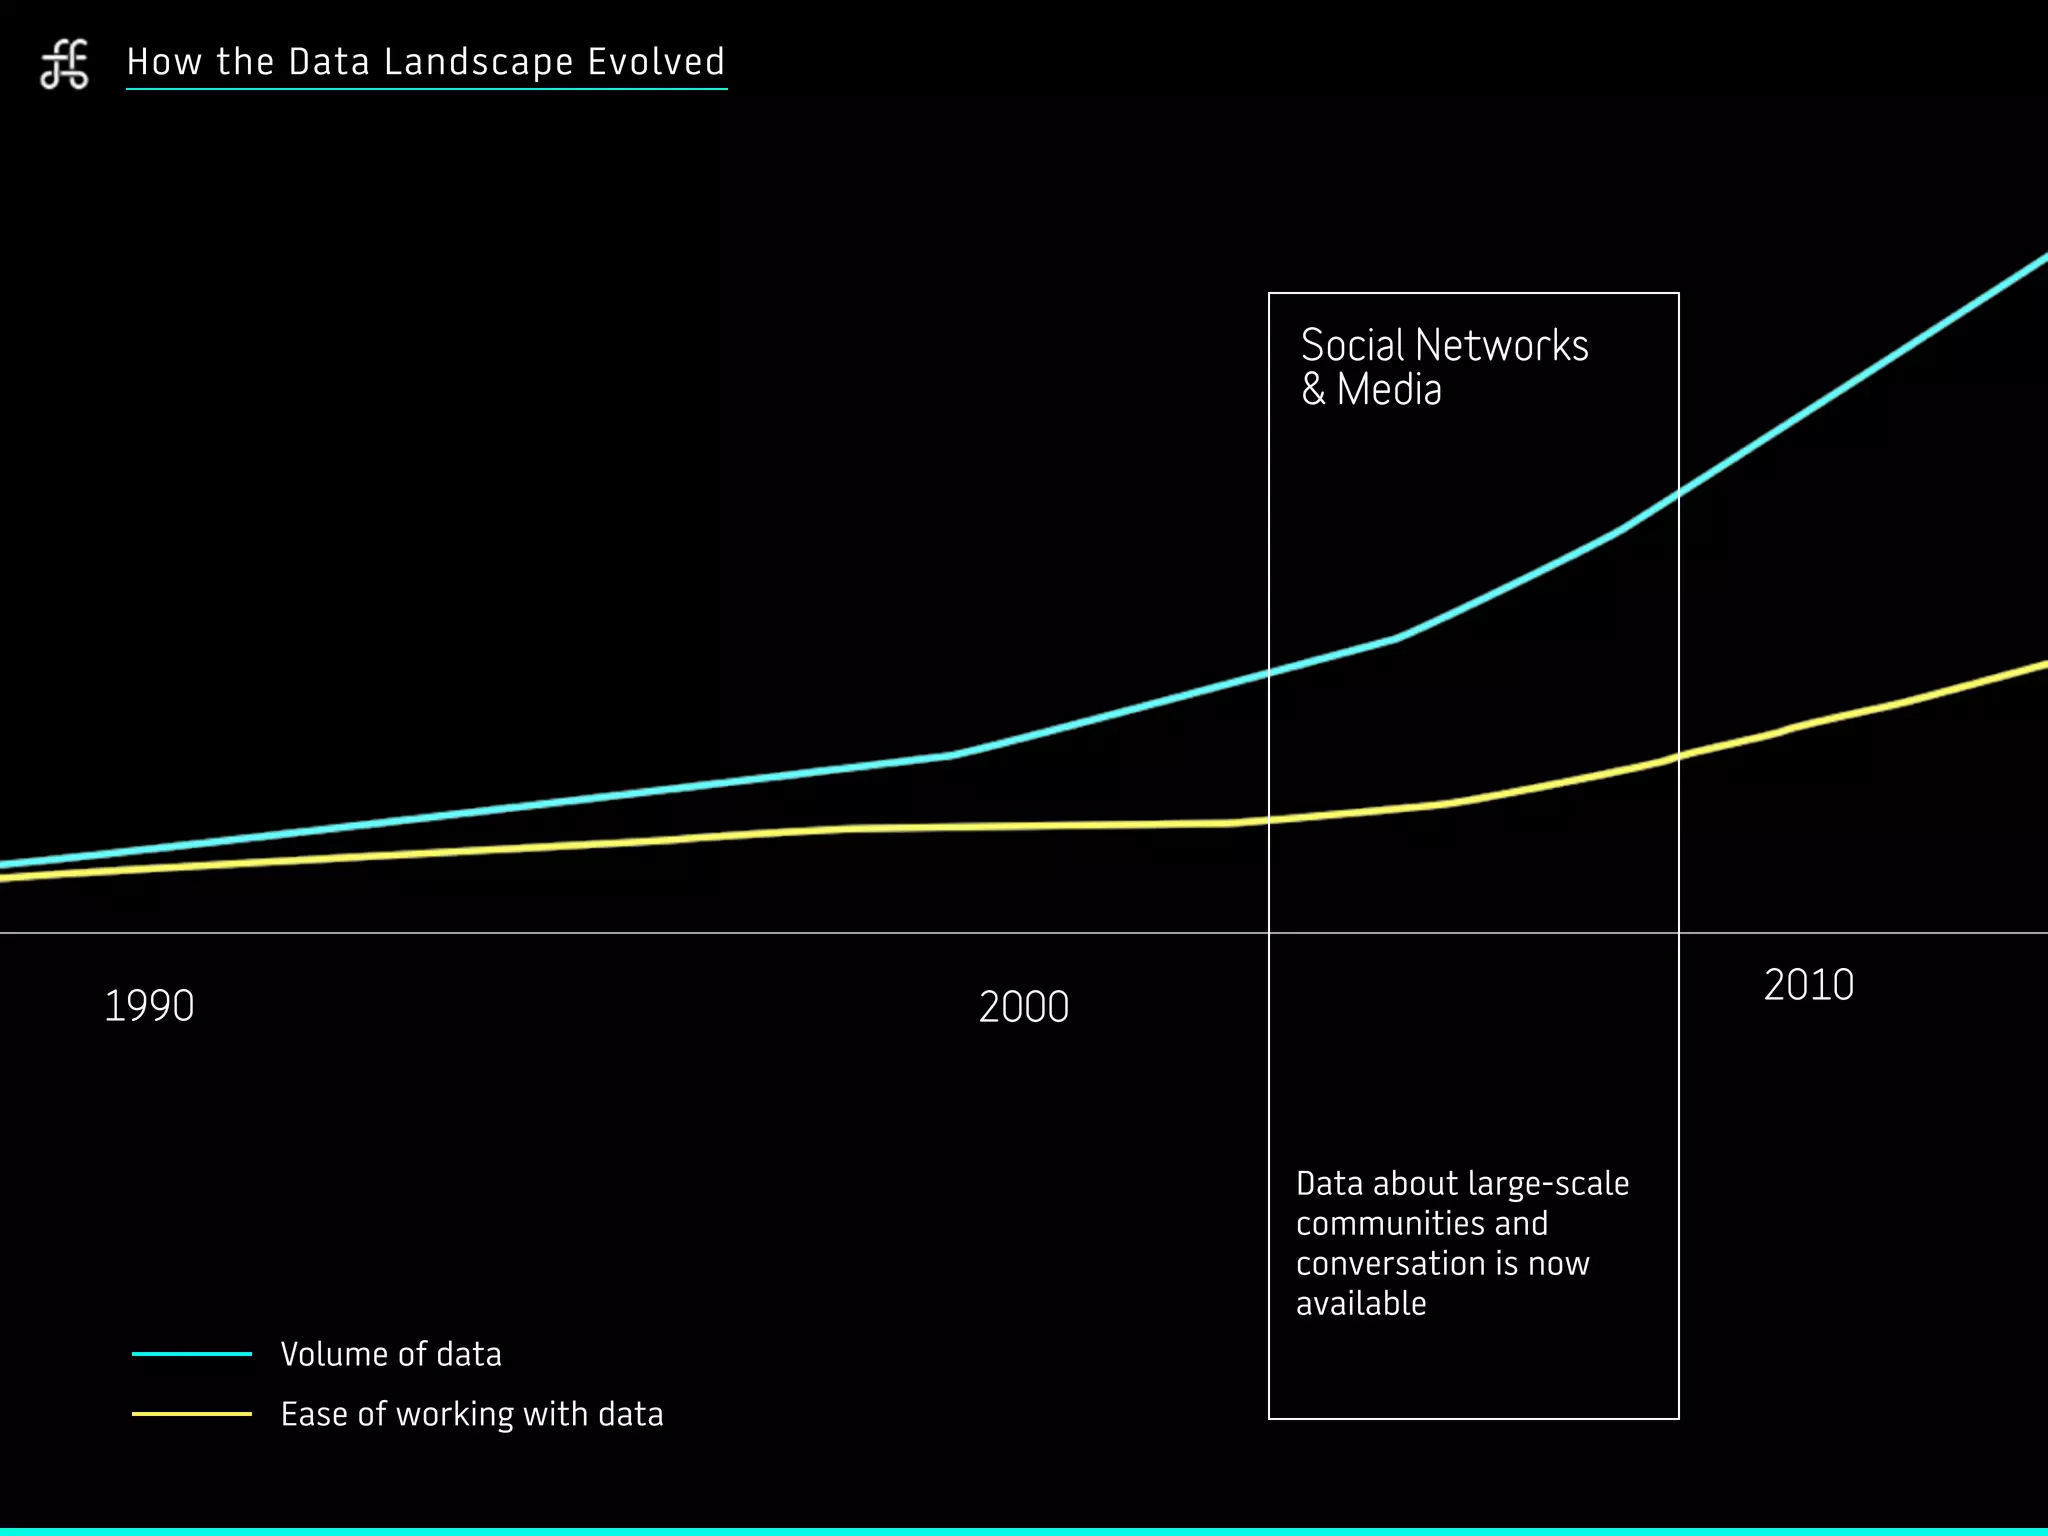
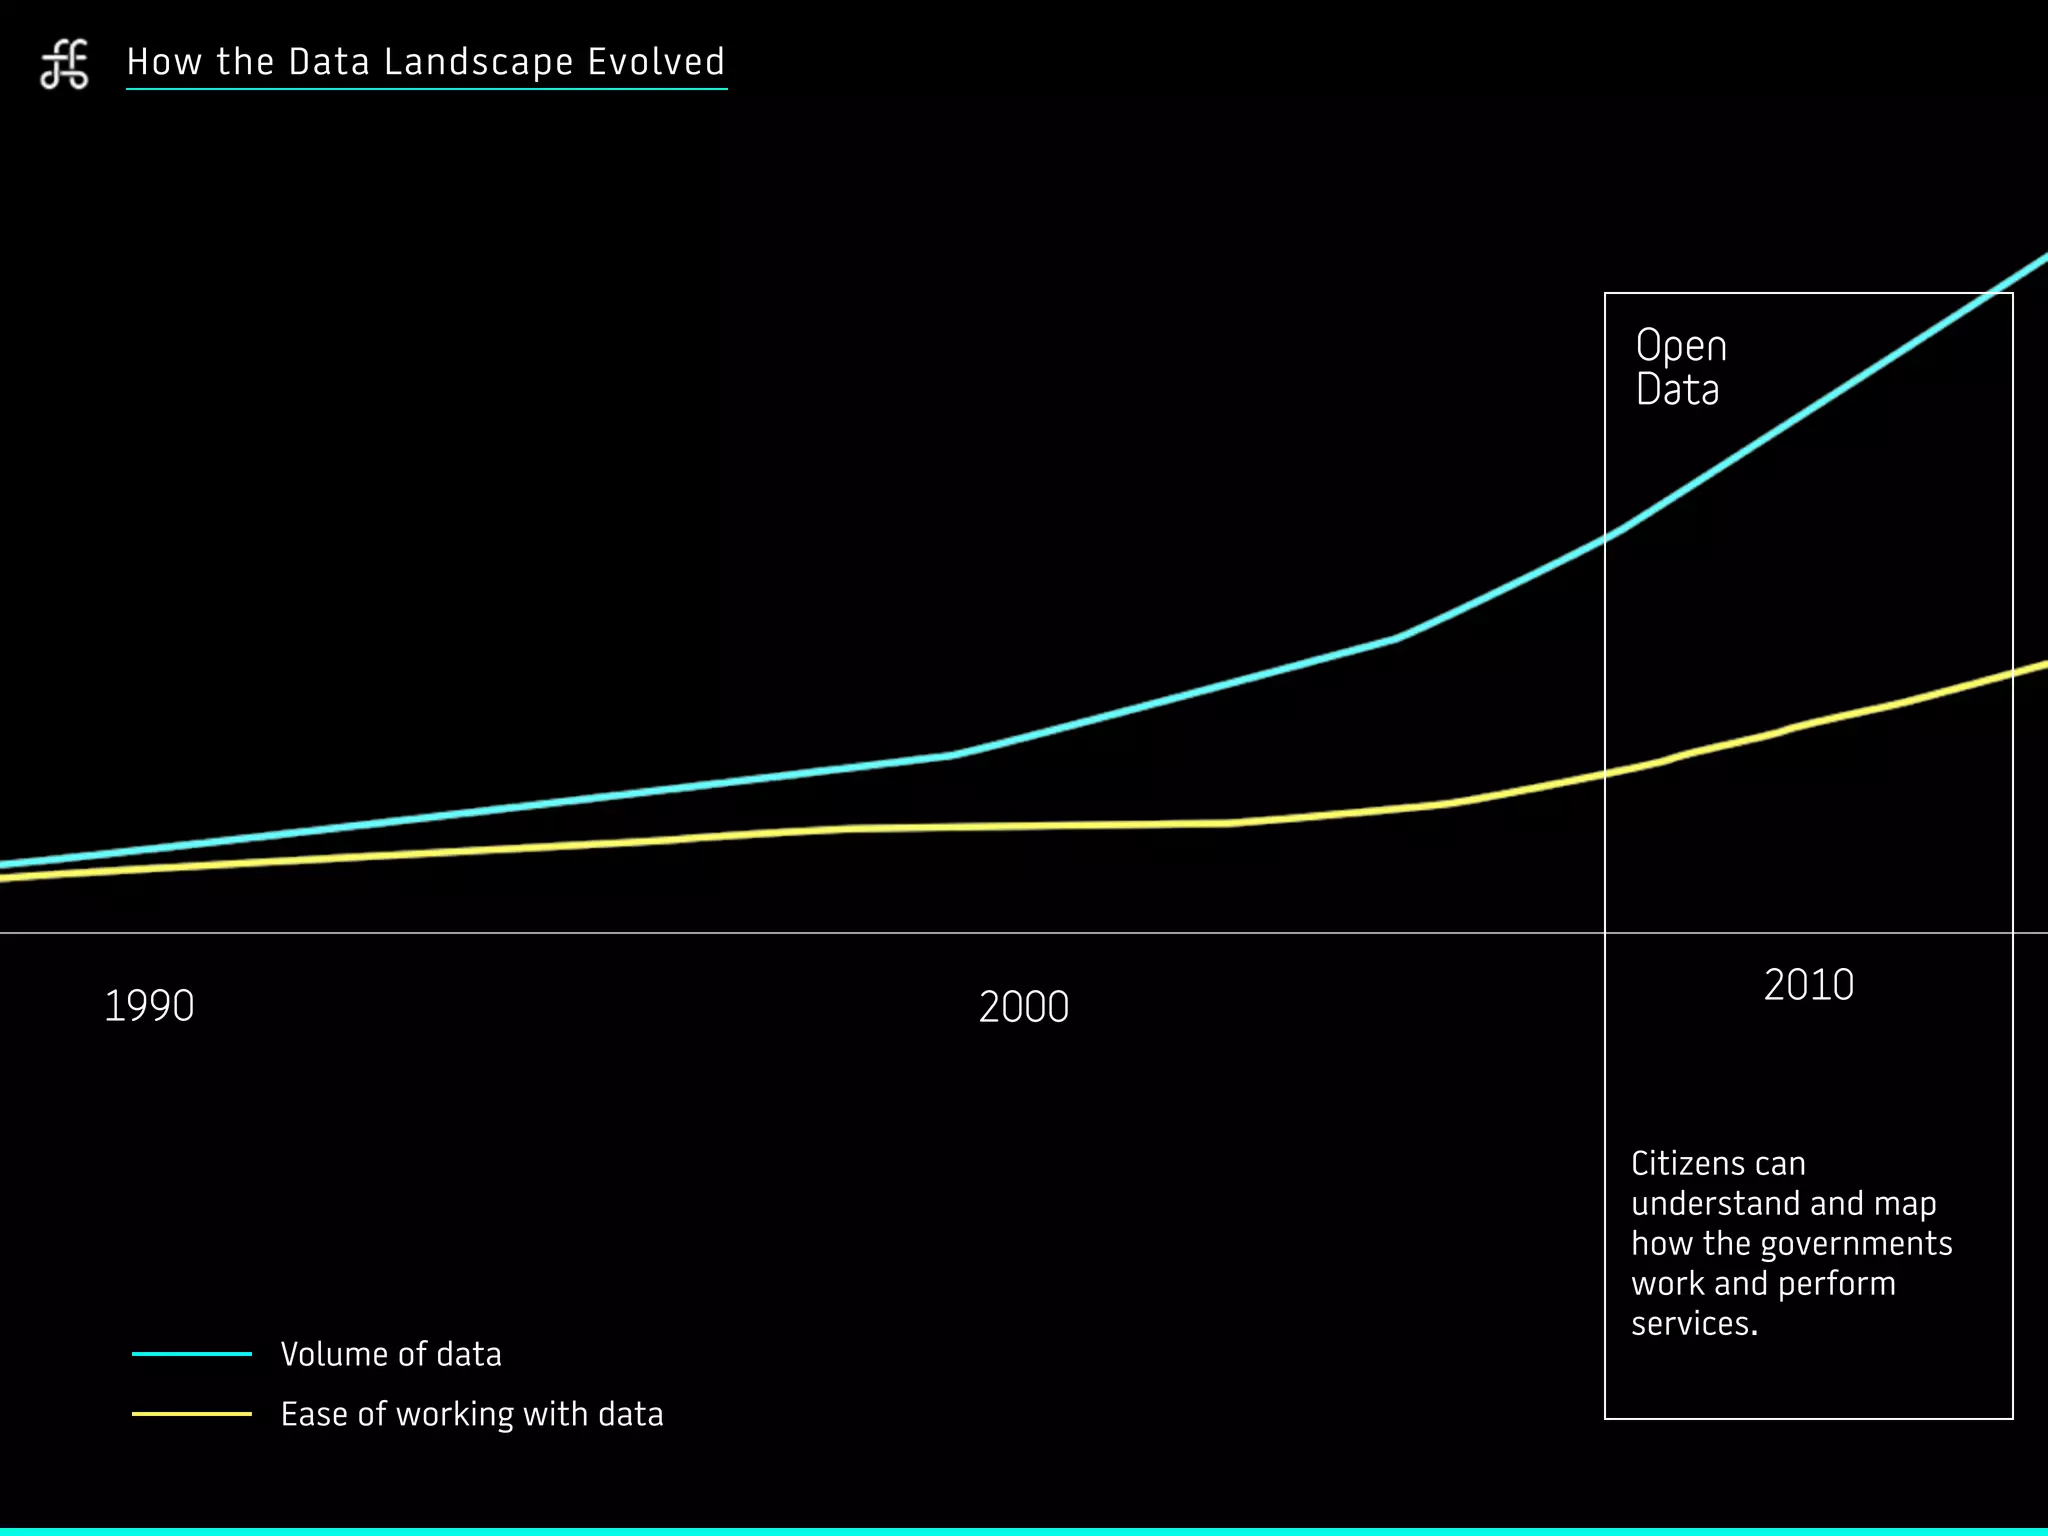
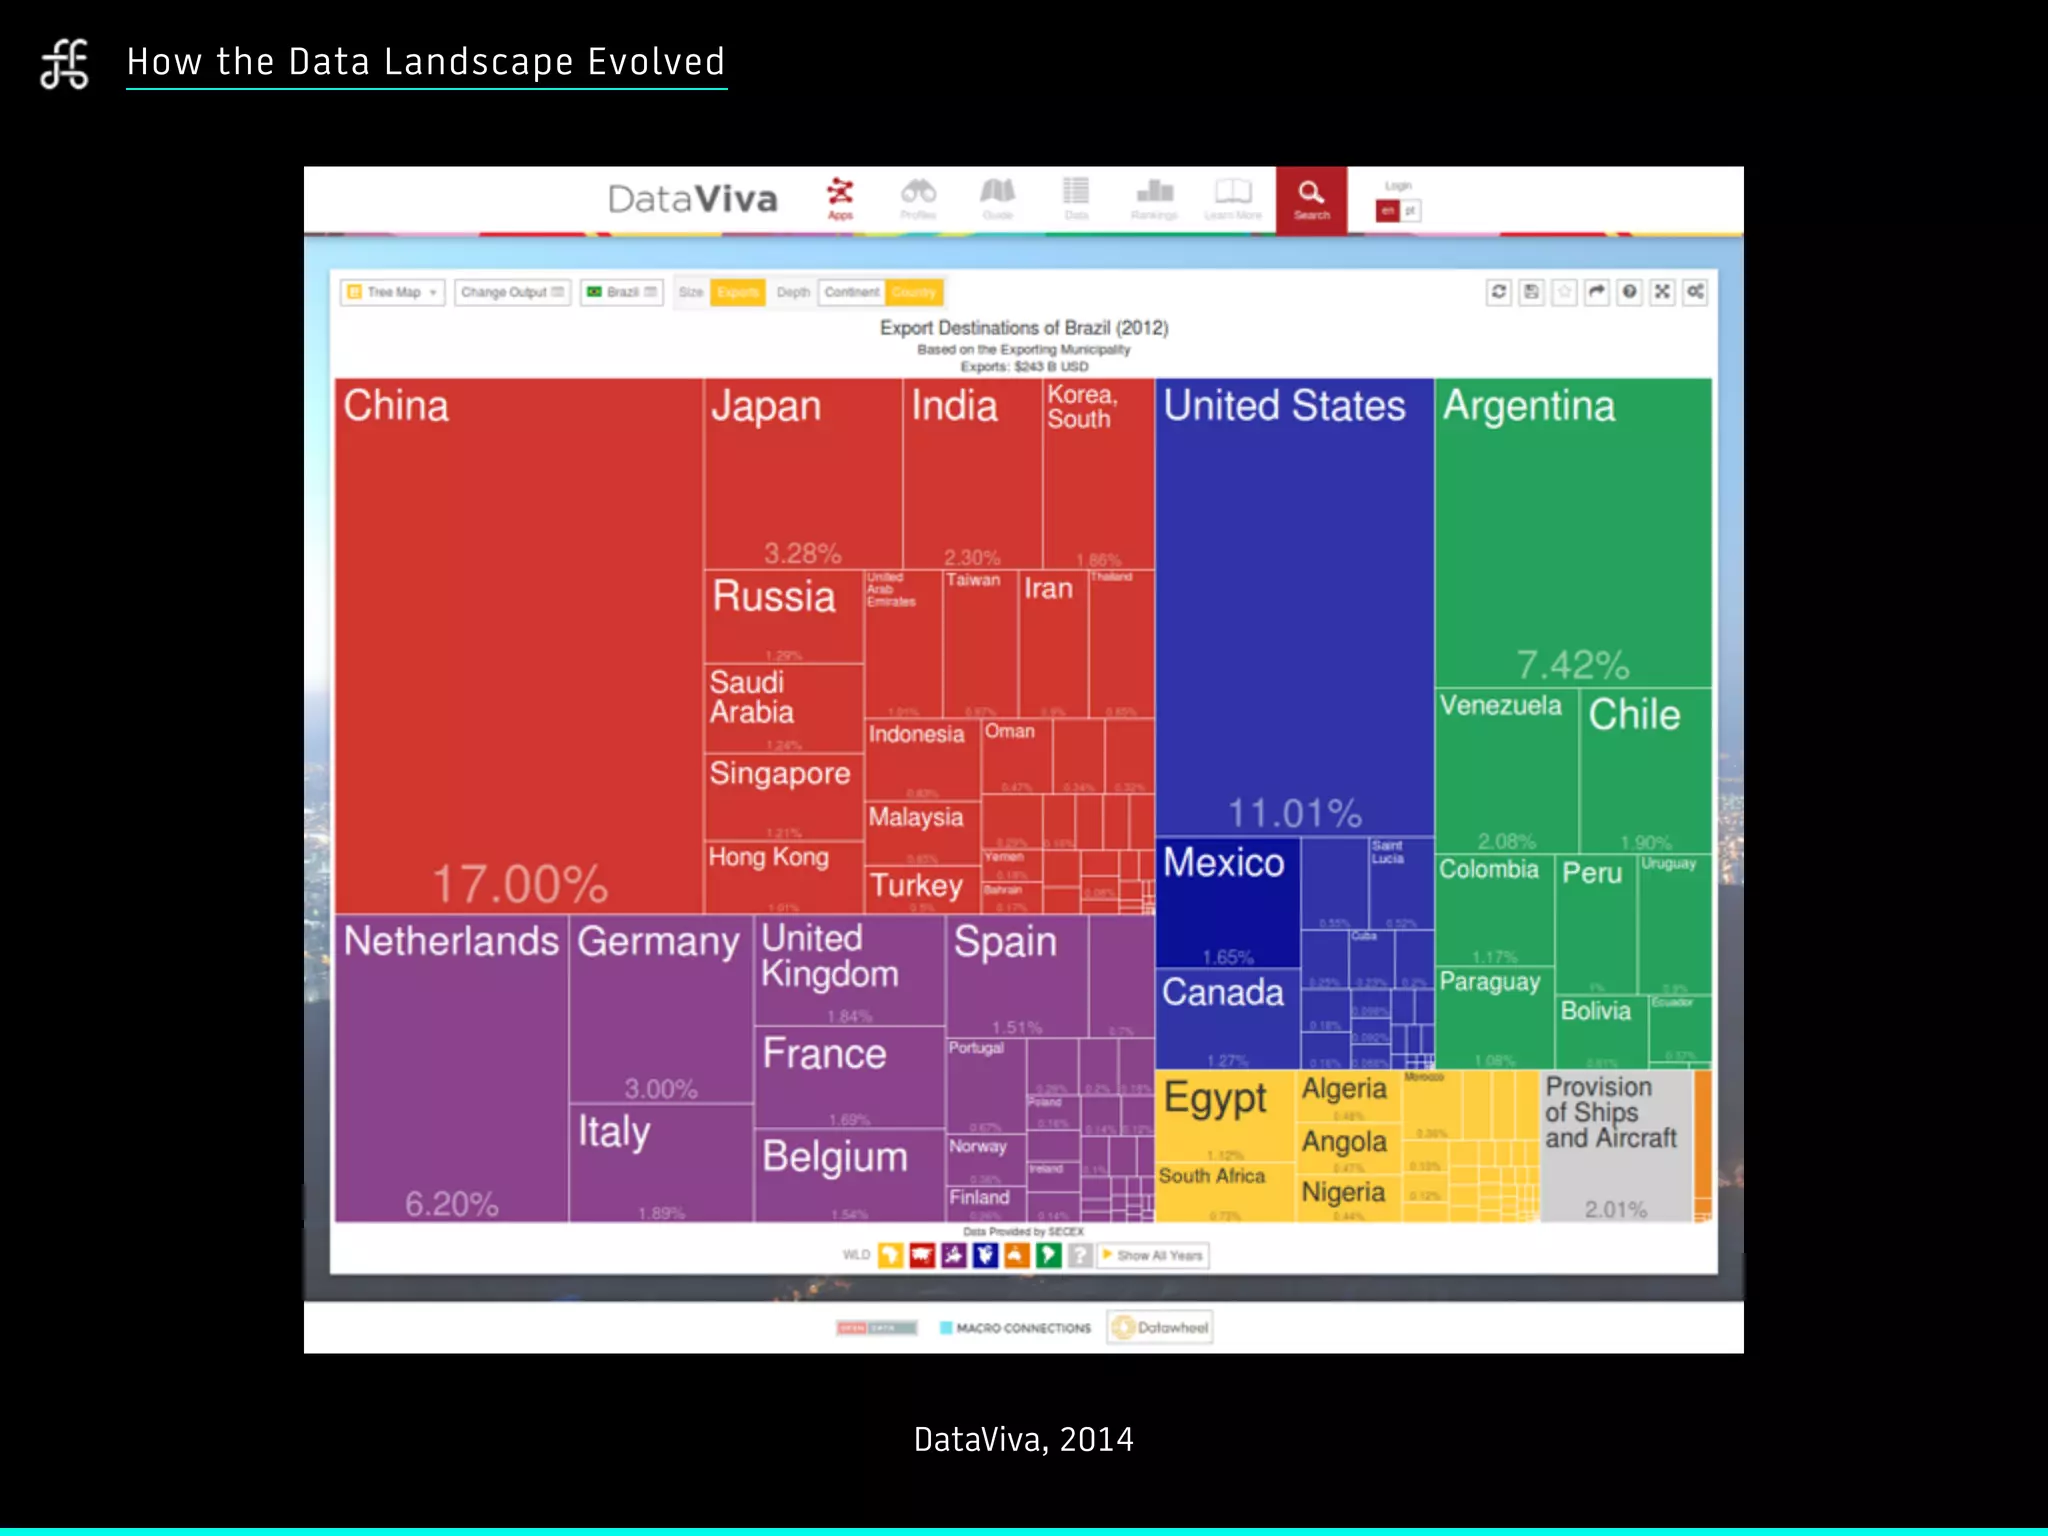
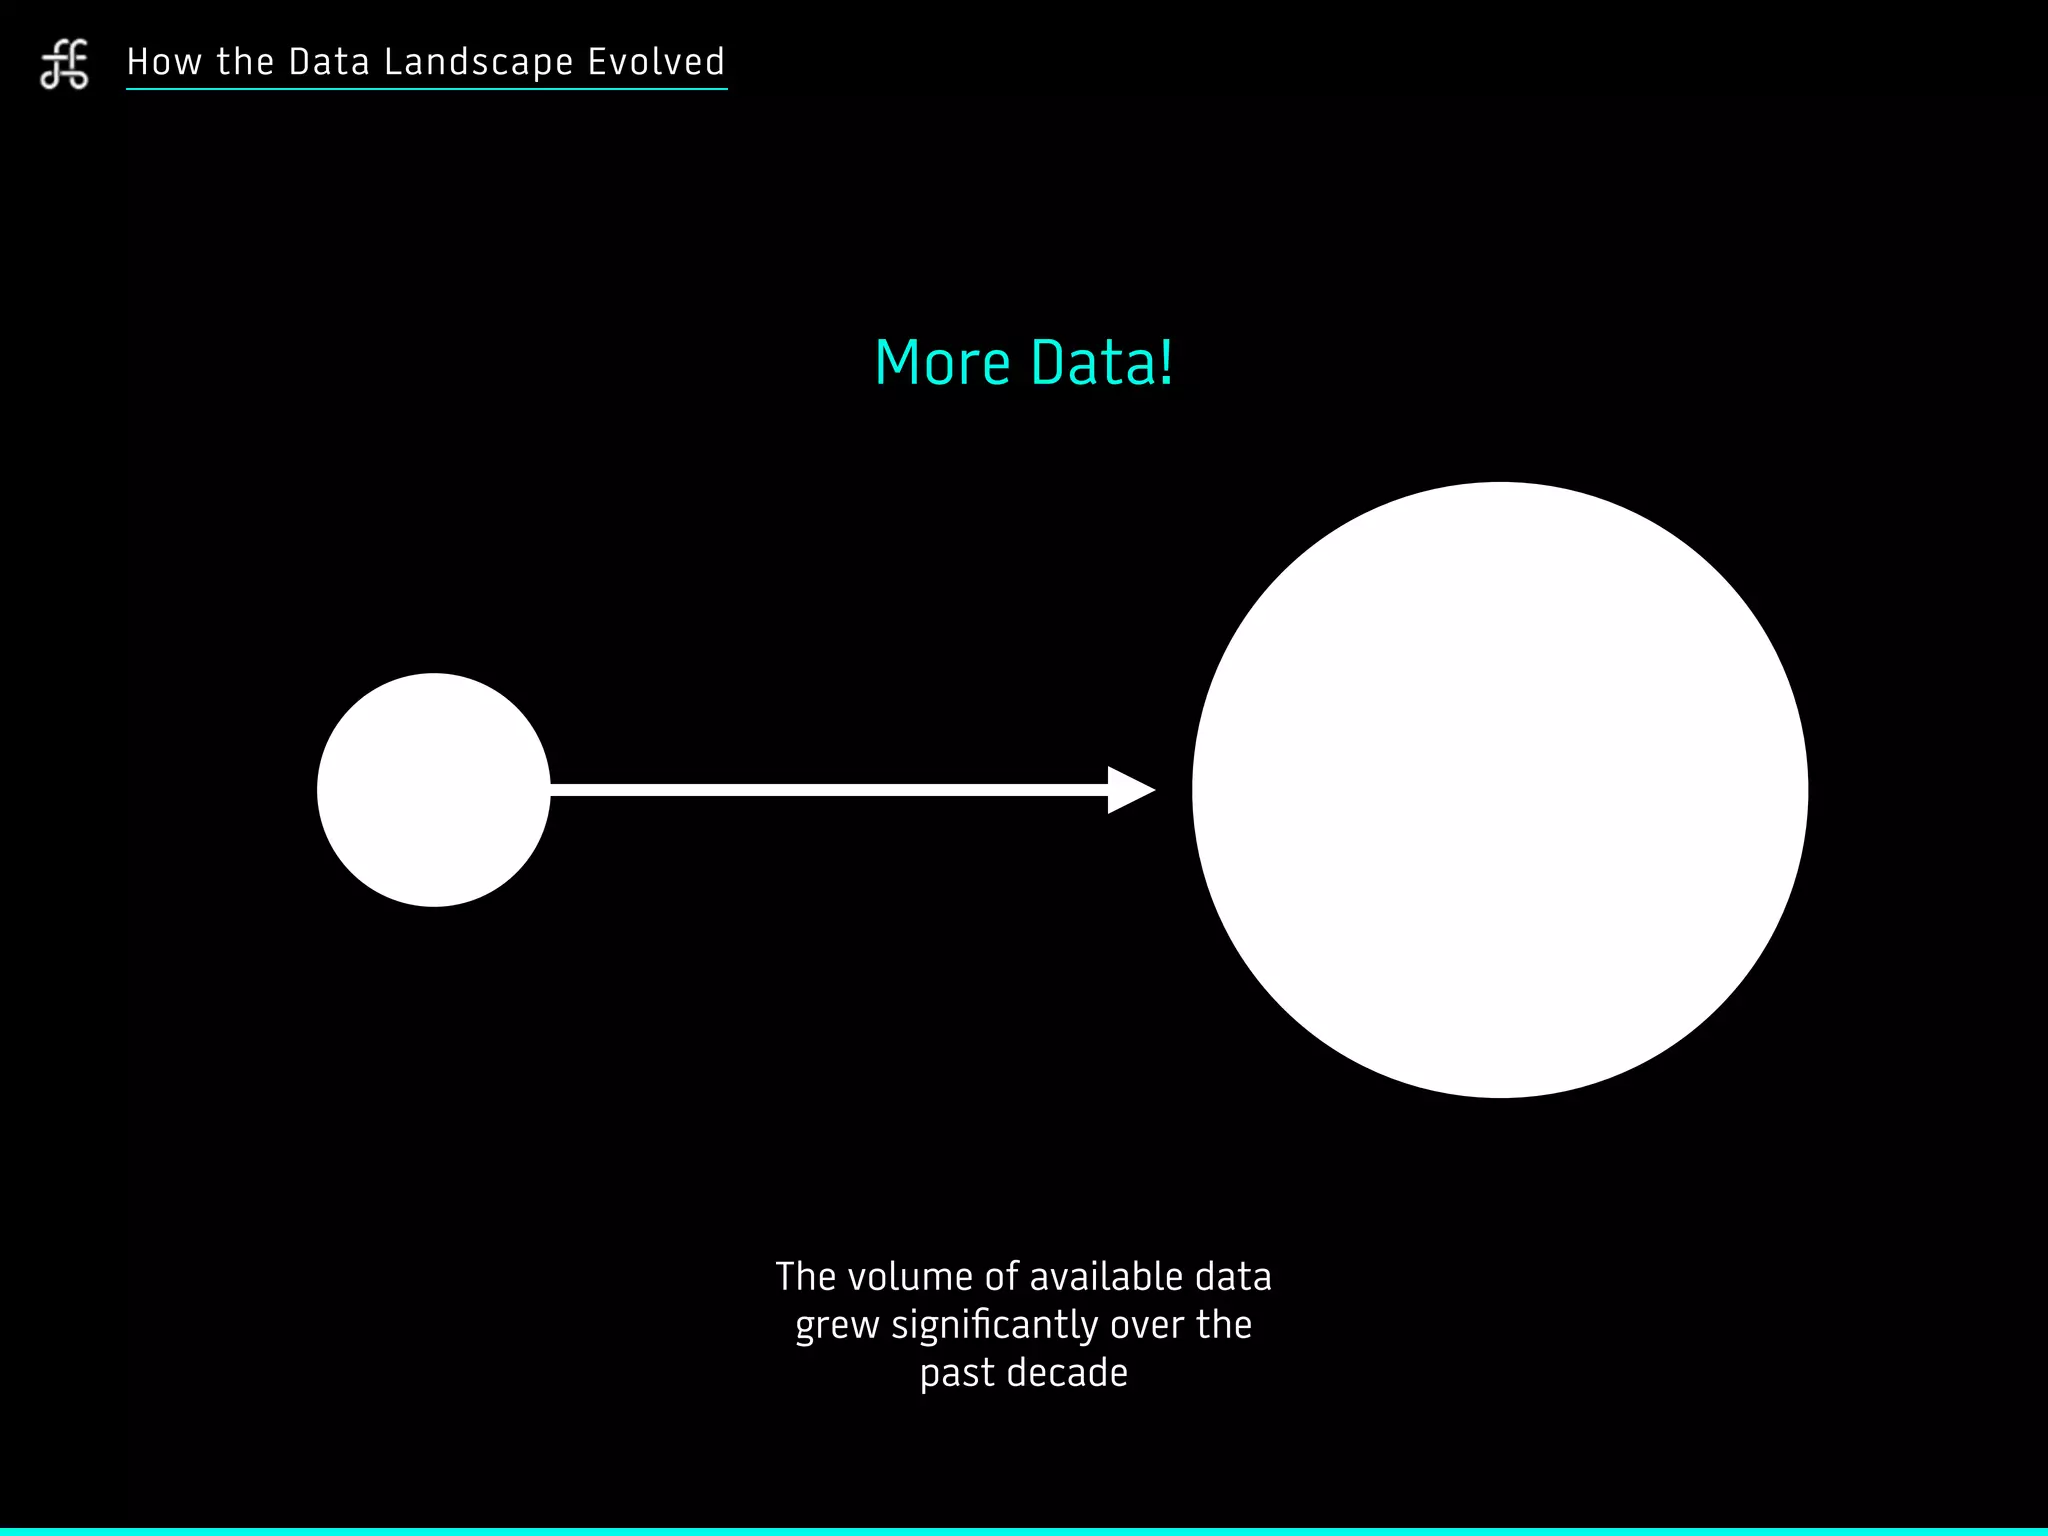
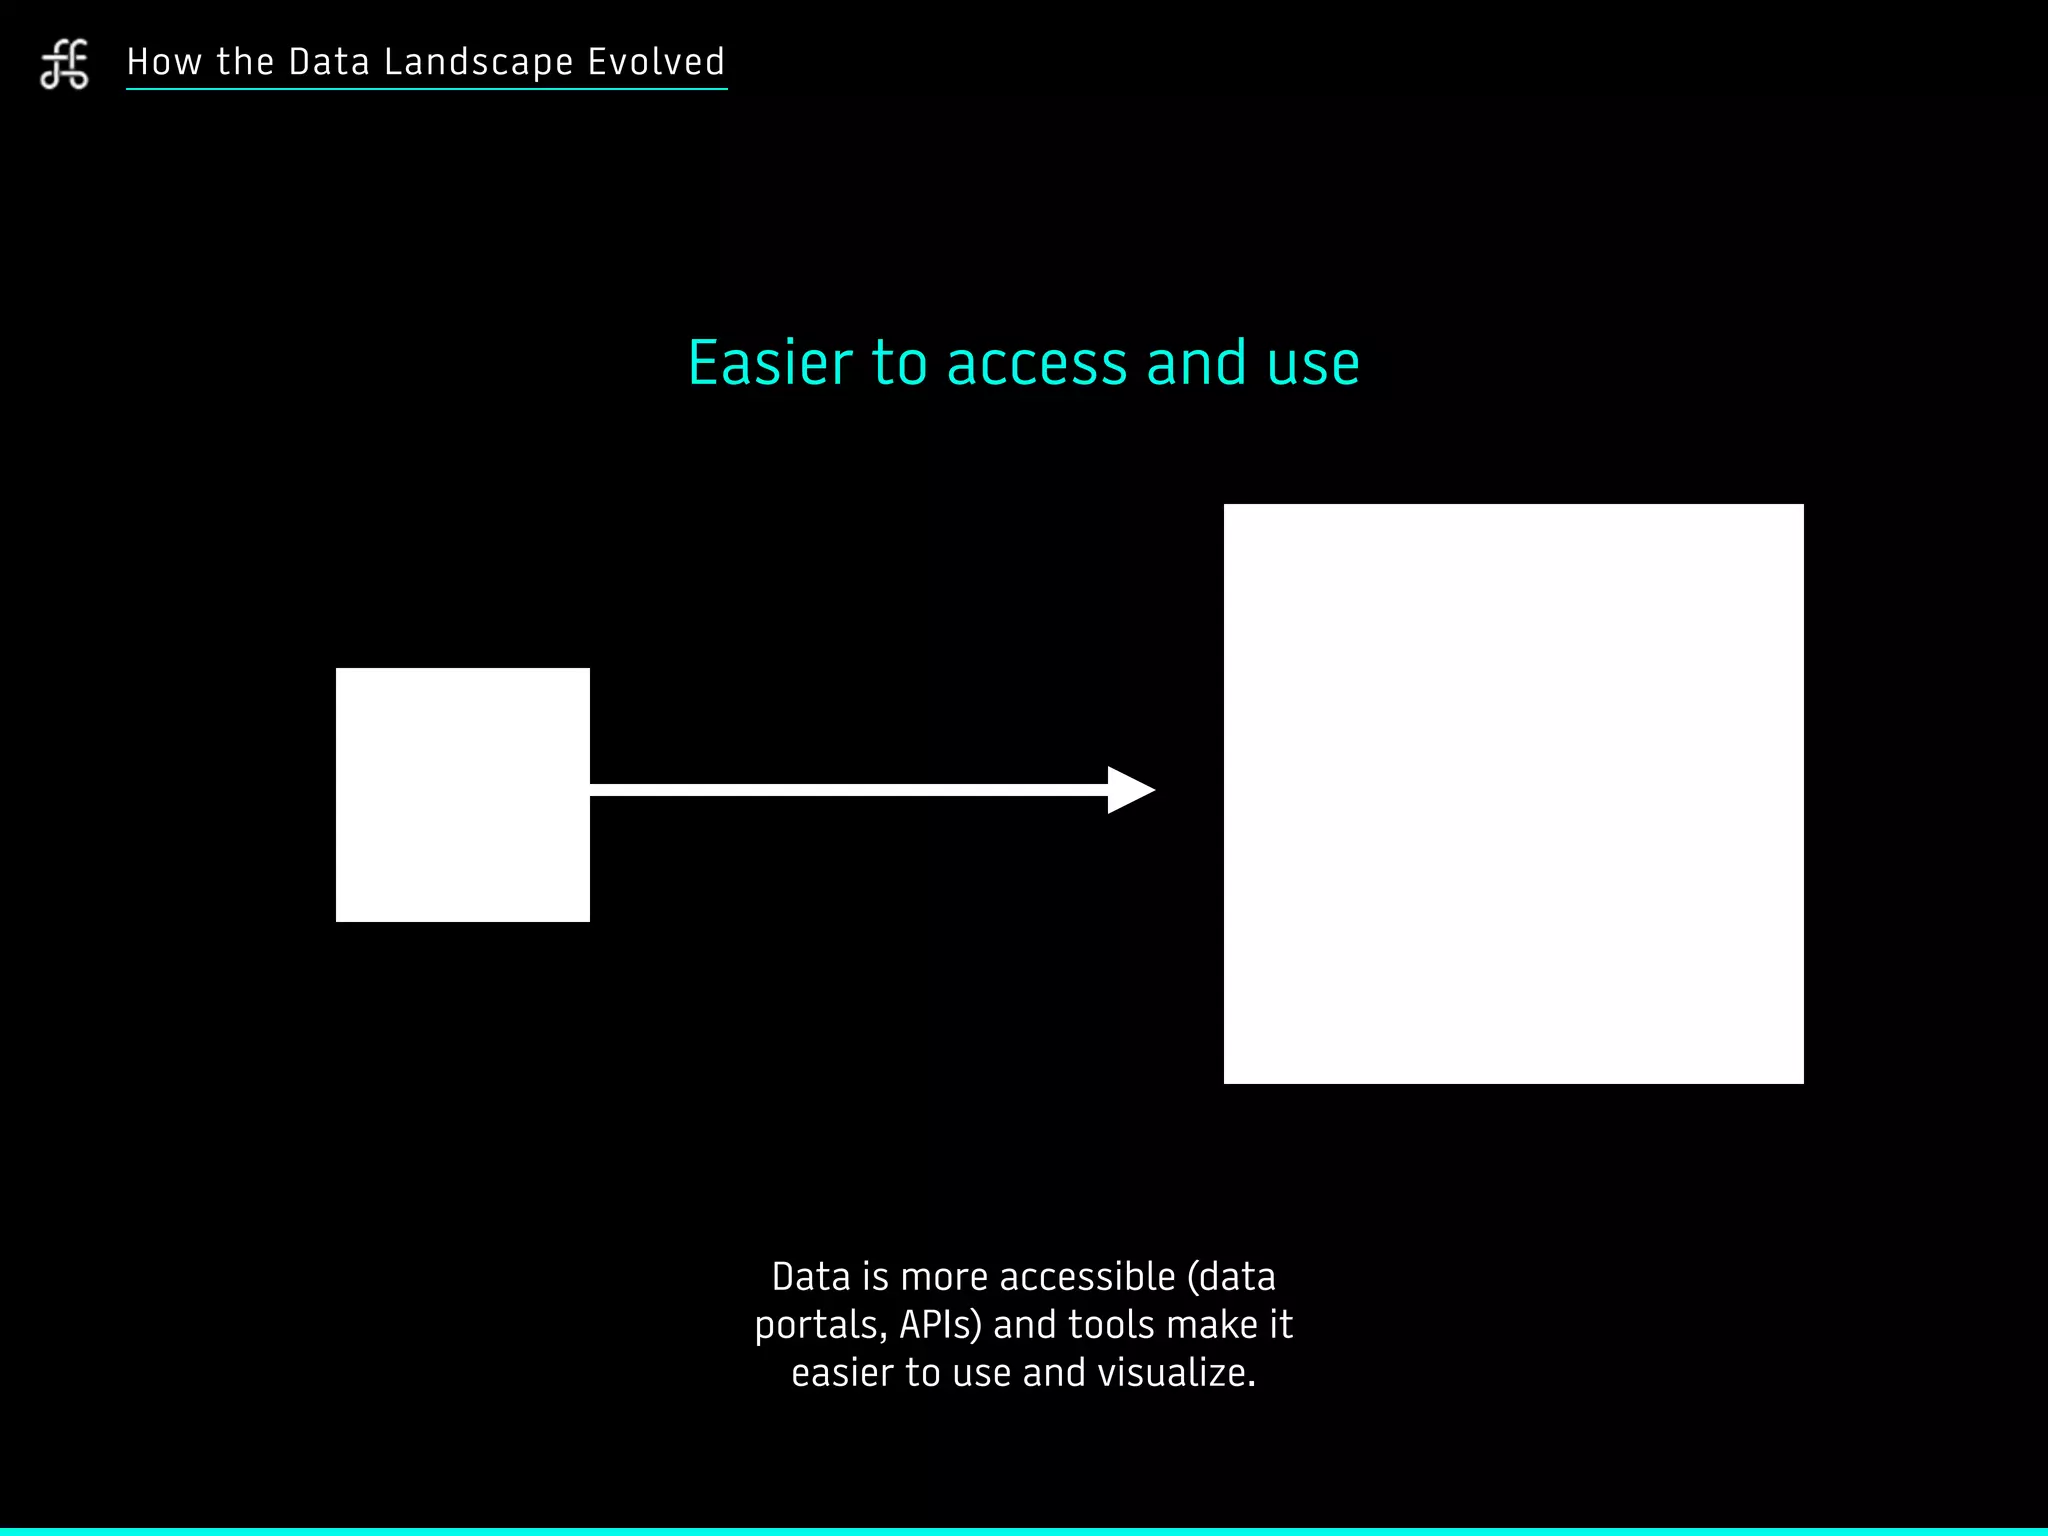
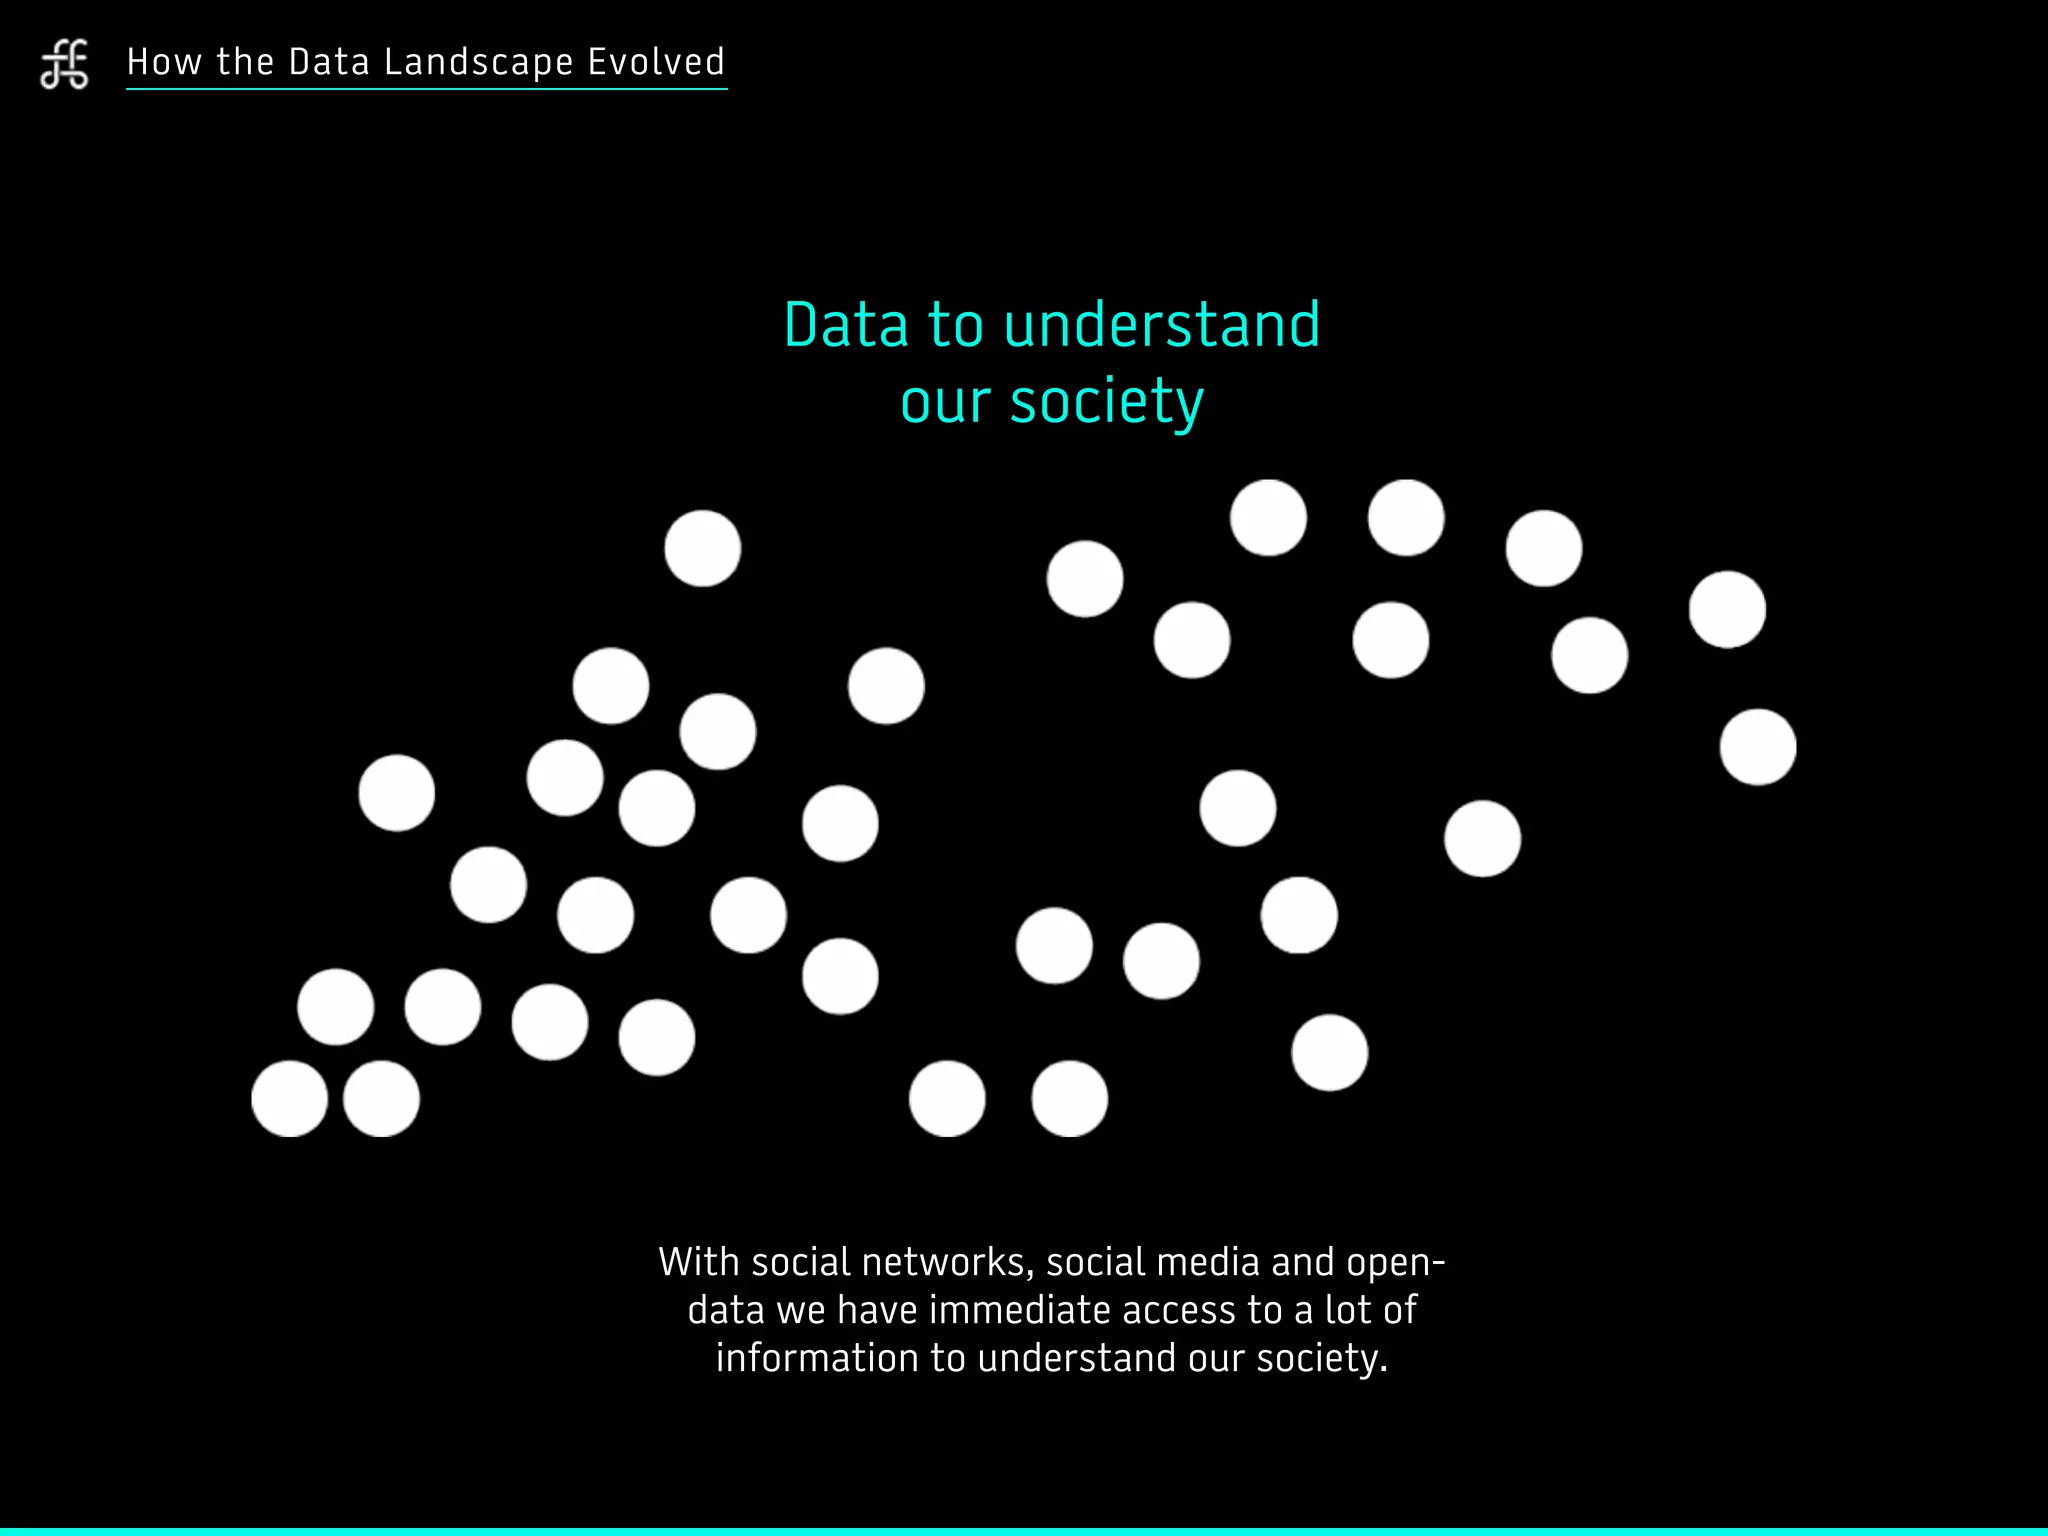
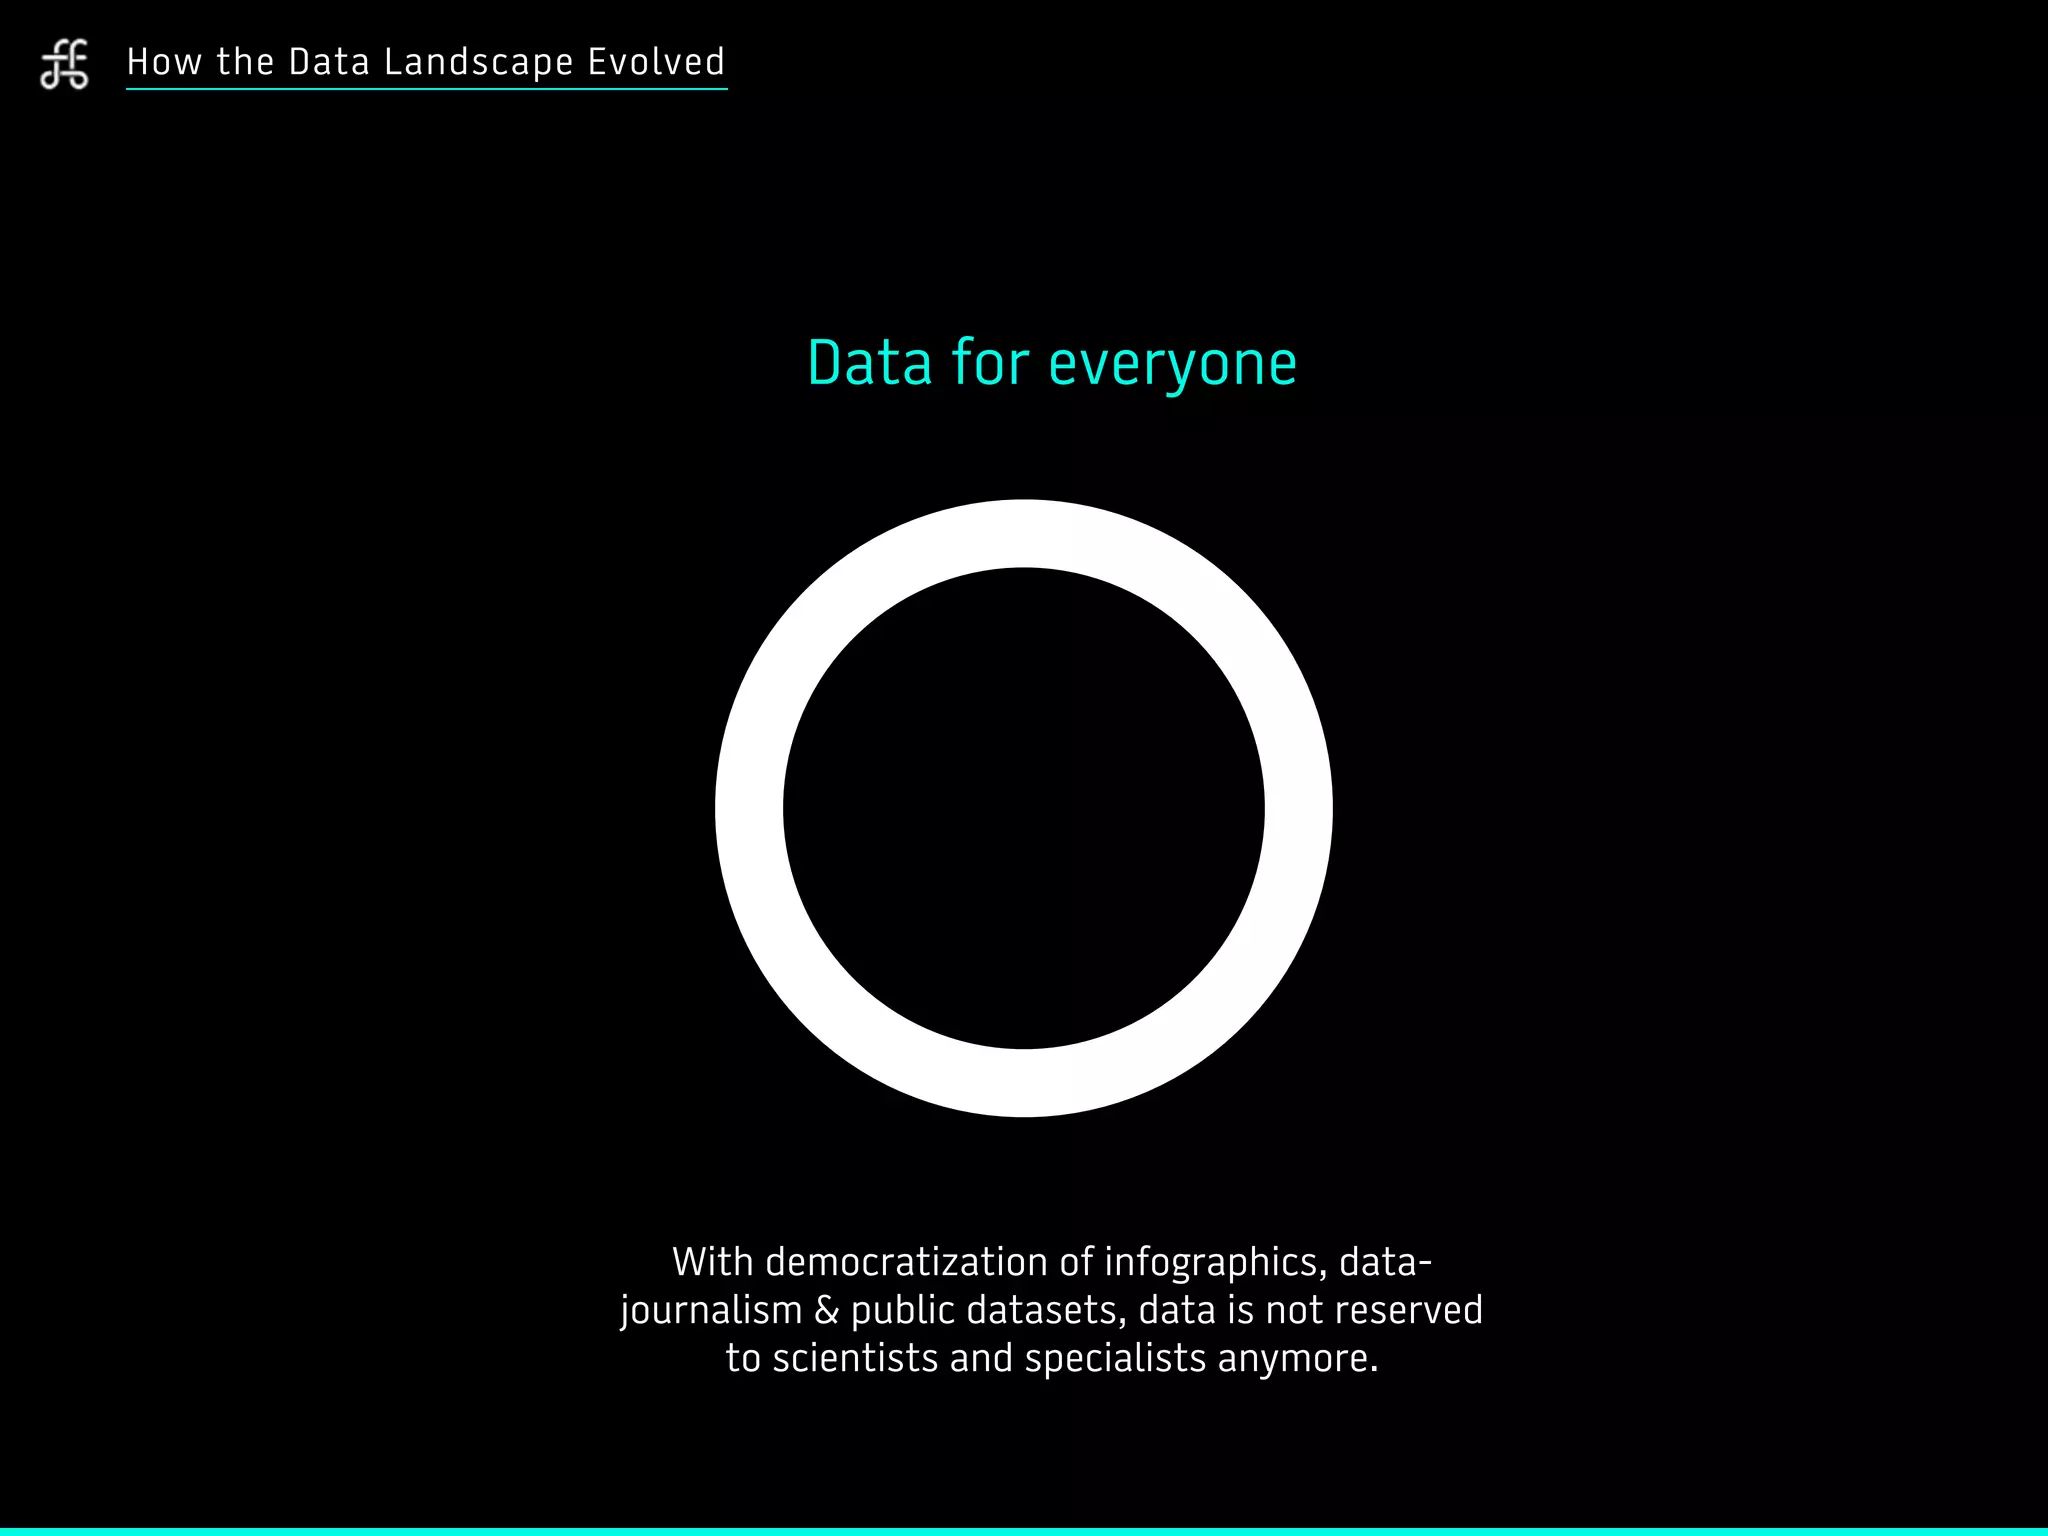
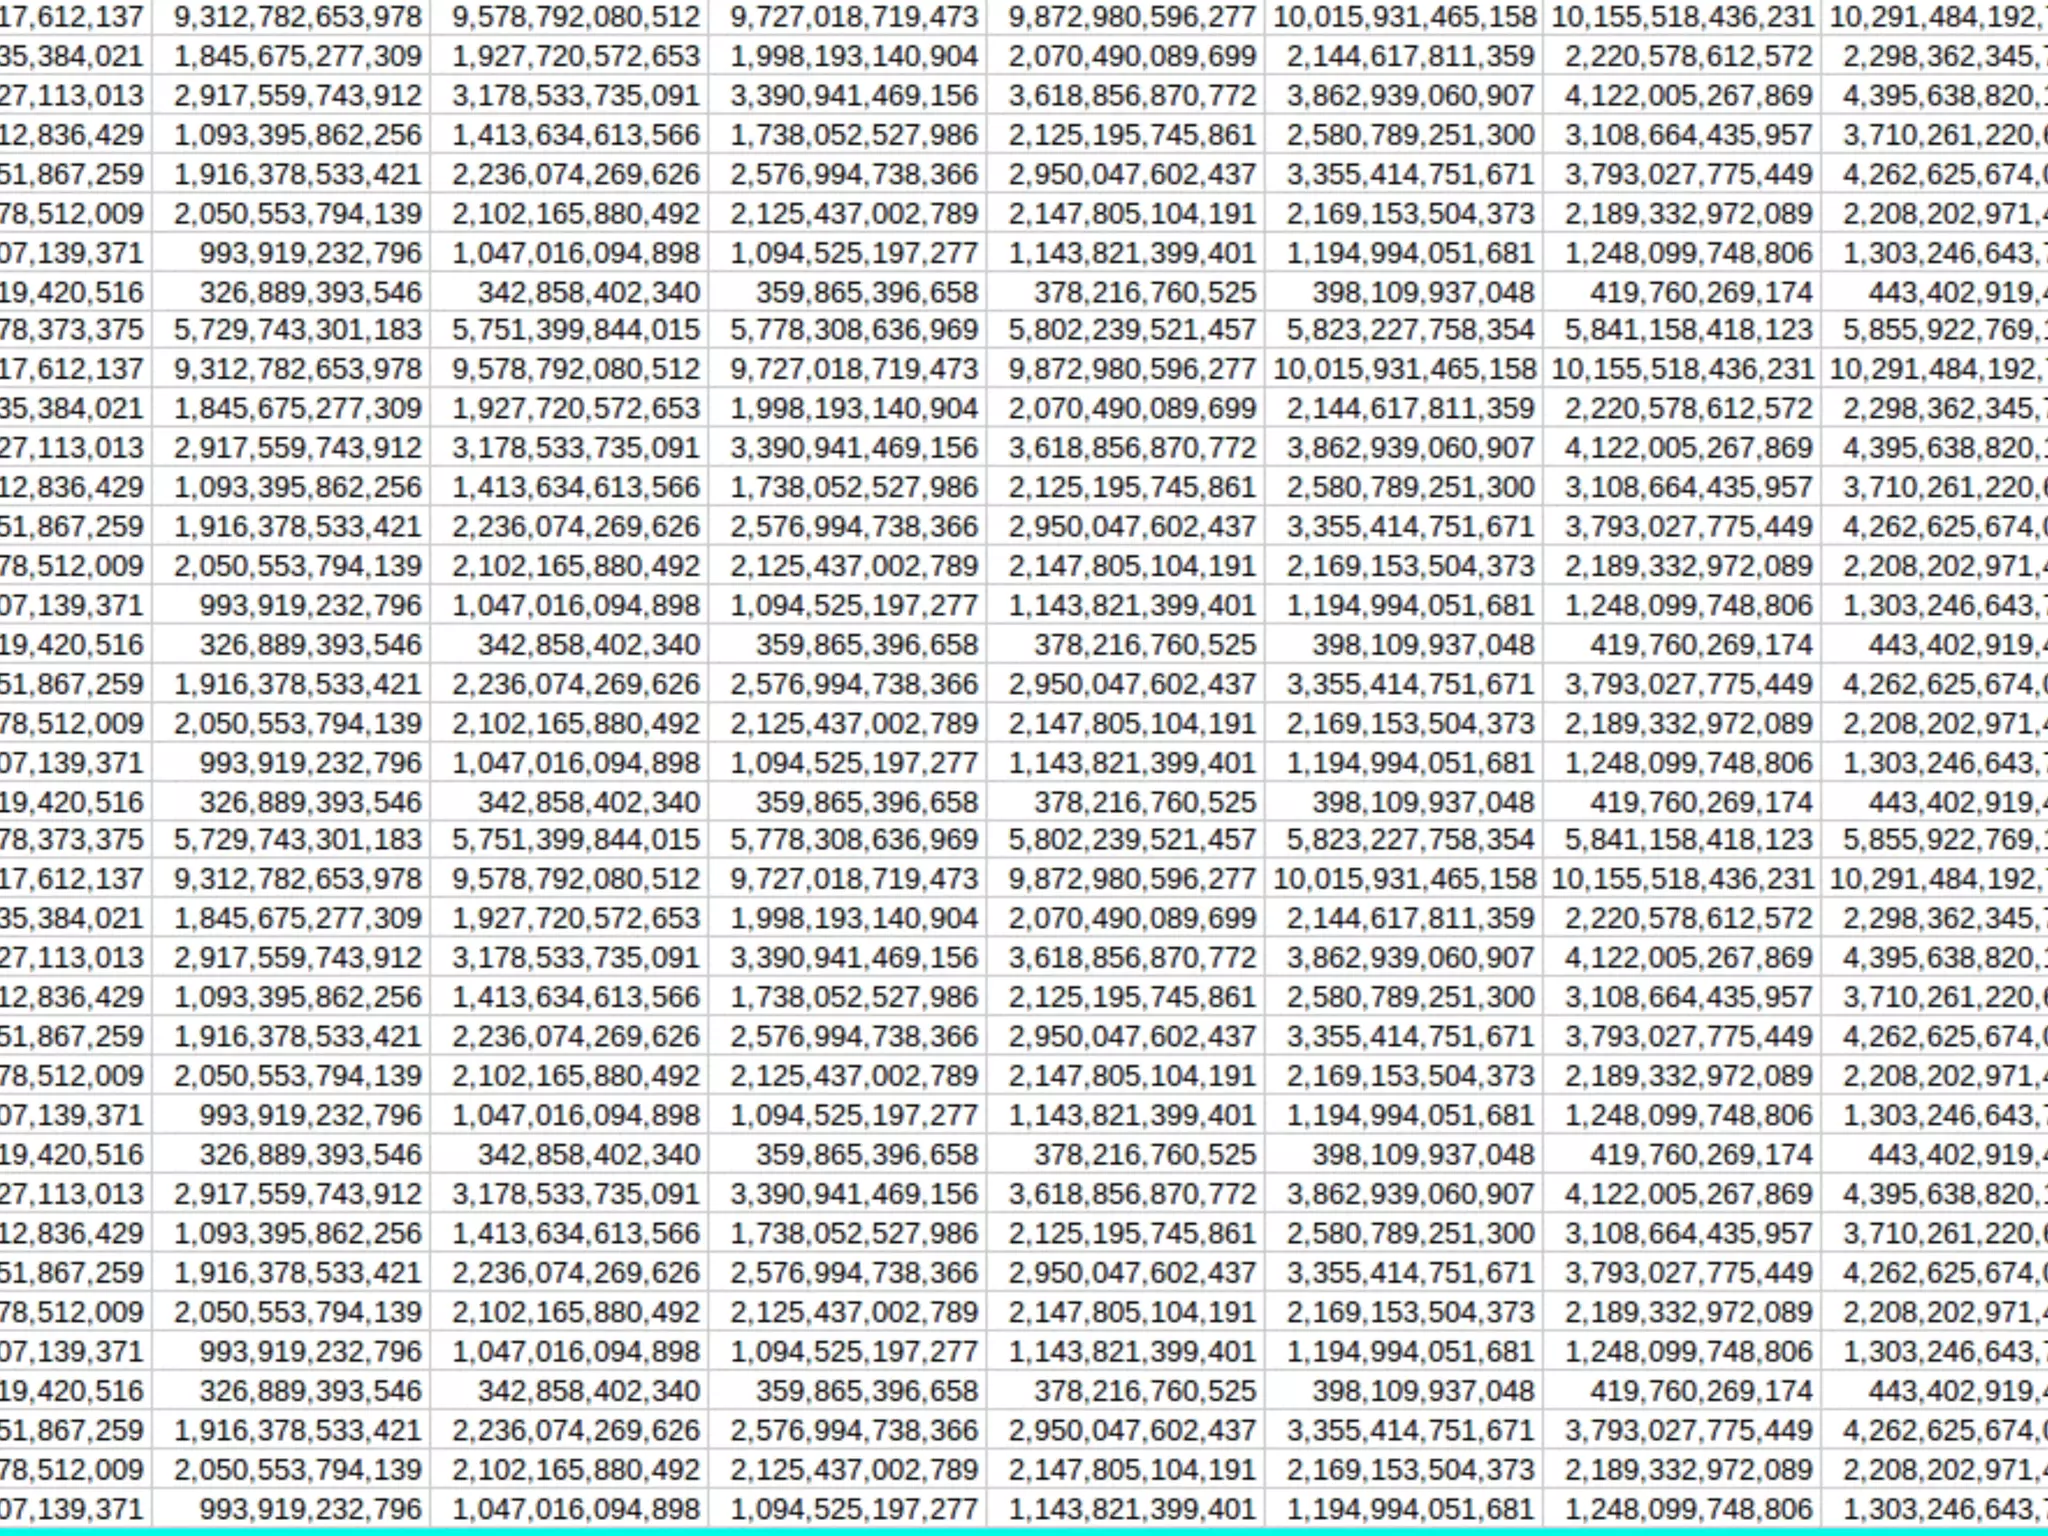
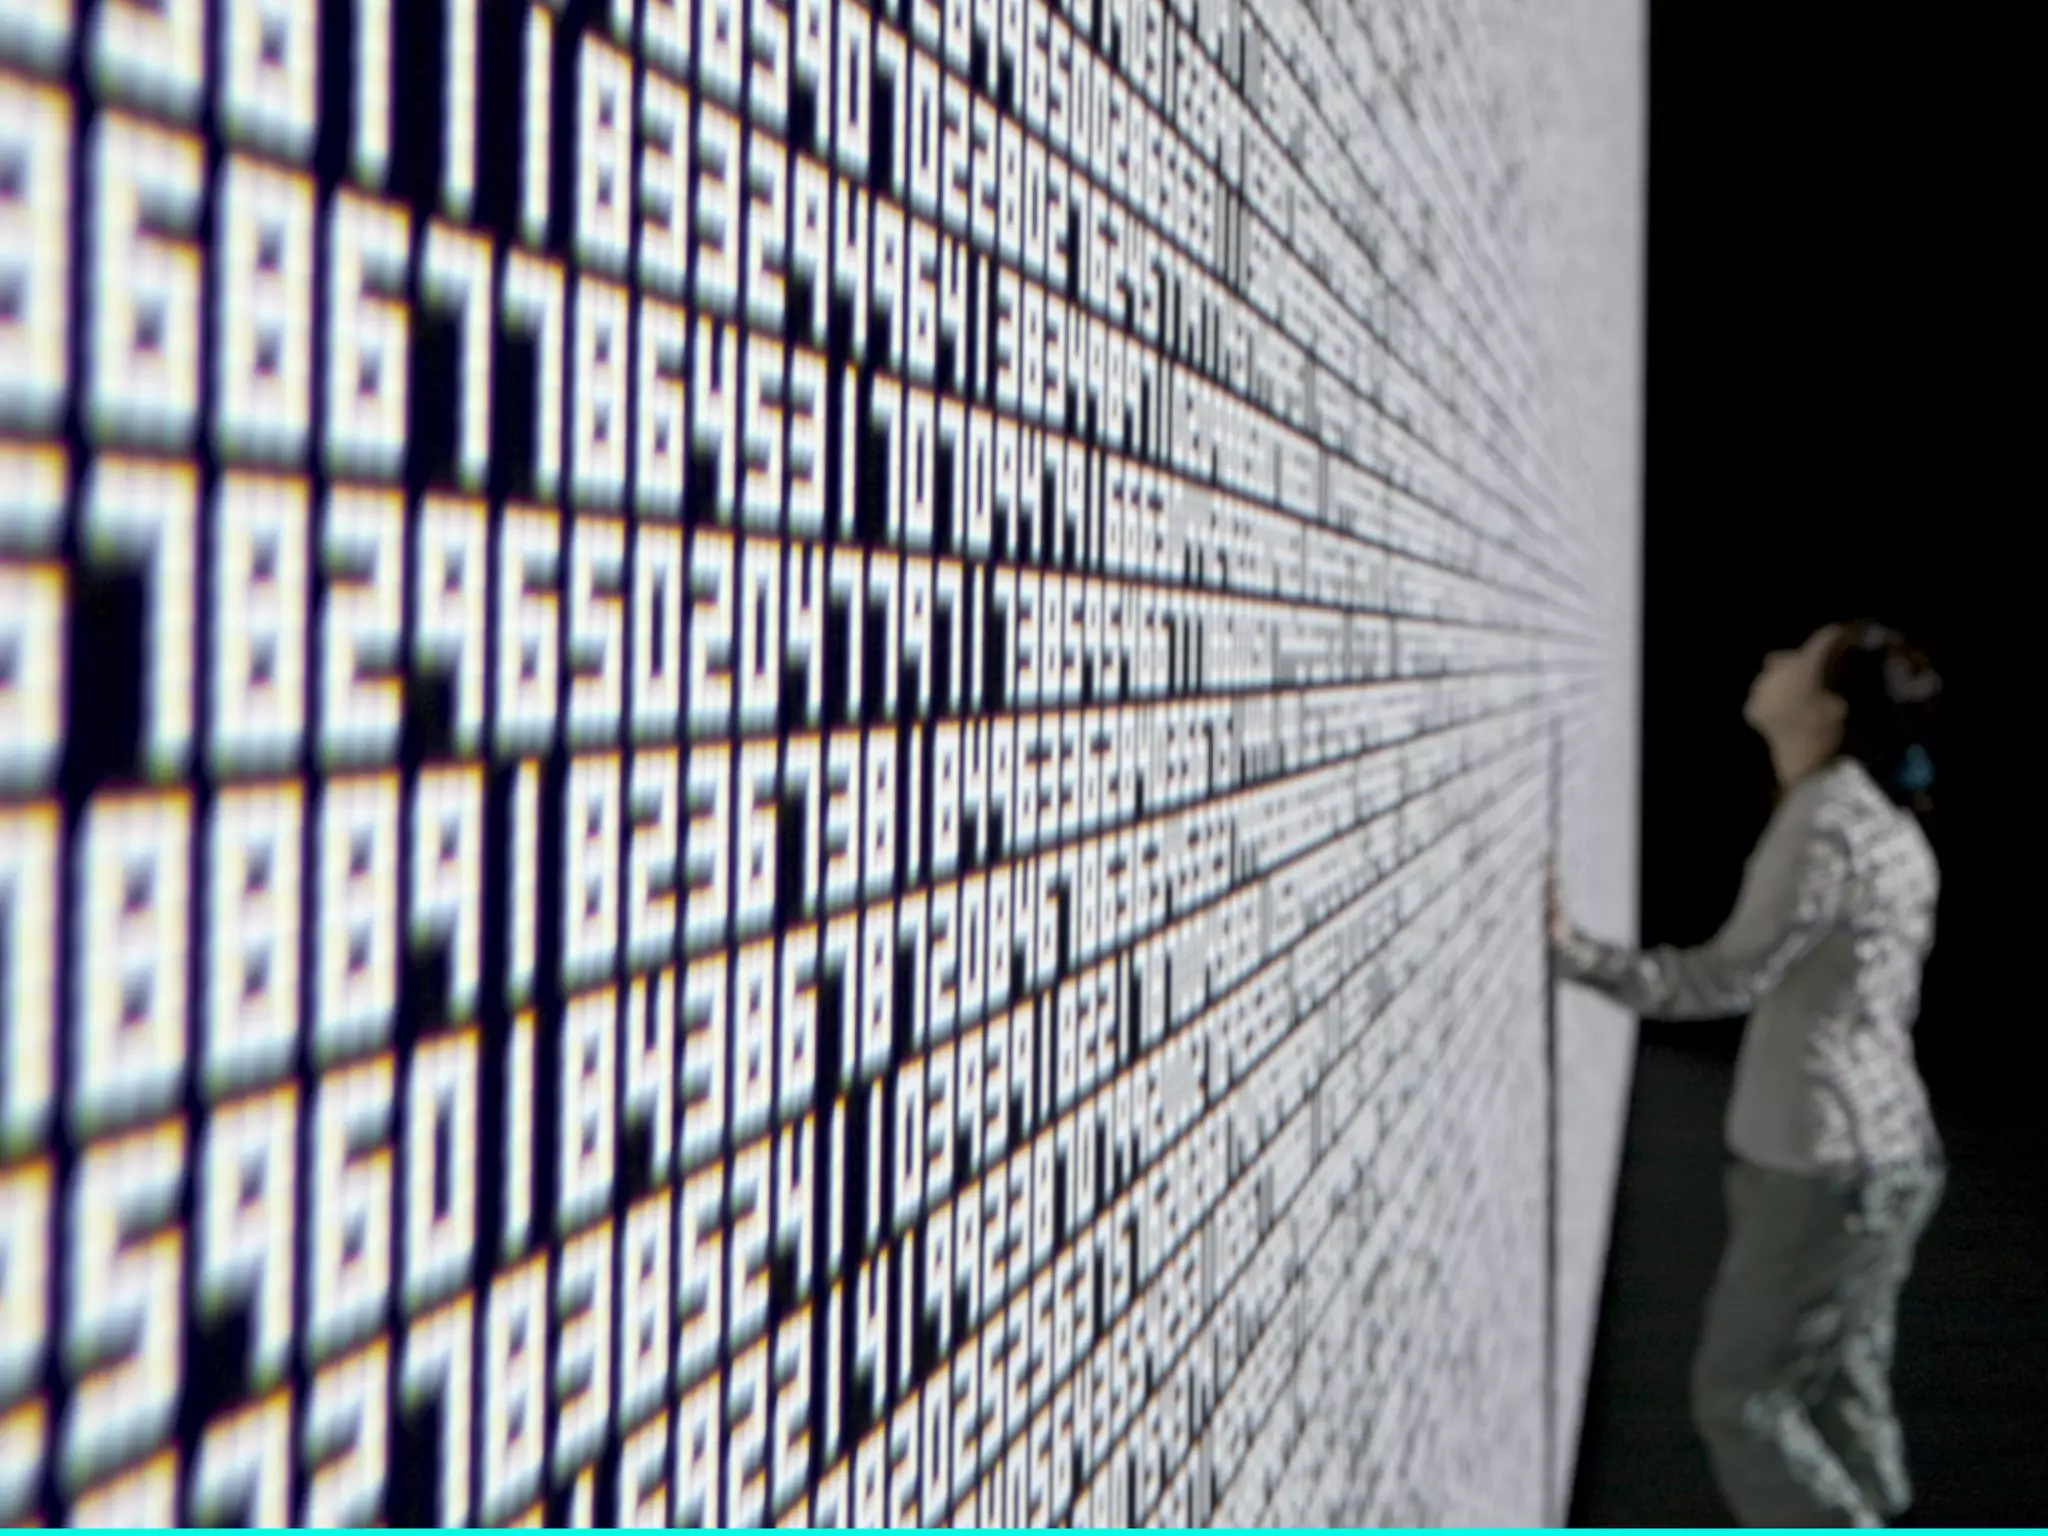
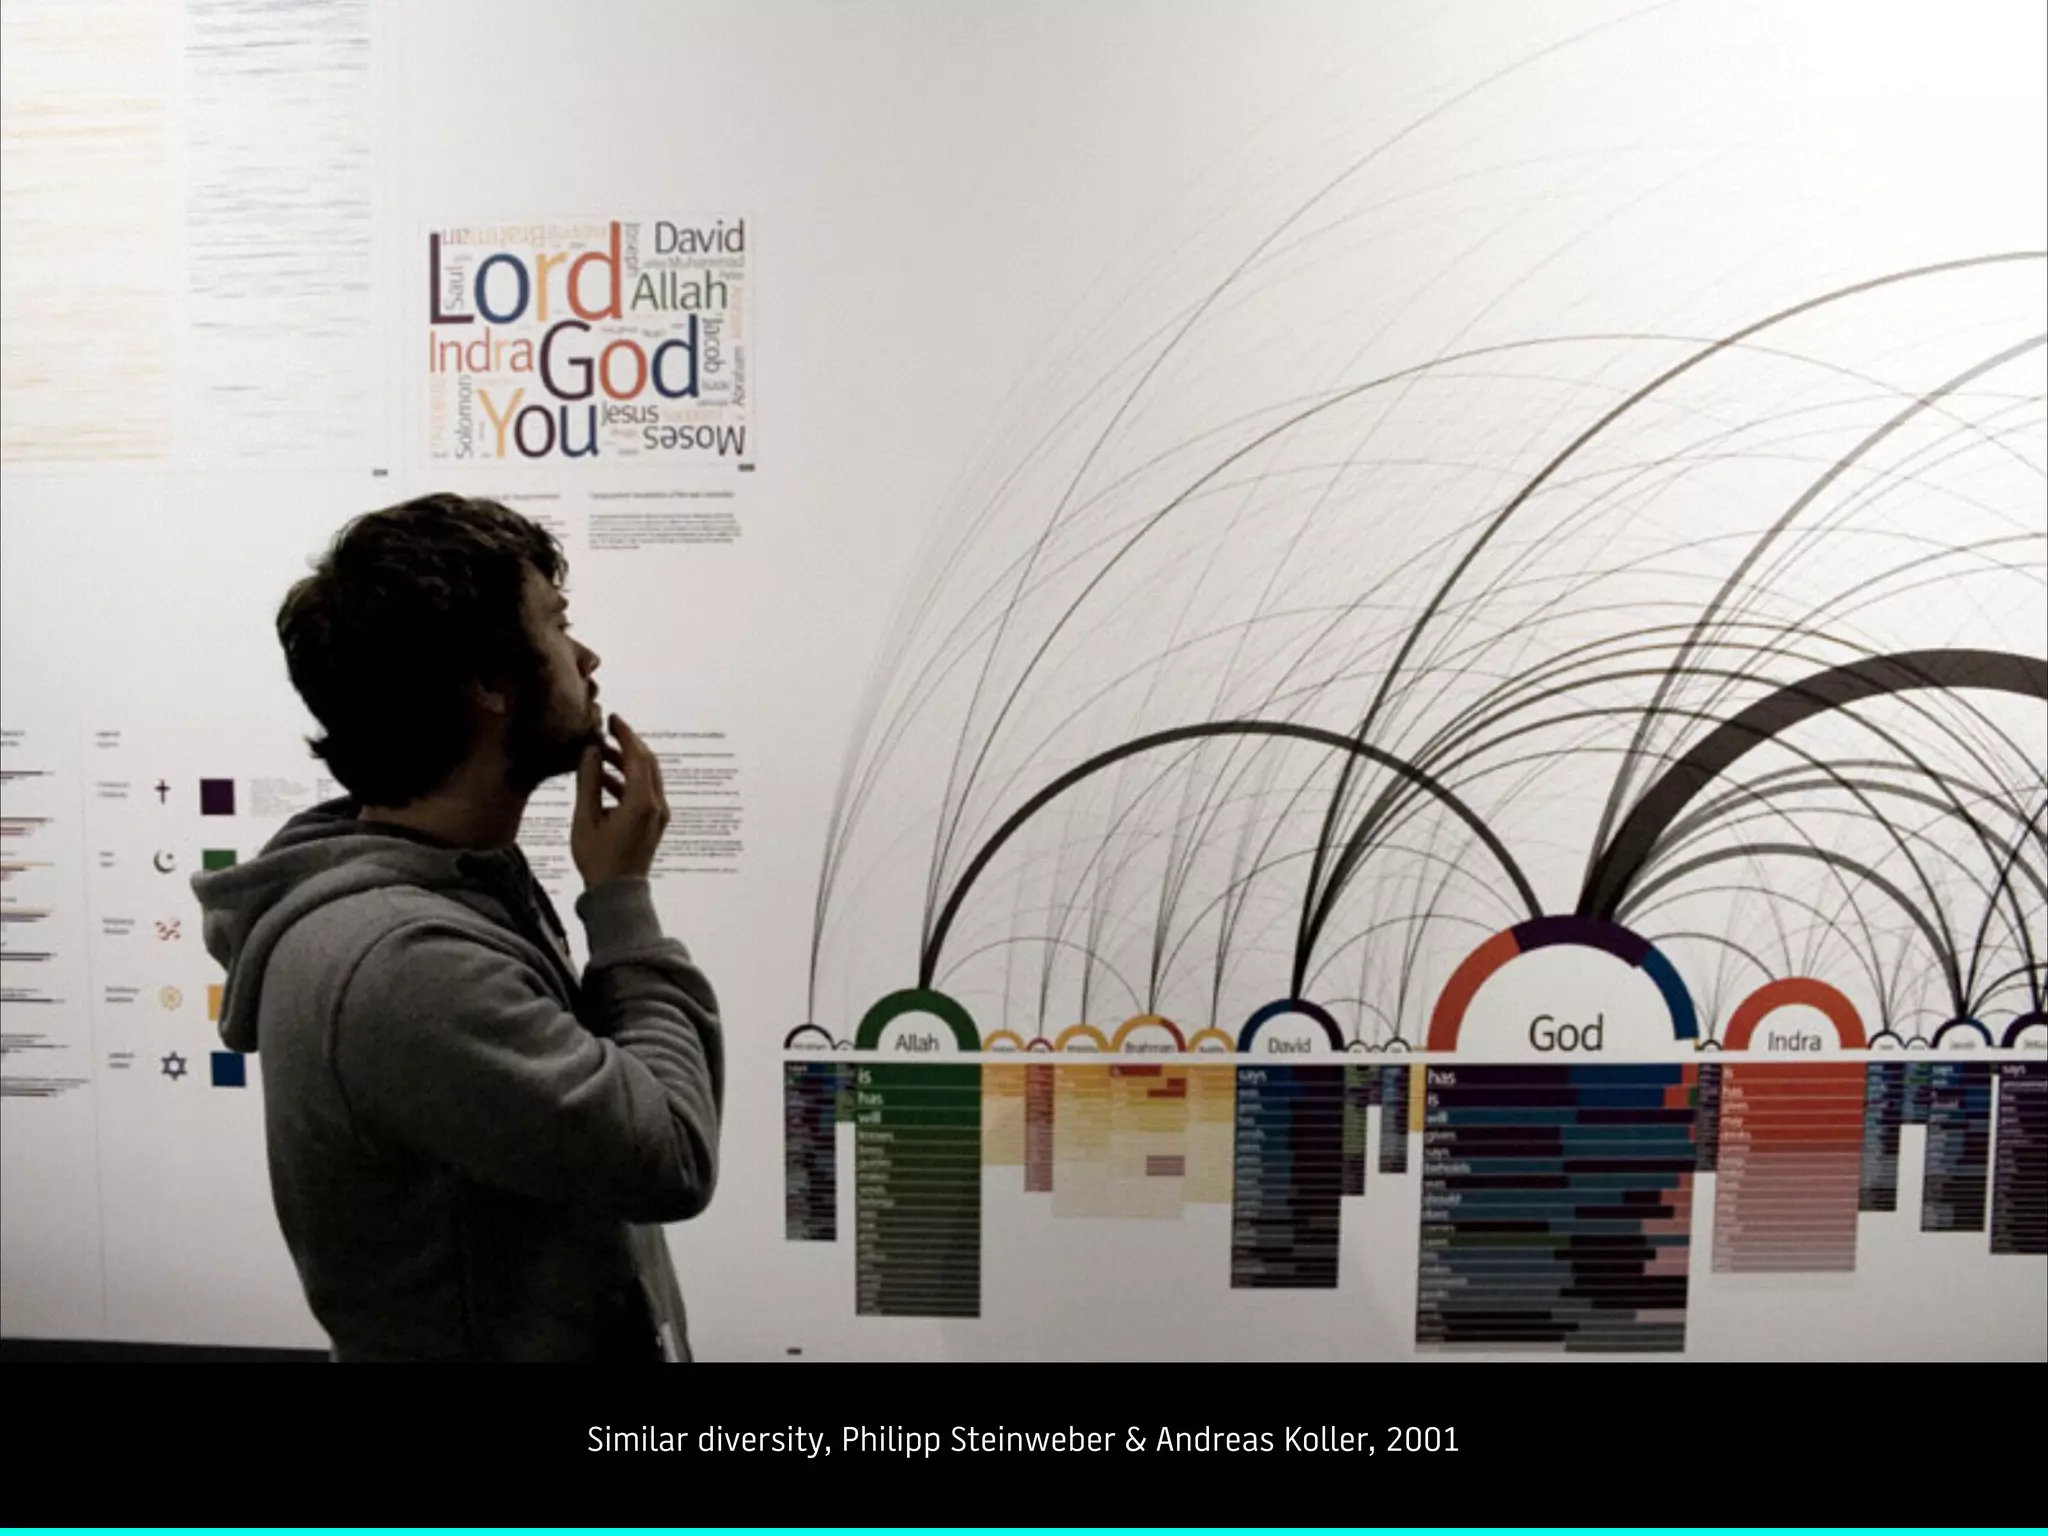
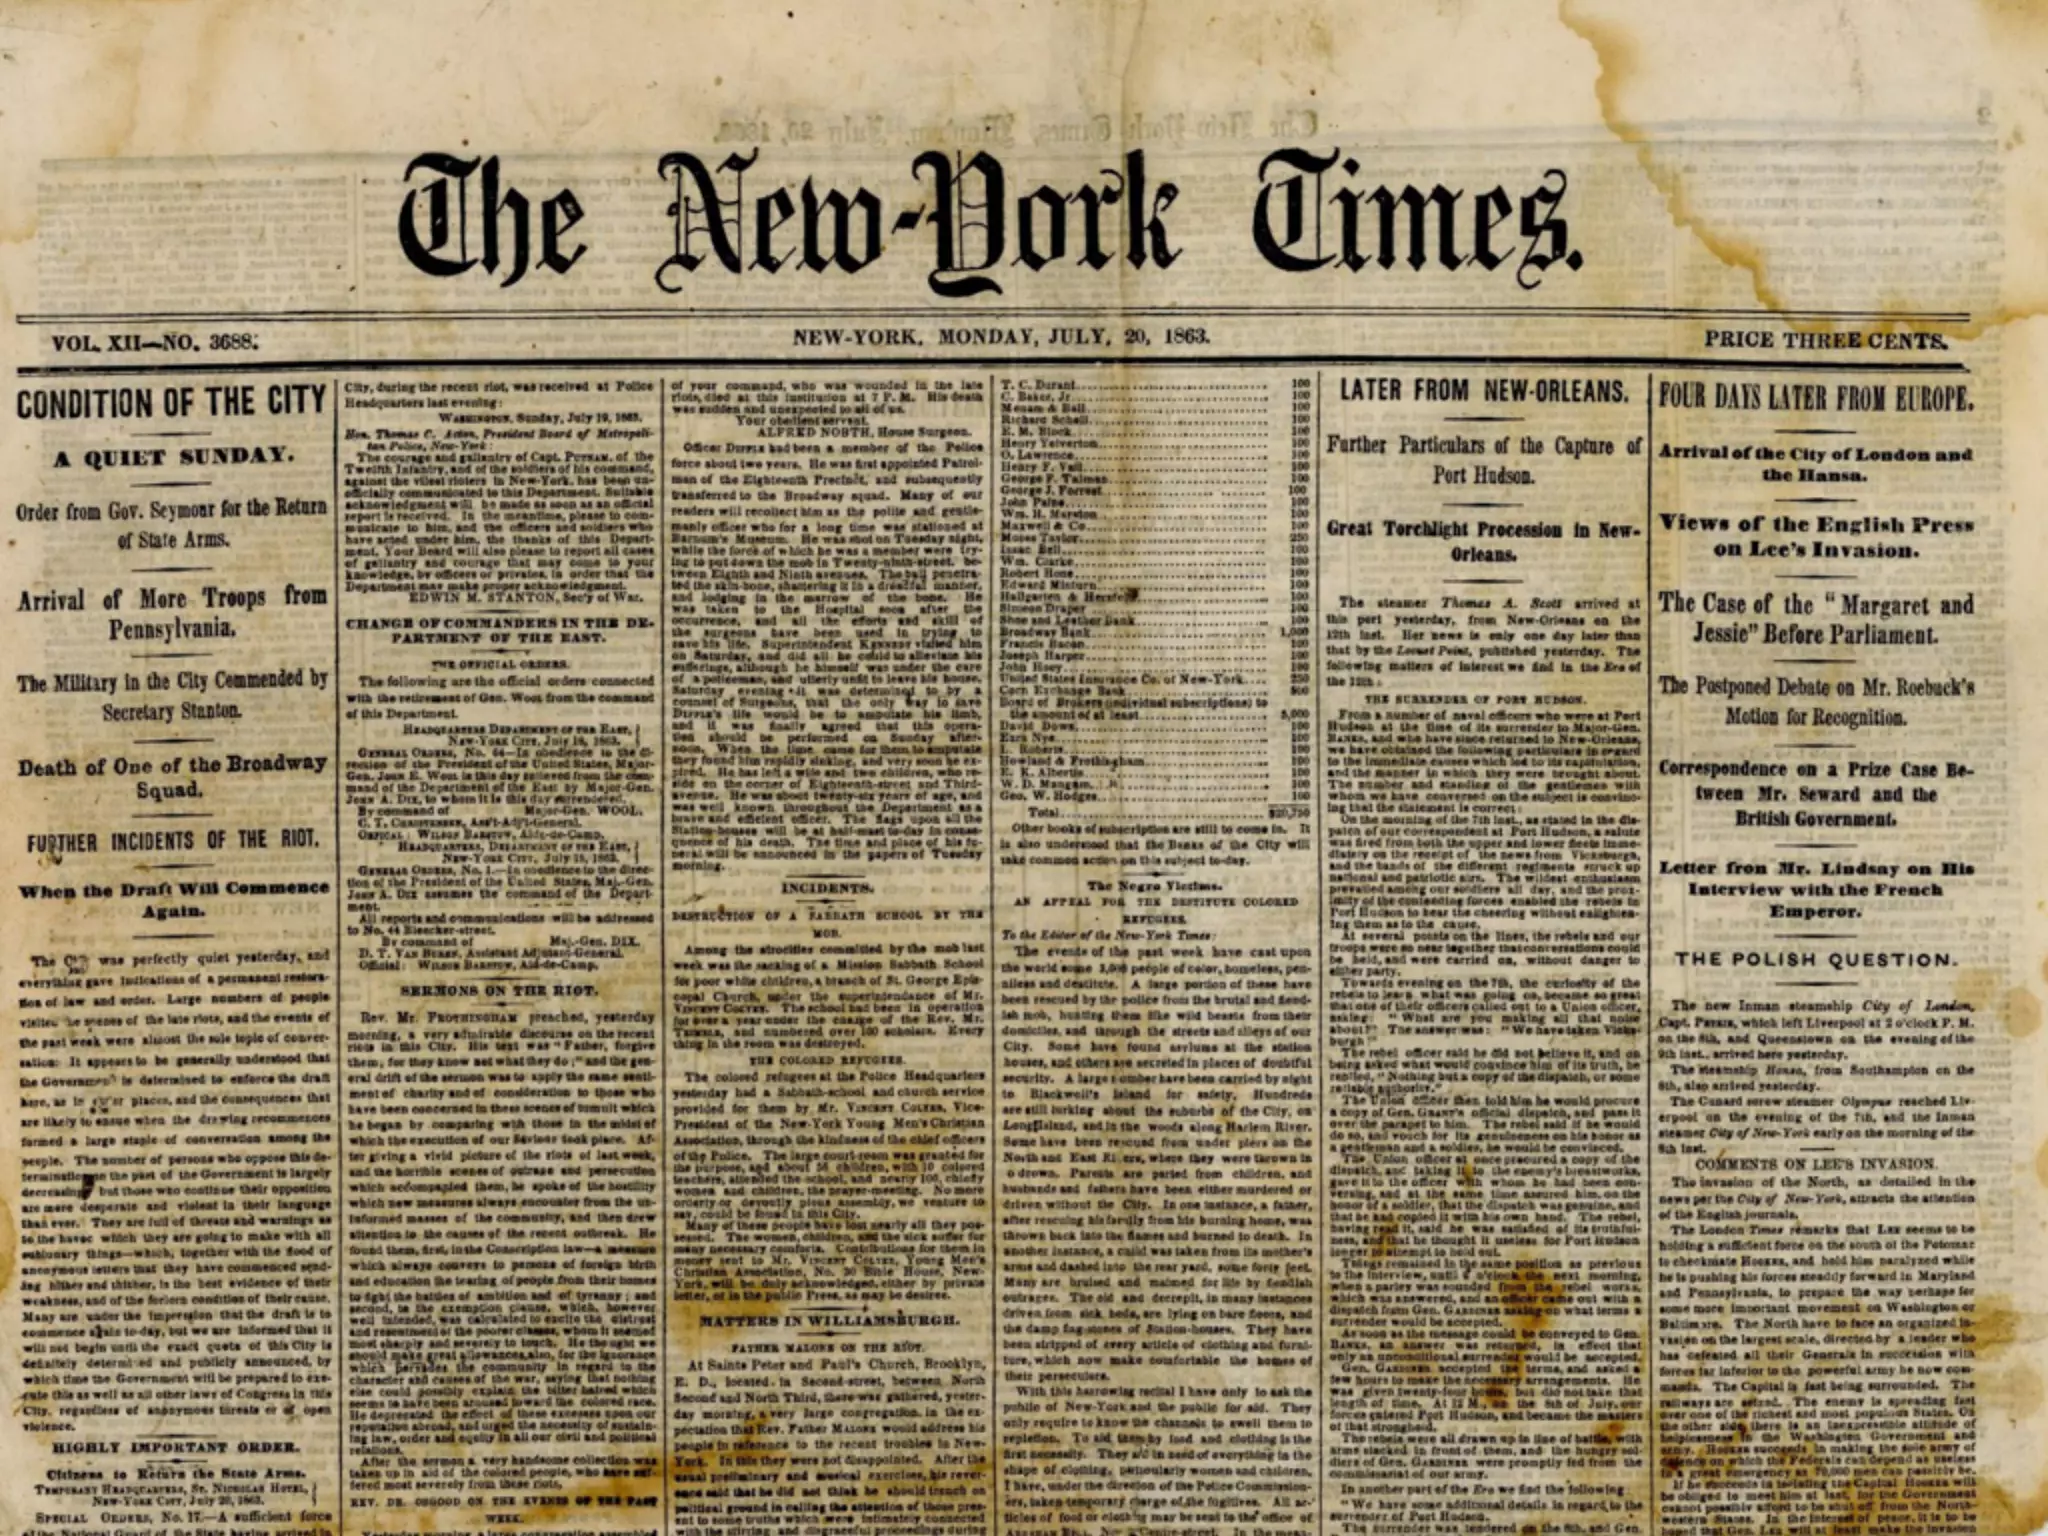
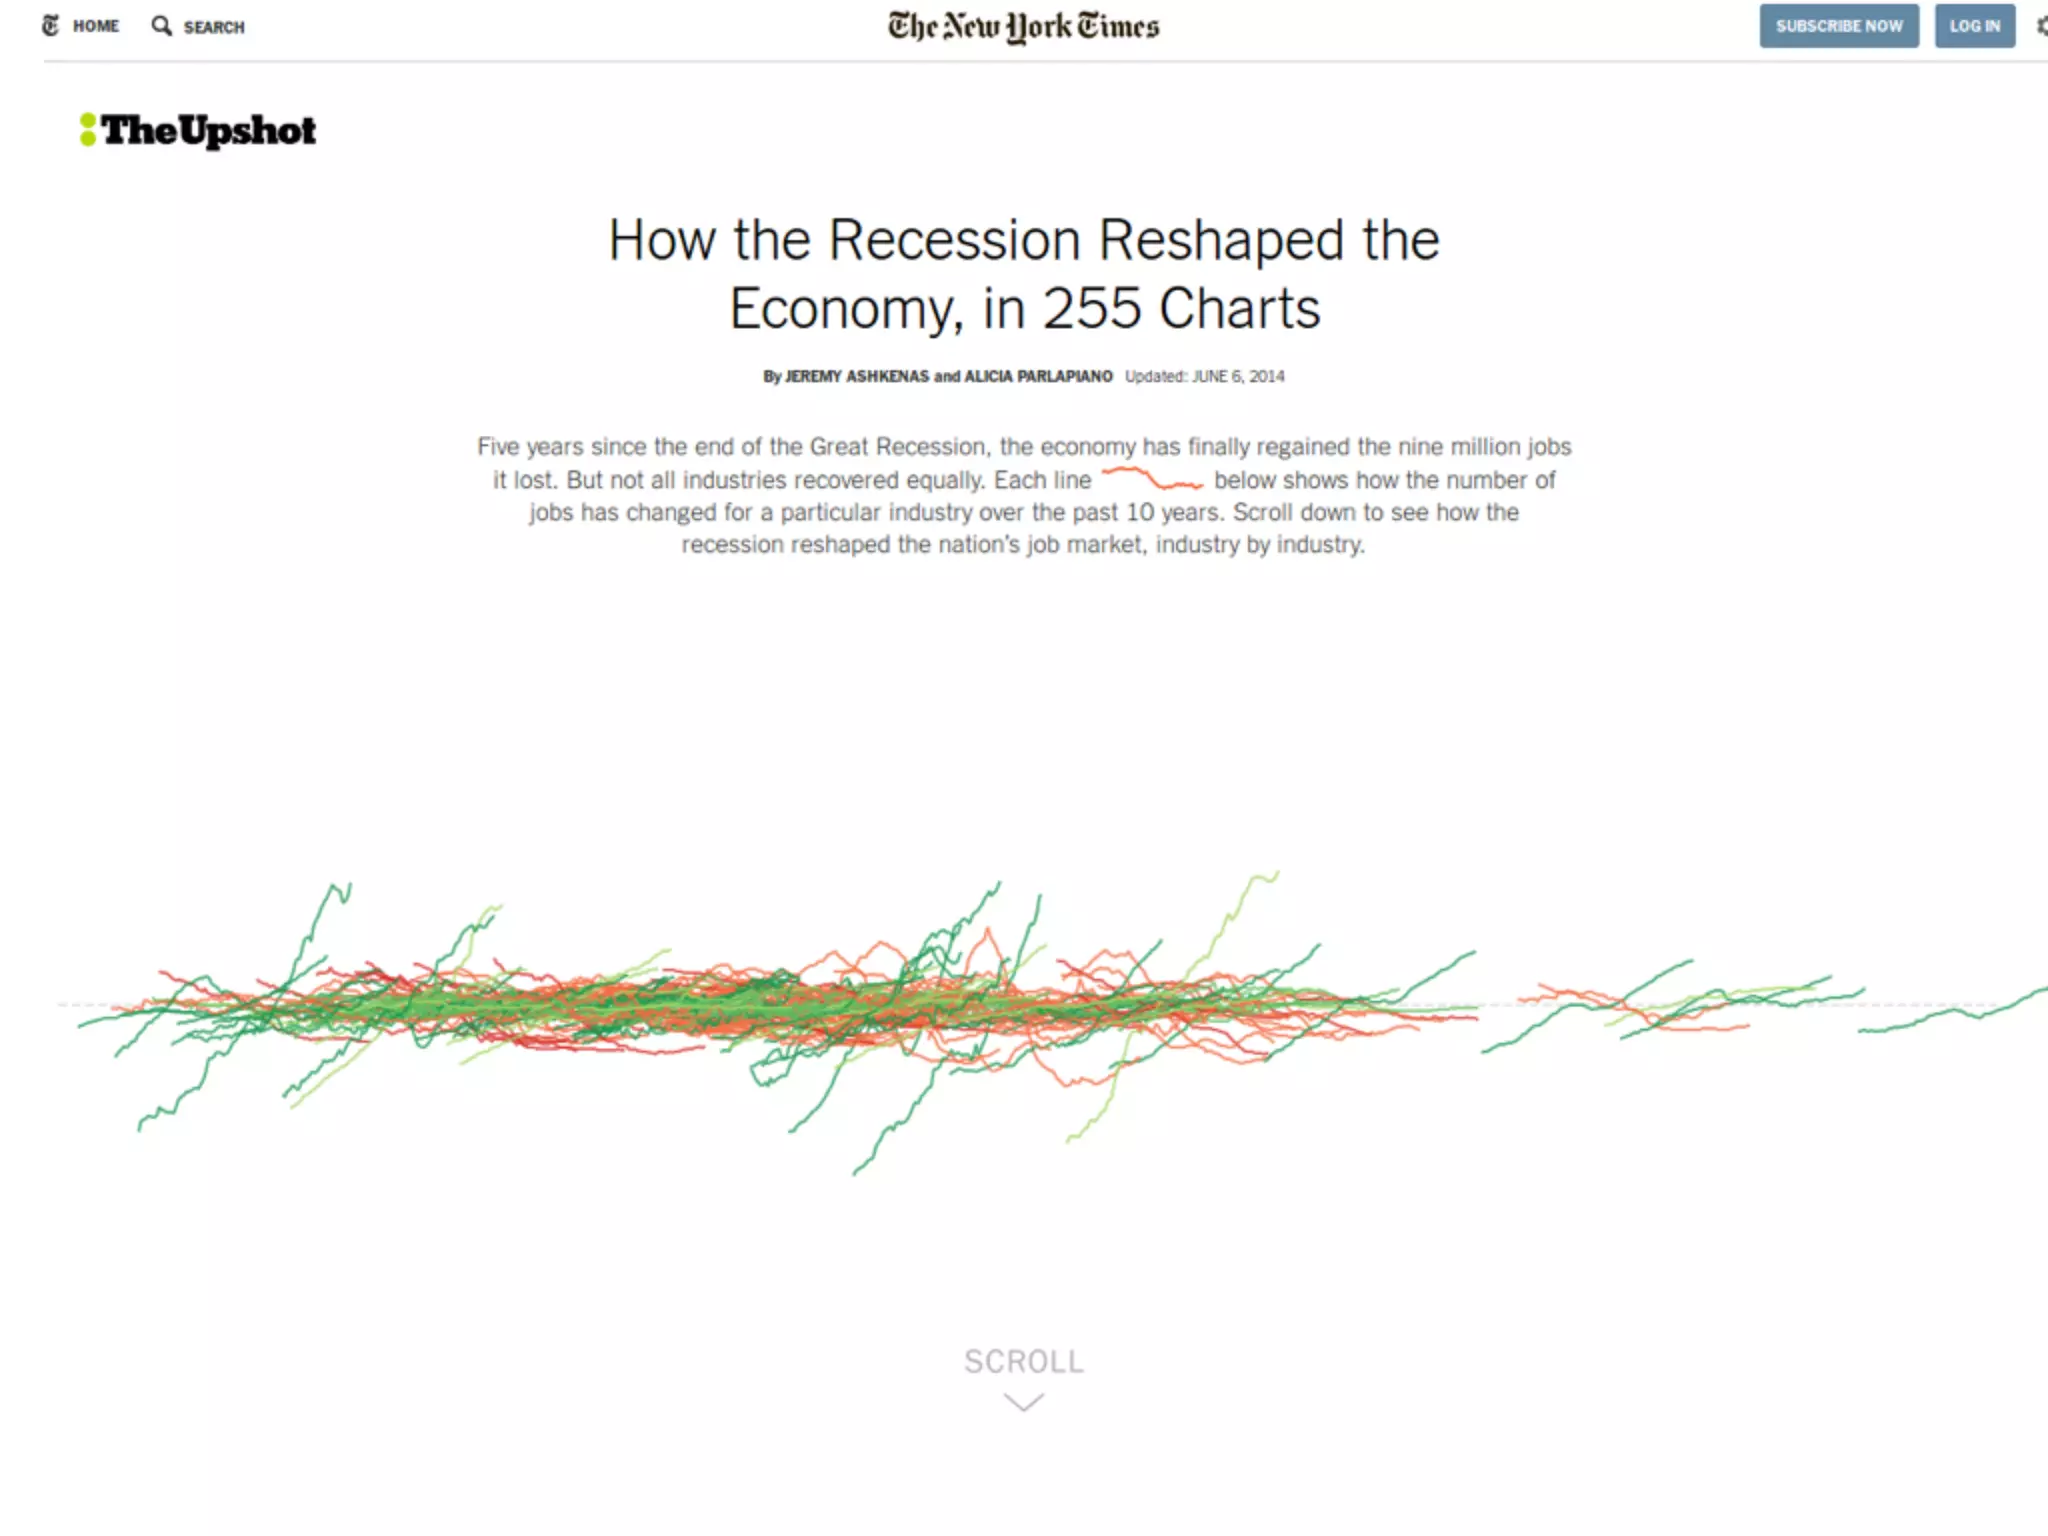
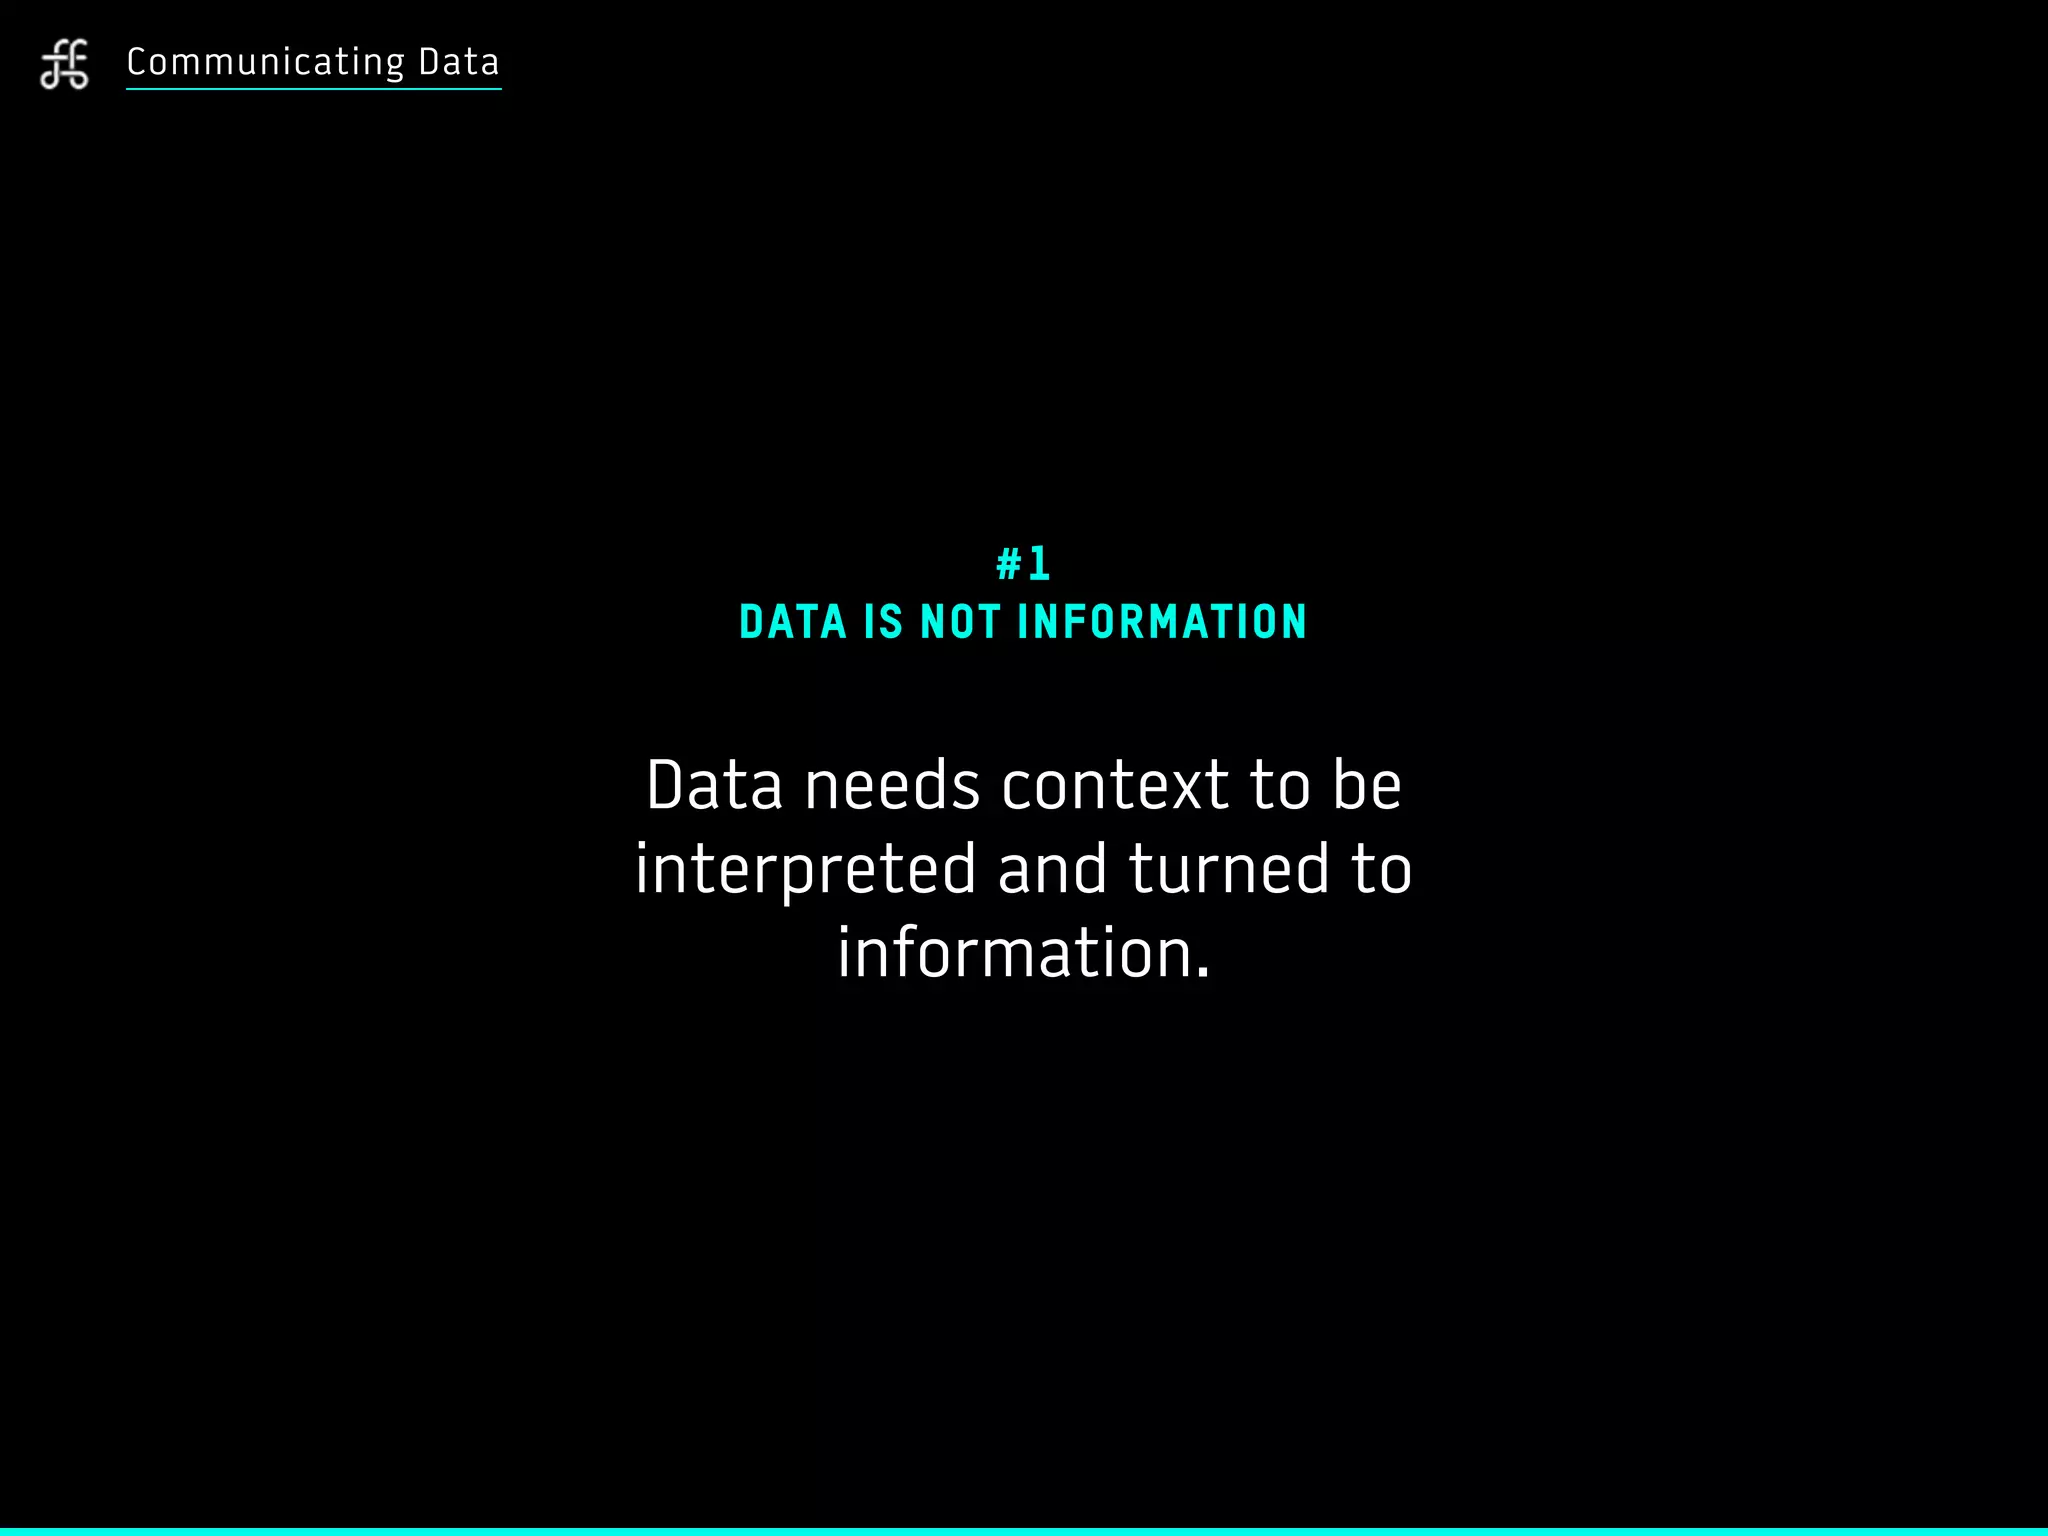
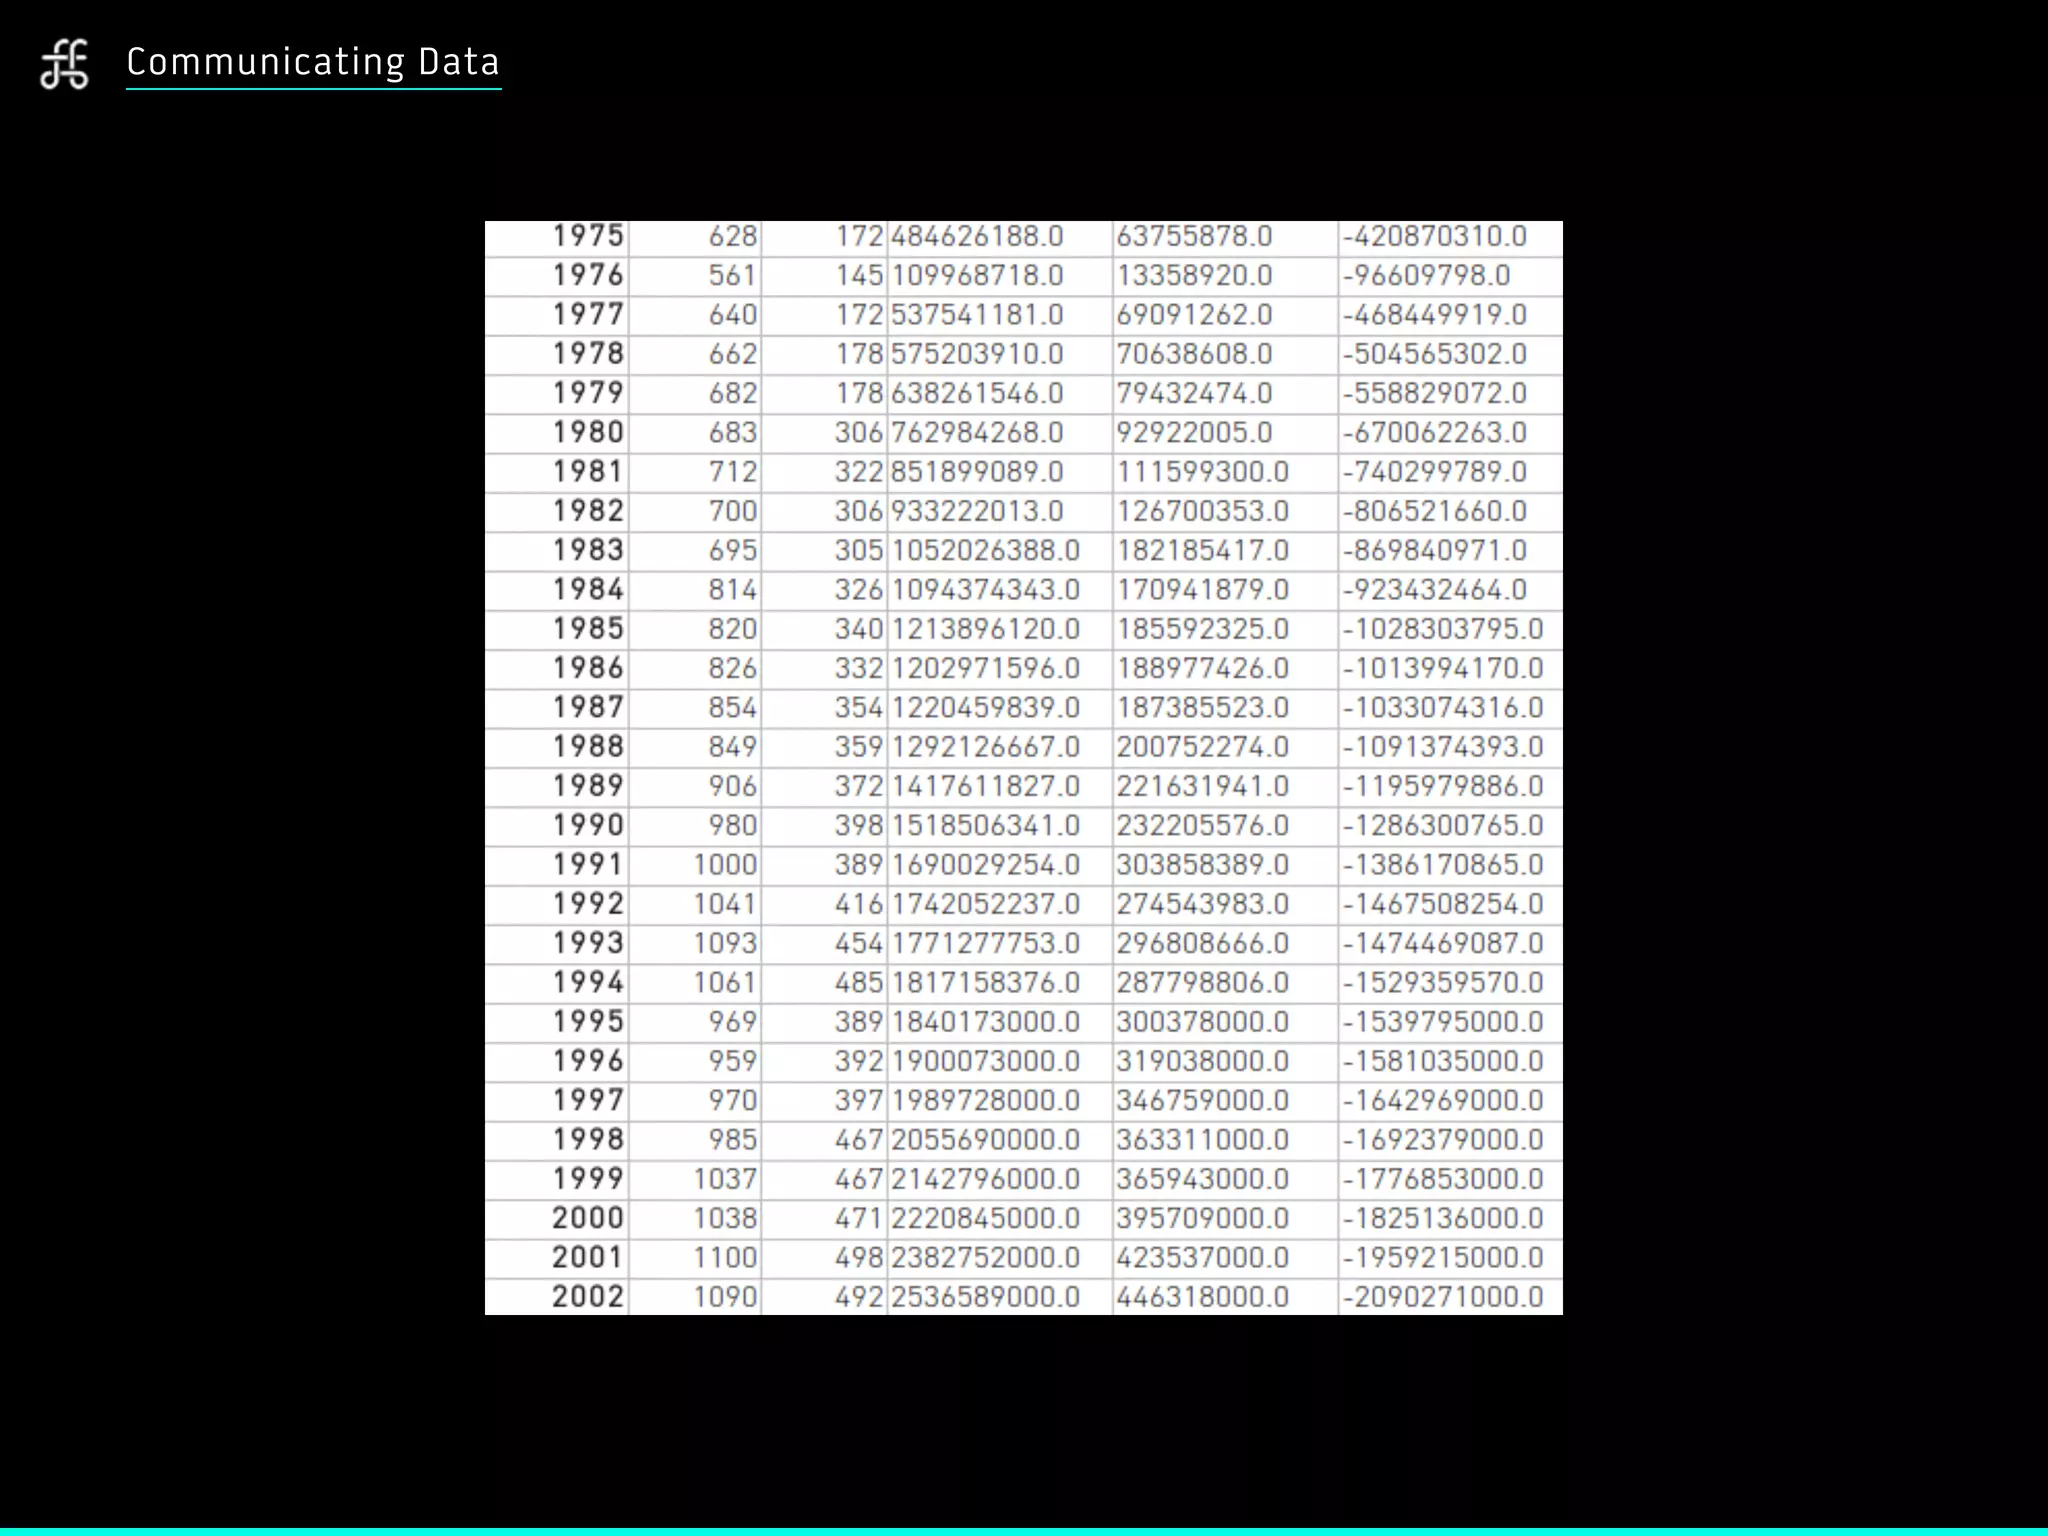
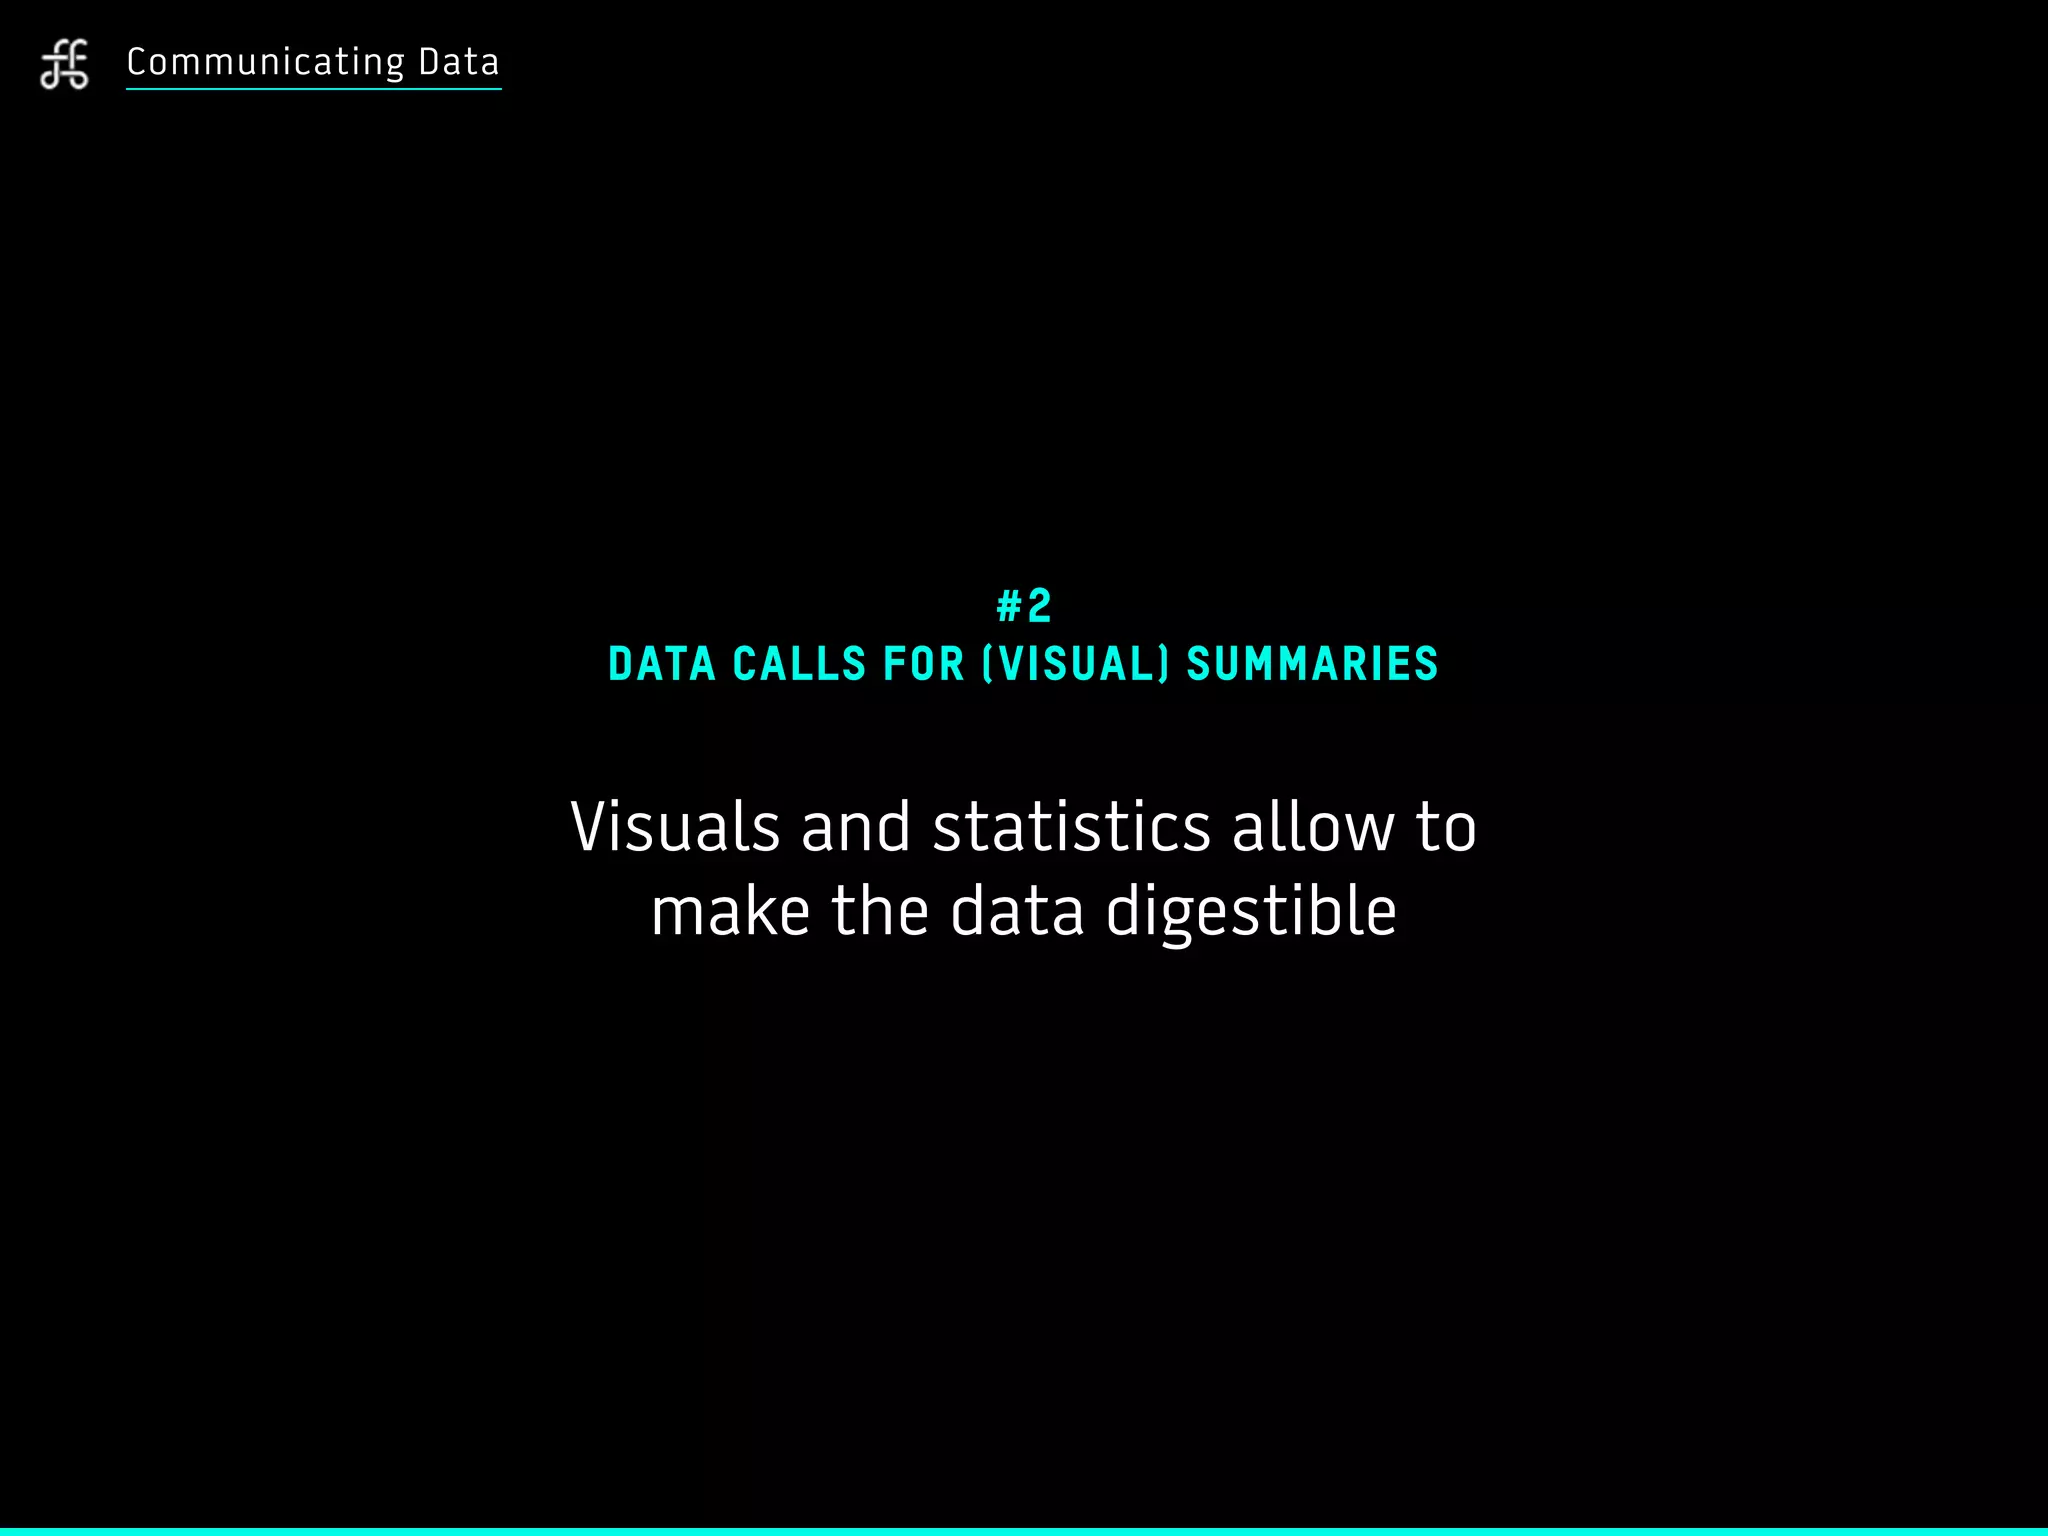
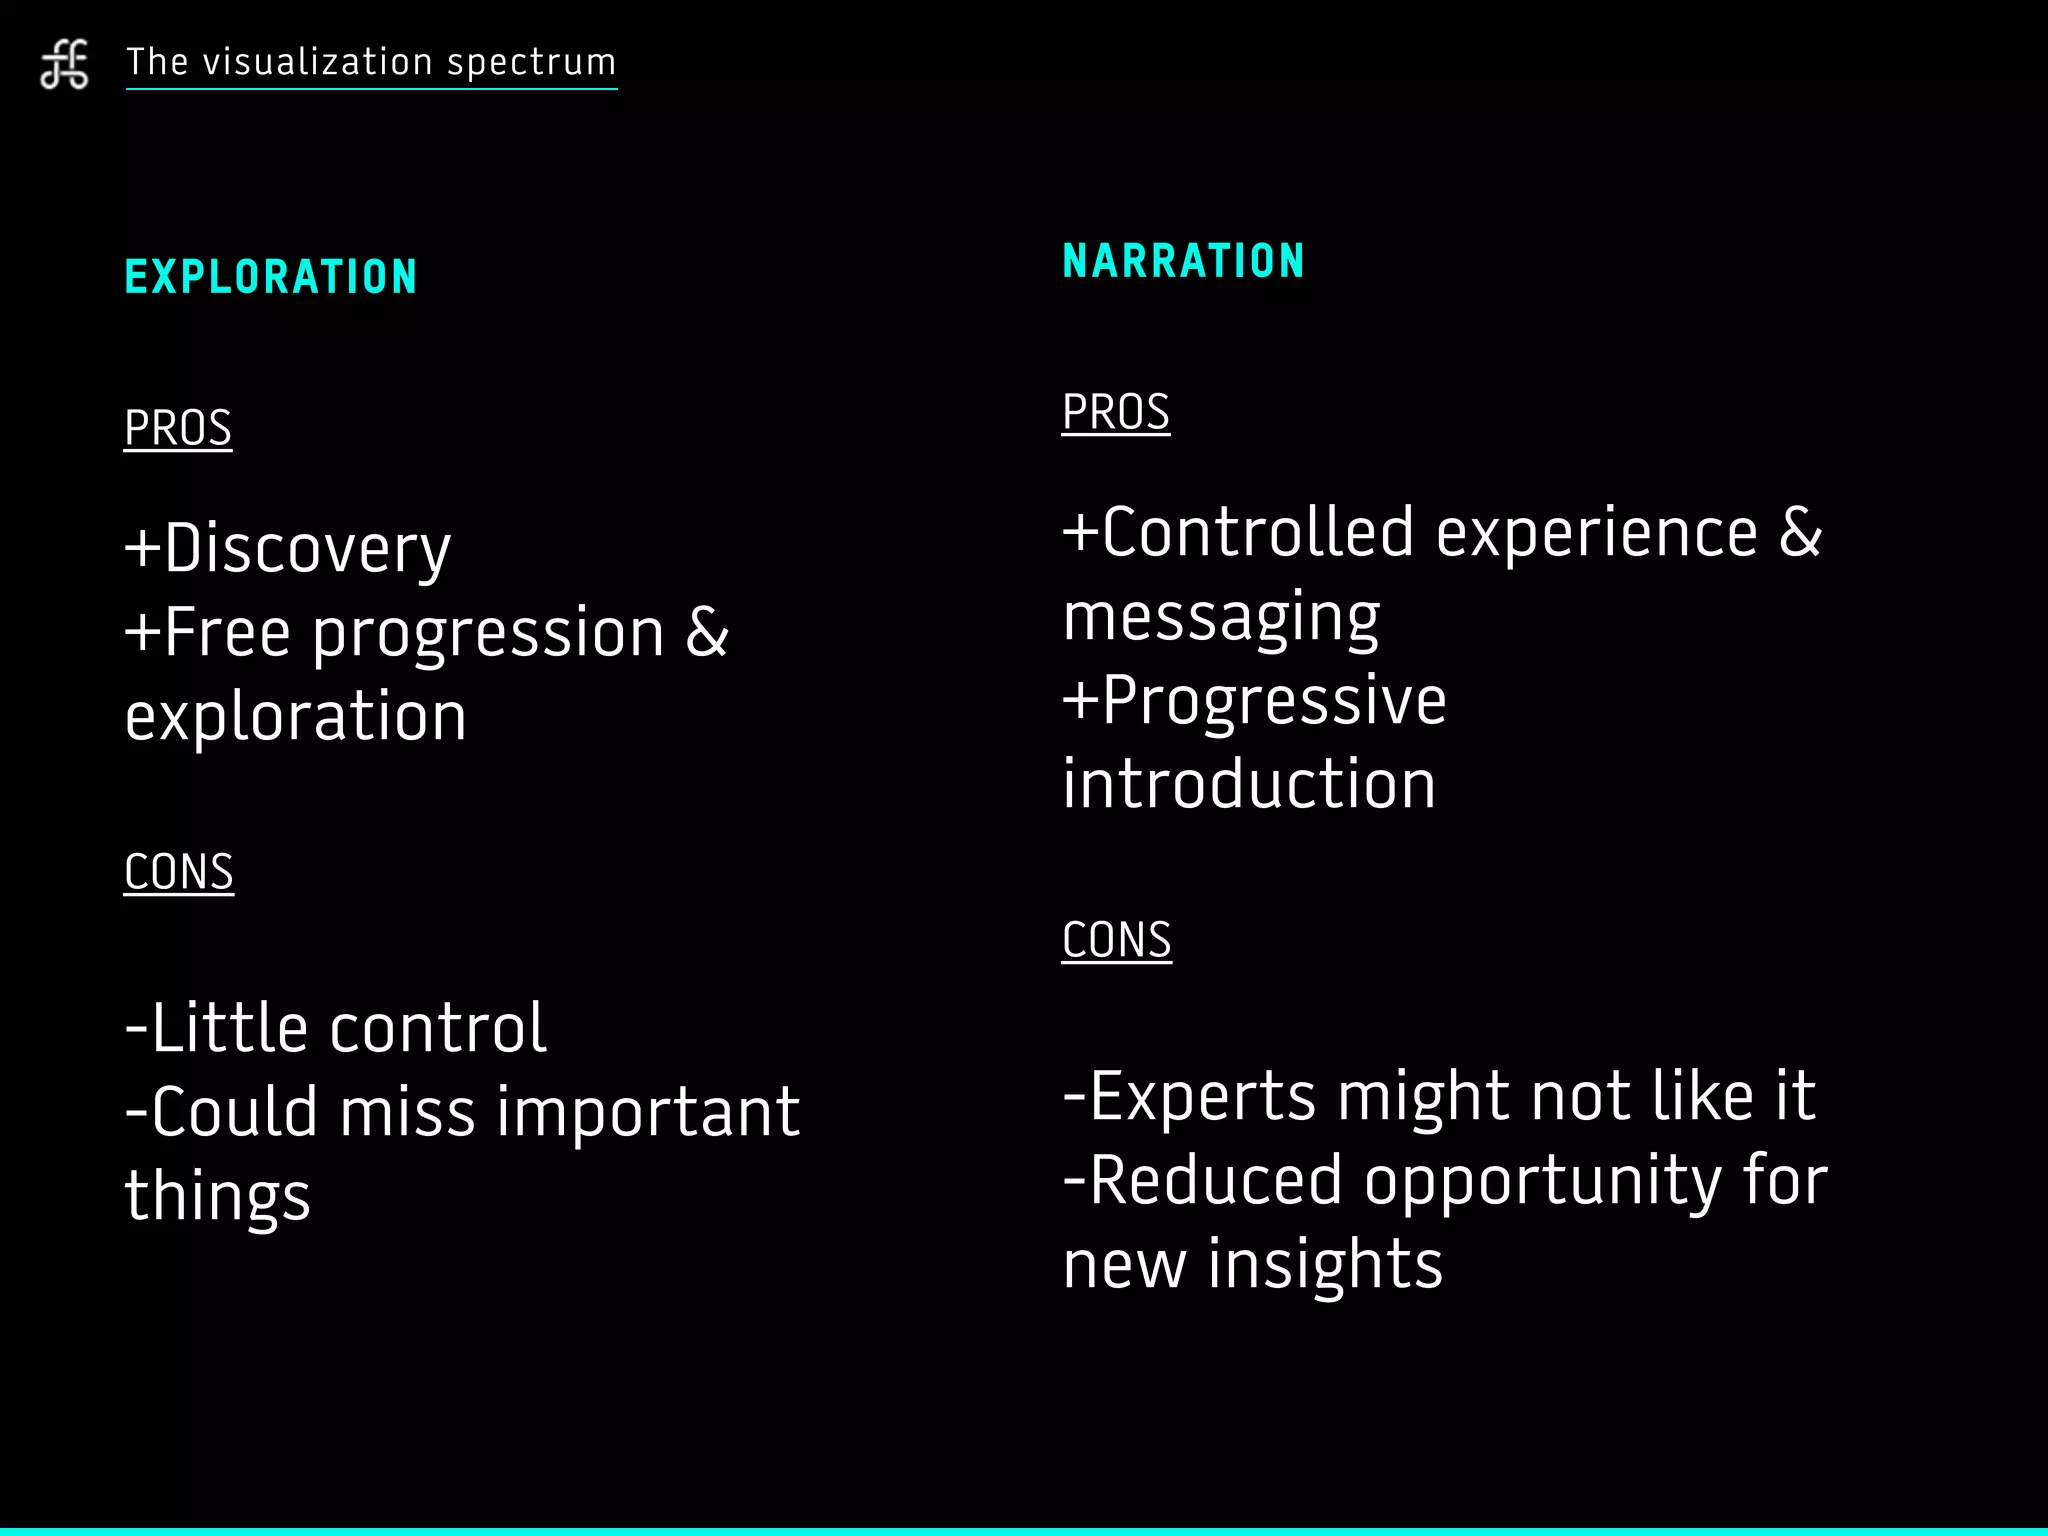
DATA AS A
CREATIVE MATERIAL
FFunction
Sébastien Pierre + Audrée Lapierre
Collide
Halifax, October 23rd, 2014
Information Design & Data
Visualization Studio founded
in 2008
FFunction
Data As a Creative Material
About this talk
Data As a Creative Material
Art Design
Communication
Data As a Creative Material
Thought Experience&
ART & DATA
PART I
Art and Data
Ellsworth Kelly, The Meschers, 1951
(oldest reference in Wikipedia's “generative art” entry)
Art and Data
Frieder Nake, Walk-through-Raster, series 2, 1-4
See 20-20 digital hindsight. Frieder Nake, Walk-through-Raster,
series 2, 1-4, C-type print, Germany, 1966. © artist. Photo: V&A Images.
Art and Data
Ryoji Ikeda, Datatron, 2008
Art and Data
THE PROCESS AND THE RESULT
Automation (in art) was a paradigm
shift. The result is determined by a
process, but unknown to the artist
before the process is complete.
Jared Tarbell, Substrate 2003
Art and Data
Variation in output from Jared Tarbell, Substrate 2003
Art and Data
Jared Tarbell, Orbitals 2004
Art and Data
Jared Tarbell, Invader Fractals 2003
Art and Data
MACHINE CO-CREATION
The result is the act of 

co-creation between the
artists/programmers and 

the machine.
Art and Data
“Set an algorithm
and let it go”
Dextro
turux.org
Art and Data
Subblue, Fractals, www.subblue.com/
Art and Data
Robert Hodgin, Stippling, vimeo.com/8252908
Art and Data
AESTHETICS OF COMPLEXITY
The amount of details permitted
by computers lead to an aesthetics
of complexity.
Art and Data
MACHINE & ORGANICS
Interestingly, some works give the
impression of being the product of
a natural process, reconciling
technology & natural life
Art and Data
Michael Hansmeyer, Digital Grotesque
Art and Data
Christoph Bader,
https://www.flickr.com/photos/deskriptiv
Art and Data
Nervous Systems, Hyphae Lamp
Art and Data
SWAPPING RANDOM NUMBERS FOR DATA
Data is sampled from our
environment. It is a byproduct of
human/natural activity.
Art and Data
Art and Data
Ben Fry, All Streets, 2008
Art and Data
Paul Butler, Visualizing Friendships, 2010
COMPLEX & MEANINGFUL
Data has the same complex quality
as random numbers do, but there
is a potential for meaning &
insights.
Art and Data
A MIRROR OF OURSELVES
As a reflection of ourselves & our
complex social fabric, data adds a
new dimension to the resulting
artwork.
Art and Data
HOW THE DATA
LANDSCAPE EVOLVED
PART II
How the Data Landscape Evolved
1990 2000
2010
Volume of data
Ease of working with data
How the Data Landscape Evolved
Volume of data
Ease of working with data
1990 2000
2010
Random
Numbers
Feeding more numbers
in algorithms to
increase complexity
How the Data Landscape Evolved
Design by Numbers, John Maeda (MIT), Late 90s
How the Data Landscape Evolved
Volume of data
Ease of working with data
1990 2000
2010
Geographic &
Scientific Data
Visuals can be used to
reveal things about our
environment.
How the Data Landscape Evolved
Line Drops, David Endelman, 1997
“The lines in this image are of hundreds of
underground and underwater pipelines that draw oil
from a reservoir in the Huntington Beach area of
California”
How the Data Landscape Evolved
Volume of data
Ease of working with data
1990 2000
2010
Web 2.0
APIs
User-generated is
published en-masse.
Tagging creates new
ways to organize
content. RSS & APIs
made content
machine-accessible.
How the Data Landscape Evolved
Revealicious, Sébastien Pierre, 2005
How the Data Landscape Evolved
Volume of data
Ease of working with data
1990 2000
2010
Social Networks
& Media
Data about large-scale
communities and
conversation is now
available
How the Data Landscape Evolved
Vister, Jeffrey Heer & Danah Boyd, 2005
How the Data Landscape Evolved
Volume of data
Ease of working with data
1990 2000
2010
Open
Data
Citizens can
understand and map
how the governments
work and perform
services.
How the Data Landscape Evolved
DataViva, 2014
How the Data Landscape Evolved
The volume of available data
grew significantly over the
past decade
More Data!
How the Data Landscape Evolved
Data is more accessible (data
portals, APIs) and tools make it
easier to use and visualize.
Easier to access and use
How the Data Landscape Evolved
With social networks, social media and open-
data we have immediate access to a lot of
information to understand our society.
Data to understand 

our society
How the Data Landscape Evolved
With democratization of infographics, data-
journalism & public datasets, data is not reserved
to scientists and specialists anymore.
Data for everyone
COMMUNICATING
DATA
PART III
Similar diversity, Philipp Steinweber & Andreas Koller, 2001
Communicating Data
#
Practical tips
Communicating Data
#1
DATA IS NOT INFORMATION
Data needs context to be
interpreted and turned to
information.
Communicating Data
Communicating Data
#2
DATA CALLS FOR (VISUAL) SUMMARIES
Visuals and statistics allow to
make the data digestible
Communicating Data
#3
DATA = FACTS (FOR A LOT OF PEOPLE
Numbers have an authority that
words don’t have.
Communicating Data
Communicating Data
#4
VISUALS ARE THE MESSAGE
The way you choose to represent
the data defines how people will
read it.
Communicating Data
HEADLINE
“Obama undid the mess left by the previous
administration”
HEADLINE
“Just as many jobs were lost during the Bush years
as during the Obama years”
Communicating Data
#5
DATA MAY NOT MATCH YOUR STORY
Data won’t necessarily tell the
story you would like it to tell (but
you can always tweak the charts)
Communicating Data
#6
DATA OPENS UP DIALOGUE (AND CRITICISM)
As there’s not a single unique way
to interpret data, using data
means you open up to a
conversation.
Communicating Data
Same dataset, three different
interpretations
Data: Spending of the global
middle-class, 2009-2030
Communicating Data
#7
DATA LEADS TO NEW NARRATIVE FORMS
Showing data means that you
won’t be able to explain
everything, and will let some of
the story be written by the reader.
THE VISUALIZATION
SPECTRUM
PART IV
The visualization spectrum
Start Here
The visualization spectrum
Start Here
The visualization spectrum
Exploration Narration
The visualization spectrum
Exploration Narration
The visualization spectrum
Exploration Narration
The visualization spectrum
Exploration Narration
The visualization spectrum
Exploration Narration
The visualization spectrum
EXPLORATION
PROS
+Discovery
+Free progression &
exploration
CONS
-Little control
-Could miss important
things
NARRATION
PROS
+Controlled experience &
messaging
+Progressive
introduction
CONS
-Experts might not like it
-Reduced opportunity for
new insights
DATA VISUALIZATION
FROM
THE TRENCHES
PART V
Data Visualization From the Trenches
National Geographic
Explorers
Database for researchers
National Geographic
projects portfolio
Free exploration for
experts and newcomers
Promote the explorers
Data Visualization From the Trenches
Video of first versions
Where Do 

I Start?
Data Visualization From the Trenches
Where Am I?
nationalgeographic.com/explorers/projects/
Data Visualization From the Trenches
!
Cool visuals are 

not enough
Data Visualization From the Trenches
HP Earth Insights
Data Visualization From the Trenches
The Project
The 16 Earth Insights sites
Analysis
Wildlife Picture Index
Species
Trap camera pictures
of species
1 2 3
From concrete to abstract
Data Visualization From the Trenches
1 2 3
From concrete to abstract
3
earthinsights.org
3
Data Visualization From the Trenches
It’s My Life!
Stop Cancer Before It Starts
Data Visualization From the Trenches
Lay-friendly platform to
complement annual report
Canadian Cancer Society
Interactive Tool
Educate, engage
and empower Canadians
Shareable & asset
for influencers
Data Visualization From the Trenches
Cancer & Me
Why should I care?
The Burden
Canadian cancer %
My Lifestyle
User’s life habits
Prevention messaging
1 2 3
Pledge
Change in Behavior
& Sharing
4
Content & Structure
itsmylife.cancer.ca
Data Visualization From the Trenches
34% were return visitors
Users spent 4:03 perusing the website
26% bounce rate
vs 70% for cancer.ca
20% boost in social media shares
18% pledged to change their behaviour
Data Visualization From the Trenches
WHAT’S NEXT
PART VI
What’s Next
Many Devices,
Many sizes
Desktop, laptop, mobile phone, table and
interactive screens... How do we create
visualizations that work across this wide
range of supports?
What’s Next
How do I relate to the
data, how does it relate
to me?
With some of the novelty wearing out, how
do we make data interesting, and how to we
adapt this data to the user?
Data
You
What’s Next
Quantified Self & Internet
of Things Data
The quantity of data available about us,
individually, is going to increase significantly
with the new breed of devices coming in.
This not only raises design questions, but
ethical questions as well.
What’s Next
What’s Next
Data for Good
With Open Data, citizens can get involved
and use data to influence and change
society. Data can now be use to solve
problems... and maybe help expose
corruption?
What’s Next
Burak Arikan, Networks of Dispossession
http://istanbul-urban-research.blogspot.ca/2014/01/networks-of-dispossession.html
Data as a Creative Material

Data as a Creative Material