Download to read offline

![Collecting Data
“A museum is an exclusive space that brings some things in
and puts some things out. What’s interesting is we don’t
extend [this understanding] to how we define history, to how
we define data, or data sets.” —Sydette Harry
8 Art + Feminism: Careful with Each Other, Dangerous Together](https://image.slidesharecdn.com/finaltoshareunflatteningdata-180424163154/85/eROI-Portland-Design-Week-Unflattering-Data-8-320.jpg)

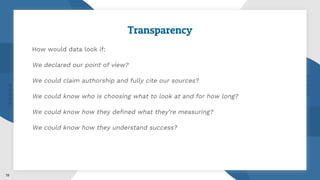


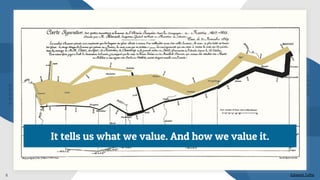
The document explores the complexities of data collection and interpretation, emphasizing that data is influenced by human perspectives and biases. It argues for ethical engagement with data and promotes a collective approach to creating its meaning, including transparency and community building. The text encourages critical reflection on how data is used and calls for a more thoughtful, relational, and patient approach to data science.


