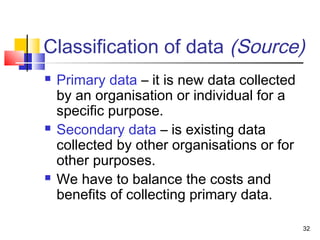
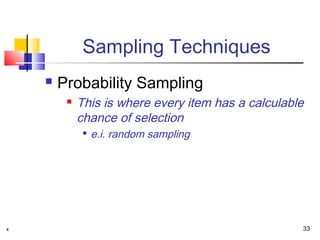
   DATA AND INFORMATION
         GATHERING


                       1
Definitions
   A population consists of all elements –
    individuals, items, or objects – whose
    characteristics are being studied. The
    population that is being studied is also
    called the target population .


                                               2
Population versus sample
   A portion of the population selected for
    study is referred to as a sample .


                                               3
Figure 1.1 Population and sample.

Population
                                    Sample


                                       4
Population vs sample conti…
   A survey that includes every number of
    the population is called a census . The
    technique of collecting information from a
    portion of the population is called a
    sample survey .


                                                 5
Population vs sample conti…
   A sample that represents the
    characteristics of the population as closely
    as possible is called a representative
    sample .


                                                   6
Population vs sample conti…
   A sample drawn in such a way that each
    element of the population has a chance of
    being selected is called a random
    sample


                                                7
Reasons for use of samples
   These are easier, faster, cheaper and
    more convenient than a census.
   A good sample is almost as reliable as a
    census.
   They analyse a representative from the
    population.


                                               8
BASIC TERMS
       Table 1.1 2001 Sales of Seven Ghana Companies
                                      2001 Sales           Variable
                Company            (millions of dollars)
                Wal-Mart Stores           217,799
                IBM                      85,866       An observation
An element or
 a member       General Motors          177,260      or measurement
                Dell Computer            31,168
                Procter & Gamble         39,262
                JC Penney                32,004
                Home Depot               53,553                       9
BASIC TERMS cont.
   Definition
   An element or member of a sample or
    population is a specific subject or object (for
    example, a person, firm, item, state, or
    country) about which the information is
    collected.


                                                      10
BASIC TERMS cont.
   Definition
   A variable is a characteristic under study
    that assumes different values for different
    elements. In contrast to a variable, the
    value of a constant is fixed.


                                                  11
BASIC TERMS cont.
   Definition
   The value of a variable for an element is
    called an observation or measurement .


                                                12
BASIC TERMS cont.
   Definition
   A data set is a collection of observations
    on one or more variables.


                                                 13
Classification of data (Nature)
   Quantitative Variables or data
       Discrete Variables
       Continuous Variables
   Qualitative/Categorical Variables or data


                                                14
Quantitative Variables
   Definition
   A variable that can be measured
    numerically is called a quantitative
    variable . The data collected on a
    quantitative variable are called
    quantitative data .


                                           15
Quantitative Variables cont.
   Definition
   Discrete variable are variables that can
    assume only certain values with no
    intermediate values.


                                               16
Quantitative Variables cont.
   Definition
   A variable that can assume any numerical
    value over a certain interval or intervals is
    called a continuous variable .


                                                    17
Qualitative or Categorical
      Variables
   Definition
   A variable that cannot assume a numerical
    value but can be classified into two or more
    nonnumeric categories is called a
    qualitative or categorical variable . The
    data collected on such a variable are called
    qualitative data .

                                               18
Figure 1.2 Types of variables.


                                 19
Types of Qualitative data collection
                methods
        In-depth interview with:
          individual respondent     Good for
          key informant            exploration
                                     research
          General respondent


                                                  20
Types of Qualitative data collection
                methods
        Group interview in the form of:
          Community meeting
          Focus group discussion

        Participant Observation –
          Direct extensive observation of an
           activity, behaviour or relationship

                                                 21
Qualitative interviews
       Qualitative interviews can be;
        Informal
        conversational                 Usually
        Topic focused                guided by a
                                       checklist
        Semi-structured open ended
         questionnaire


                                              22
Limitations of qualitative
             interviews
   No qualitative data can be generated in a
    way that can provide general estimate
   Cannot use these methods with probability
    samples
   Findings are susceptible to biases which
    can arise out of inaccurate judgments of
    interviewers and interviewees


                                                23
Quantitative methods
   Most widely used method is structured
    survey. Structured Survey entails
    administering a written questionnaire to a
    sample of respondents.
   Structured survey conducted:
       At a point in time
                OR
       At regular intervals (useful for tracking change and
        for collecting flow data)
                                                          24
Advantages of Structured
           Surveys
   Standardized mode of interview & construction of
    questions implies biases introduced by the
    enumerator’s style or respondent’s
    misunderstanding is controlled / minimized

   Sample is usually drawn according to sampling
    theory therefore Sample results can be used to
    derive estimates for the whole population

   Quantitative data may be obtained from secondary
    sources such as records, publications …..

                                                       25
Constraints on options for
        data collections
   Available resources – funding & skills
   Time
   Nature of research (objectives)


                                             26
Classification of data (range)
 Several ways of classifying data
 Nominal Data (Difficult to quantify with

  meaningful units, more qualitative)
 Ordinal Data (measurement is achieved by

  ranking e.g. the use of a 1 to 5 rating scale
  from ‘strongly agree’ to ‘strongly disagree’)
 Cardinal Data (Attributes can be measured ie

  more quantitative eg weight of potatoes)

                                              27
Classification (Time span)
   Cross-Section Data
   Time-Series Data
   Panel data


                             28
Cross-Section Data
   Definition
   Data collected on different elements for the
    same variables for the same period of time
    are called cross-section data .


                                                   29
Time-Series Data
   Definition
   Data collected on the same element for the
    same variables at different points in time or for
     different periods of time are called time-
    series data .


                                                  30
Panel data
   Definition
    Data collected on different elements for
    the same variable at different points in
    time periods are called panel data .


                                           31
Classification of data (Source)
   Primary data – it is new data collected
    by an organisation or individual for a
    specific purpose.
   Secondary data – is existing data
    collected by other organisations or for
    other purposes.
   We have to balance the costs and
    benefits of collecting primary data.

                                              32
Sampling Techniques
       Probability Sampling
            This is where every item has a calculable
             chance of selection
                 e.i. random sampling


4                                                    33
Non-probability Sampling
         This is where someone has some choice
          in who or what is selected
         This would mean that some people or
          organisations had a zero chance of
          selection


4                                                 34
Sampling Techniques
       Informal/non-probability Sampling
           Purposive
           Snow balling
           Systematic
           Stratified
           Quota
           Multi-stage
           Cluster
4                                           35
SAMPLING ERRORS
    Two sources of error
   Non-Sampling error due to:
       Enumeration
       Data input
       Measurement inaccuracy
       Refusal to respond
   Sampling error due to:
       Sample is part of a population and cannot
        perfectly represent the population
       Different samples may produce difference results

                                                           36
SAMPLING ERRORS
   Sampling error is unavoidable
   If Sampling is based on probability theory, the
    sampling error can be calculated.

Total Error = Sampling error + Non - sampling error

                                         SD σ
    Std error of sample estimates → SE =    =
                                          n   n

                                                      37
SAMPLING ERRORS

               σ
   Since SE =
                n
   SE can be reduced by increasing n
   Suppose we want to decrease SE by ½ (50%)


                                                38
SAMPLING ERRORS
        1     1 σ   σ   σ
    Then SE =     =   =
        2     2 n 2 n   4n

   This implies sample size should be increased 4x!
    but the larger the sample, the higher the non-
    sampling error.
   Therefore there is always a trade-off between
    sampling error and non-sampling error.
                                                       39
Steps in data collection

1.   Define the purpose of the        1.   Design a questionnaire or
     data.                                 other method of data
2.   Describe the data you need            collection.
     to achieve this purpose.         2.   Run a pilot study and check
3.   Check available secondary             for problems.
     data and see how useful it is.   3.   Train interviewers, observers
4.   Define the population and             or experimenters.
     sampling frame to give           4.   Do the main data collection.
     primary data.                    5.   Do follow-up, such as
5.   Choose the best sampling              contacting non-respondents.
     method and sample size.          6.    Analyse and present the
6.   Identify an appropriate               results.
     sample.
                                                                           40

Data and information gathering

  • 1.
    DATA AND INFORMATION GATHERING 1
  • 2.
    Definitions  A population consists of all elements – individuals, items, or objects – whose characteristics are being studied. The population that is being studied is also called the target population . 2
  • 3.
    Population versus sample  A portion of the population selected for study is referred to as a sample . 3
  • 4.
    Figure 1.1 Populationand sample. Population Sample 4
  • 5.
    Population vs sampleconti…  A survey that includes every number of the population is called a census . The technique of collecting information from a portion of the population is called a sample survey . 5
  • 6.
    Population vs sampleconti…  A sample that represents the characteristics of the population as closely as possible is called a representative sample . 6
  • 7.
    Population vs sampleconti…  A sample drawn in such a way that each element of the population has a chance of being selected is called a random sample 7
  • 8.
    Reasons for useof samples  These are easier, faster, cheaper and more convenient than a census.  A good sample is almost as reliable as a census.  They analyse a representative from the population. 8
  • 9.
    BASIC TERMS Table 1.1 2001 Sales of Seven Ghana Companies 2001 Sales Variable Company (millions of dollars) Wal-Mart Stores 217,799 IBM 85,866 An observation An element or a member General Motors 177,260 or measurement Dell Computer 31,168 Procter & Gamble 39,262 JC Penney 32,004 Home Depot 53,553 9
  • 10.
    BASIC TERMS cont.  Definition  An element or member of a sample or population is a specific subject or object (for example, a person, firm, item, state, or country) about which the information is collected. 10
  • 11.
    BASIC TERMS cont.  Definition  A variable is a characteristic under study that assumes different values for different elements. In contrast to a variable, the value of a constant is fixed. 11
  • 12.
    BASIC TERMS cont.  Definition  The value of a variable for an element is called an observation or measurement . 12
  • 13.
    BASIC TERMS cont.  Definition  A data set is a collection of observations on one or more variables. 13
  • 14.
    Classification of data(Nature)  Quantitative Variables or data  Discrete Variables  Continuous Variables  Qualitative/Categorical Variables or data 14
  • 15.
    Quantitative Variables  Definition  A variable that can be measured numerically is called a quantitative variable . The data collected on a quantitative variable are called quantitative data . 15
  • 16.
    Quantitative Variables cont.  Definition  Discrete variable are variables that can assume only certain values with no intermediate values. 16
  • 17.
    Quantitative Variables cont.  Definition  A variable that can assume any numerical value over a certain interval or intervals is called a continuous variable . 17
  • 18.
    Qualitative or Categorical Variables  Definition  A variable that cannot assume a numerical value but can be classified into two or more nonnumeric categories is called a qualitative or categorical variable . The data collected on such a variable are called qualitative data . 18
  • 19.
    Figure 1.2 Typesof variables. 19
  • 20.
    Types of Qualitativedata collection methods  In-depth interview with:  individual respondent Good for  key informant exploration research  General respondent 20
  • 21.
    Types of Qualitativedata collection methods  Group interview in the form of:  Community meeting  Focus group discussion  Participant Observation –  Direct extensive observation of an activity, behaviour or relationship 21
  • 22.
    Qualitative interviews  Qualitative interviews can be;  Informal  conversational Usually  Topic focused guided by a checklist  Semi-structured open ended questionnaire 22
  • 23.
    Limitations of qualitative interviews  No qualitative data can be generated in a way that can provide general estimate  Cannot use these methods with probability samples  Findings are susceptible to biases which can arise out of inaccurate judgments of interviewers and interviewees 23
  • 24.
    Quantitative methods  Most widely used method is structured survey. Structured Survey entails administering a written questionnaire to a sample of respondents.  Structured survey conducted:  At a point in time OR  At regular intervals (useful for tracking change and for collecting flow data) 24
  • 25.
    Advantages of Structured Surveys  Standardized mode of interview & construction of questions implies biases introduced by the enumerator’s style or respondent’s misunderstanding is controlled / minimized  Sample is usually drawn according to sampling theory therefore Sample results can be used to derive estimates for the whole population  Quantitative data may be obtained from secondary sources such as records, publications ….. 25
  • 26.
    Constraints on optionsfor data collections  Available resources – funding & skills  Time  Nature of research (objectives) 26
  • 27.
    Classification of data(range) Several ways of classifying data  Nominal Data (Difficult to quantify with meaningful units, more qualitative)  Ordinal Data (measurement is achieved by ranking e.g. the use of a 1 to 5 rating scale from ‘strongly agree’ to ‘strongly disagree’)  Cardinal Data (Attributes can be measured ie more quantitative eg weight of potatoes) 27
  • 28.
    Classification (Time span)  Cross-Section Data  Time-Series Data  Panel data 28
  • 29.
    Cross-Section Data  Definition  Data collected on different elements for the same variables for the same period of time are called cross-section data . 29
  • 30.
    Time-Series Data  Definition  Data collected on the same element for the same variables at different points in time or for different periods of time are called time- series data . 30
  • 31.
    Panel data  Definition Data collected on different elements for the same variable at different points in time periods are called panel data . 31
  • 32.
    Classification of data(Source)  Primary data – it is new data collected by an organisation or individual for a specific purpose.  Secondary data – is existing data collected by other organisations or for other purposes.  We have to balance the costs and benefits of collecting primary data. 32
  • 33.
    Sampling Techniques  Probability Sampling  This is where every item has a calculable chance of selection  e.i. random sampling 4 33
  • 34.
    Non-probability Sampling  This is where someone has some choice in who or what is selected  This would mean that some people or organisations had a zero chance of selection 4 34
  • 35.
    Sampling Techniques  Informal/non-probability Sampling  Purposive  Snow balling  Systematic  Stratified  Quota  Multi-stage  Cluster 4 35
  • 36.
    SAMPLING ERRORS Two sources of error  Non-Sampling error due to:  Enumeration  Data input  Measurement inaccuracy  Refusal to respond  Sampling error due to:  Sample is part of a population and cannot perfectly represent the population  Different samples may produce difference results 36
  • 37.
    SAMPLING ERRORS  Sampling error is unavoidable  If Sampling is based on probability theory, the sampling error can be calculated. Total Error = Sampling error + Non - sampling error SD σ Std error of sample estimates → SE = = n n 37
  • 38.
    SAMPLING ERRORS σ  Since SE = n  SE can be reduced by increasing n  Suppose we want to decrease SE by ½ (50%) 38
  • 39.
    SAMPLING ERRORS 1 1 σ σ σ Then SE = = = 2 2 n 2 n 4n  This implies sample size should be increased 4x! but the larger the sample, the higher the non- sampling error.  Therefore there is always a trade-off between sampling error and non-sampling error. 39
  • 40.
    Steps in datacollection 1. Define the purpose of the 1. Design a questionnaire or data. other method of data 2. Describe the data you need collection. to achieve this purpose. 2. Run a pilot study and check 3. Check available secondary for problems. data and see how useful it is. 3. Train interviewers, observers 4. Define the population and or experimenters. sampling frame to give 4. Do the main data collection. primary data. 5. Do follow-up, such as 5. Choose the best sampling contacting non-respondents. method and sample size. 6. Analyse and present the 6. Identify an appropriate results. sample. 40