1. Time Period: April 16 - September 16
Produced by the Data, Performance & Information Team
Source: Data recorded by Children's Centres via eStart
Dashboard counts the unique individuals attended an event funded by A Better Start AN Other Borough. Beneficiaries are only counted once per workstream/children's centre/programme but otherwise may be duplicated.
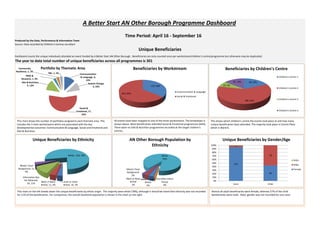
The year to date total number of unique beneficiaries across all programmes is 301
A Better Start AN Other Borough Programme Dashboard
Unique Beneficiaries
58, 19%
186, 60%
23, 7%
45, 14%
Beneficiaries by Children's Centre
Children's Centre 1
Children's Centre 2
Children's Centre 3
Children's Centre 4
All events have been mapped to one of the three workstreams. The breakdown is
shown above. Most beneficiaries attended Social & Emotional programmes (64%).
There were no Diet & Nutrition programmes recorded at the target children's
centres.
This shows which children's centre the events took place at and how many
unique beneficiaries have attended. The majority took place in Centre Place
which is Ward G.
Almost all adult beneficiaries were female, whereas 57% of the child
beneficiaries were male. Note: gender was not recorded for one carer.
This chart on the left breaks down the unique beneficiaries by ethnic origin. The majority were white (78%), although it should be noted that ethnicity was not recorded
for 11% of the beneficiaries. For comparison, the overall Southend population is shown in the chart on the right.
155
60
7
78
0%
10%
20%
30%
40%
50%
60%
70%
80%
90%
100%
Carer Child
Unique Beneficiaries by Gender/Age
NULL
Male
Female
114, 36%
204, 64%
Beneficiaries by Workstream
Communication & Language
Social & Emotional
Asian or Asian
British, 10, 3%
Black or Black
British, 11, 4%
Information Not
Yet Obtained,
34, 11%
Mixed / Dual
Background, 12,
4%
White , 234, 78%
Unique Beneficiaries by Ethnicity
Any Other Ethnic
Group
0%
Asian or Asian
British
4%
Black or Black
British
2%
Mixed / Dual
Background
2%
White
92%
AN Other Borough Population by
Ethnicity
Communication
& Language, 4,
13%
System Change,
3, 10%
Social &
Emotional, 17,
55%
Diet & Nutrition,
4, 13%
PMO &
Research, 1, 3%
Community
Resilience, 1, 3%
TBC, 1, 3%
Portfolio by Thematic Area
This chart shows the number of portfolios assigned to each thematic area. This
includes the 3 main workstreams which are associated with the key
developmental outcomes: Communication & Language, Social and Emotional and
Diet & Nutrition.
2. Time Period: April 16 - September 16
Produced by the Data, Performance & Information Team
A Better Start AN Other Borough Programme Dashboard
103
203
226 237 237
301
34
63 64 66 66
104
162
184 184
248
294 302
0
50
100
150
200
250
300
350
April May June July August September October November December January February March
Number of Unique Beneficiaries (cumulative)
2016/17
2015/16
The cumulative total number of unique beneficiaries for all ABSS events recorded by children's centres in the current financial year is shown above. Figures for the previous financial year are shown on the dotted line.
The chart above shows the number of beneficiaries by the ward they live in. Each bar is broken down down by the number
of people living in each deprivation group. People living in the 0-10% areas (red) are in the most deprived areas in the
country and therefore are a high priority for ABSS.
0.74
1.30
0.87
0.63
4.31
1.18
4.87
1.07
1.45
1.00
0.40
1.32
2.07
2.36
0.53
0.29
2.45
0.00
1.00
2.00
3.00
4.00
5.00
6.00
Ward AWard B Ward CWard DWard E Ward F Ward GWard H Ward I Ward J Ward K Ward L Ward
M
Ward NWard OWard PWard Q
Beneficiary Rate per 1,000 Population
2
22
8
4 3 4 6 4 12 5
24
11 22
4
4
22
2
8 2
9 98
7
8
4
6
12
14
9
5
7
7
10
5 2
18
0
10
20
30
40
50
60
Out of
Area
Ward
A
Ward
B
Ward
C
Ward
D
Ward
E
Ward F Ward
G
Ward
H
Ward I Ward J Ward
K
Ward L Ward
M
Ward
N
Ward
O
Ward
P
Ward
Q
Unique Beneficiaries by Ward/Level of Deprivation
NULL 30%+ 21-30% 11-20% 0-10%
This chart shows the beneficiary rate per 1,000 population by ward of residence. The target wards are highlighted in purple.
Ward E and Ward G have the highest beneficiary rate but Ward P has the lowest of all wards in AN Other Borough.
3. Time Period: April 16 - September 16
Produced by the Data, Performance & Information Team
A Better Start AN Other Borough Programme Dashboard
The charts below show the number of unique beneficiaries of programmes falling within each workstream. The numbers are broken down by programme location (children's centre) and the ward in which the beneficiary lives.
The number of unique beneficiaries for each individual programme is displayed on the right.
Communication & Language - Unique Beneficiaries
Diet & Nutrition - Unique Beneficiaries (No funded programmes recorded by children's centres)
Social & Emotional - Unique Beneficiaries
36
22
16
45
0
10
20
30
40
50
Children's Centre 2 Children's Centre 1 Children's Centre 3 Children's Centre 4
C&L Beneficiaries by Children's Centre
191
64
23
45
0
50
100
150
200
250
Children's Centre 2 Children's Centre 1 Children's Centre 3 Children's Centre 4
D&N Beneficiaries by Children's Centre
155
42
7
0
20
40
60
80
100
120
140
160
180
Children's Centre 2 Children's Centre 1 Children's Centre 3
S&E Beneficiaries by Children's Centre
40
77
0 10 20 30 40 50 60 70 80 90
Help Me to Talk
Let's Talk with your Baby
C&L Beneficiaries by Programme
15
18
40
77
19
7
10
137
0 20 40 60 80 100 120 140 160
Baby & Us
Being a Parent
Help Me to Talk
Let's Talk with your Baby
Mellow Parenting
Incredible Years Parenting
(blank)
Southend Early Autism Support
Active Life Buggy Active Session
D&N Beneficiaries by Programme
15
18
19
7
10
137
0 20 40 60 80 100 120 140 160
Baby & Us
Being a Parent
Mellow Parenting
Incredible Years Parenting
Southend Early Autism Support
Active Life Buggy Active Session
S&E Beneficiaries by Programme
2
5
23
14
27
2
10
19
4
6
2
0
5
10
15
20
25
30
Out of
Area
Ward C Ward E Ward
M
Ward GWard H Ward I Ward NWard KWard QWard D
C&L Beneficiaries by Ward
7
14
9 6
51
12
65
13
17
10
4
15
19
29
5 3
27
0
10
20
30
40
50
60
70
D&N Beneficiaries by Ward
10
7
14
4 4
28
12
38
11
7
10
15
5
10
5 3
21
0
5
10
15
20
25
30
35
40
S&E Beneficiaries by Ward
4. Time Period: April 16 - September 16
Produced by the Data, Performance & Information Team
A Better Start AN Other Borough Programme Dashboard
This is a count of all the attendances at events funded by A Better Start AN Other Borough. Beneficiaries are duplicated if they attended the same programme on more than one date, or if they attended multiple events.
The year to date total number of attendances across all programmes is 979
Total Attendences
361, 37%
618, 63%
Total Attendences by Workstream
Communication & Language
Social & Emotional
46
315
350
84
22
16
129
17
0 50 100 150 200 250 300 350 400
Help Me to Talk
Let's Talk with your Baby
Active Life Buggy Active Session
Baby & Us
Being a Parent
Incredible Years Parenting
Mellow Parenting
Southend Early Autism Support
Communication&
LanguageSocial&Emotional
Total Attendances by Programme
186 175
323
295
0
50
100
150
200
250
300
350
Carer Child Carer Child
Communication & Language Social & Emotional
Total Attendances by Carer/Child
272, 28%
525, 54%
93, 9%
89, 9%
Total Attendances by Children's Centre
Children's Centre 1
Children's Centre 2
Children's Centre 3
Children's Centre 4
Attendances at Social & Emotional events made up 54% of the total to date in
2016/17.
49% of all attendances at ABSS programmes were at Centre Place which is in the
Kursaal ward.
This chart shows the number of attendances per month as a snapshot - the
majority took place in May, followed by a dip in the summer months.
The number of adult and child attendances in each workstream is shown above. The programme which has had the most attendances to date was 'Active Life
Buggy Active', whilst 'Let's Talk with your Baby' has also attracted large numbers.
193
337
258
65
0
126
0
50
100
150
200
250
300
350
400
Apr May Jun Jul Aug Sep
Total Attendances (Monthly Snapshot)
5. Time Period: April 16 - September 16
Produced by the Data, Performance & Information Team
A Better Start AN Other Borough Programme Dashboard
The charts below summarise the number of attendences at workforce training events. This includes duplicates where individuals have attended more than one training session.
The total unique number of workforce develoment training recipients in the year to date is 110, with a total of 191 attendances.
Source: Pre-school Learning Alliance Training Development
Workforce Development
15, 8%
89, 47%
87, 45%
Workforce Development Training Attendees
by Workstream
Communication & Language
Diet & Nutrition
Social & Emotional
74
0
77
28
0
12
0
10
20
30
40
50
60
70
80
90
Apr May Jun Jul Aug Sep
Workforce Development Training
Attendances (monthly snapshot)
57
5
15
12
15
32
10
32
13
0 10 20 30 40 50 60
Children's Oral Health Event
Early Years British Values
Early Years Drugs & Alcohol Awareness
Training
ENCo Training
FRED - Fathers Reading Every Day
HENRY Core Training
Mellow Parenting
Prevent Duty for Managers
Smoking Sensation Training
Workforce Development Training Attendees
by Event
8
6
2
8
7
5
25
18
32
12
8
2
58
0 10 20 30 40 50 60 70
Ward A
Ward B
Ward C
Ward D
Ward E
Ward F
Ward G
Ward H
Ward I
Ward J
Ward K
Ward L
Ward M
Workforce Development Training Attendees
by Ward