Download to read offline
![Previous Next | Top Bottom
D5229/D5229M Test Method for Moisture Absorption Properties and Equilibrium Conditioning of Polymer Matrix Composite Materials
E4 Practices for Force Verification of Testing Machines
E6 Terminology Relating to Methods of Mechanical Testing
E83 Practice for Verification and Classification of Extensometer Systems
E111 Test Method for Young’s Modulus, Tangent Modulus, and Chord Modulus
E122 Practice for Calculating Sample Size to Estimate, With Specified Precision, the Average for a Characteristic of a Lot or Process
E132 Test Method for Poisson’s Ratio at Room Temperature
E177 Practice for Use of the Terms Precision and Bias in ASTM Test Methods
E251 Test Methods for Performance Characteristics of Metallic Bonded Resistance Strain Gages
E456 Terminology Relating to Quality and Statistics
E1012 Practice for Verification of Testing Frame and Specimen Alignment Under Tensile and Compressive Axial Force Application
E1237 Guide for Installing Bonded Resistance Strain Gages
3 | Terminology
3.1 Definitions—Terminology D3878 defines terms relating to high-modulus fibers and their composites. Terminology D883 defines terms relating to
plastics. Terminology E6 defines terms relating to mechanical testing. Terminology E456 and Practice E177 define terms relating to statistics. In the event
of a conflict between terms, Terminology D3878 shall have precedence over the other standards.
3.2 Definitions of Terms Specific to This Standard:
3.2.1 Note—If the term represents a physical quantity, its analytical dimensions are stated immediately following the term (or letter symbol) in fundamental
dimension form, using the following ASTM standard symbology for fundamental dimensions, shown within square brackets: [M] for mass, [L] for length, [T]
for time, [Θ] for thermodynamic temperature, and [ nd] for nondimensional quantities. Use of these symbols is restricted to analytical dimensions when
used with square brackets, as the symbols may have other definitions when used without the brackets.
3.2.2 nominal value, n—a value, existing in name only, assigned to a measurable property for the purpose of convenient designation. Tolerances may be
applied to a nominal value to define an acceptable range for the property.
3.2.3 transition region, n—a strain region of a stress-strain or strain-strain curve over which a significant change in the slope of the curve occurs within a
small strain range.
3.2.4 transition strain, ε [nd], n—the strain value at the mid range of the transition region between the two essentially linear portions of a bilinear
stress-strain or strain-strain curve.
3.2.4.1 Discussion—Many filamentary composite materials show essentially bilinear behavior during force application, such as seen in plots of either
longitudinal stress versus longitudinal strain or transverse strain versus long longitudinal strain. There are varying physical reasons for the existence of a
transition region. Common examples include: matrix cracking under tensile force application and ply delamination.
3.3 Symbols:
A—minimum cross-sectional area of a coupon.
B —percent bending for a uniaxial coupon of rectangular cross section about y axis of the specimen (about the narrow direction).
B —percent bending for a uniaxial coupon of rectangular cross section about z axis of the specimen (about the wide direction).
CV—coefficient of variation statistic of a sample population for a given property (in percent).
E—modulus of elasticity in the test direction.
F —ultimate tensile strength in the test direction.
F —ultimate shear strength in the test direction.
h—coupon thickness.
L —extensometer gage length.
L —minimum required bonded tab length.
n—number of coupons per sample population.
P—force carried by test coupon.
P —force carried by test coupon at failure.
P —maximum force carried by test coupon before failure.
s —standard deviation statistic of a sample population for a given property.
w—coupon width.
x —test result for an individual coupon from the sample population for a given property.
x—mean or average (estimate of mean) of a sample population for a given property.
δ—extensional displacement.
ε—general symbol for strain, whether normal strain or shear strain.
transition
y
z
tu
su
g
min
f
max
n−1
i](https://image.slidesharecdn.com/d3039d3039m-230104131003-2949463a/85/D3039D3039M-11914-2-pdf-2-320.jpg)
![Previous Next | Top Bottom
Previous Next | Top Bottom
Previous Next | Top Bottom
Previous Next | Top Bottom
ε—indicated normal strain from strain transducer or extensometer.
σ—normal stress.
ν—Poisson's ratio.
4 | Summary of Test Method
4.1 A thin flat strip of material having a constant rectangular cross section is mounted in the grips of a mechanical testing machine and monotonically
loaded in tension while recording the force. The ultimate strength of the material can be determined from the maximum force carried before failure. If the
coupon strain is monitored with strain or displacement transducers then the stress-strain response of the material can be determined, from which the
ultimate tensile strain, tensile modulus of elasticity, Poisson's ratio, and transition strain can be derived.
5 | Significance and Use
5.1 This test method is designed to produce tensile property data for material specifications, research and development, quality assurance, and structural
design and analysis. Factors that influence the tensile response and should therefore be reported include the following: material, methods of material
preparation and lay-up, specimen stacking sequence, specimen preparation, specimen conditioning, environment of testing, specimen alignment and
gripping, speed of testing, time at temperature, void content, and volume percent reinforcement. Properties, in the test direction, which may be obtained
from this test method include the following:
5.1.1 Ultimate tensile strength,
5.1.2 Ultimate tensile strain,
5.1.3 Tensile chord modulus of elasticity,
5.1.4 Poisson's ratio, and
5.1.5 Transition strain.
6 | Interferences
6.1 Material and Specimen Preparation—Poor material fabrication practices, lack of control of fiber alignment, and damage induced by improper coupon
machining are known causes of high material data scatter in composites.
6.2 Gripping—A high percentage of grip-induced failures, especially when combined with high material data scatter, is an indicator of specimen gripping
problems. Specimen gripping methods are discussed further in 7.2.4, 8.2, and 11.5.
6.3 System Alignment—Excessive bending will cause premature failure, as well as highly inaccurate modulus of elasticity determination. Every effort
should be made to eliminate excess bending from the test system. Bending may occur as a result of misaligned grips or from specimens themselves if
improperly installed in the grips or out-of-tolerance caused by poor specimen preparation. If there is any doubt as to the alignment inherent in a given test
machine, then the alignment should be checked as discussed in 7.2.5.
6.4 Edge Effects in Angle Ply Laminates—Premature failure and lower stiffnesses are observed as a result of edge softening in laminates containing off-
axis plies. Because of this, the strength and modulus for angle ply laminates can be drastically underestimated. For quasi-isotropic laminates containing
significant 0° plies, the effect is not as significant.
7 | Apparatus
7.1 Micrometers and Calipers—A micrometer with a 4 to 7 mm [0.16 to 0.28 in] nominal diameter ball interface shall be used to measure the specimen
thickness when at least one surface is irregular (such as the bag-side of a laminate). A micrometer with a 4 to 7 mm [0.16 to 0.28 in.] nominal diameter ball
interface or with a flat anvil interface shall be used to measure the specimen thickness when both surfaces are smooth (such as tooled surfaces). A
micrometer or caliper, with a flat anvil interface, shall be used to measure the width of the specimen. The accuracy of the instruments shall be suitable for
reading to within 1% of the sample dimensions. For typical specimen geometries, an instrument with an accuracy of ±0.0025 mm [±0.0001 in.] is adequate
for thickness measurement, while an instrument with an accuracy of ±0.025 mm [±0.001 in.] is adequate for width measurement.
7.2 Testing Machine—The testing machine shall be in conformance with Practices E4 and shall satisfy the following requirements:
7.2.1 Testing Machine Heads—The testing machine shall have both an essentially stationary head and a movable head.
7.2.2 Drive Mechanism—The testing machine drive mechanism shall be capable of imparting to the movable head a controlled velocity with respect to the
stationary head. The velocity of the movable head shall be capable of being regulated as specified in 11.3.
7.2.3 Force Indicator—The testing machine force-sensing device shall be capable of indicating the total force being carried by the test specimen. This
device shall be essentially free from inertia lag at the specified rate of testing and shall indicate the force with an accuracy over the force range(s) of
interest of within ±1% of the indicated value. The force range(s) of interest may be fairly low for modulus evaluation, much higher for strength evaluation,
or both, as required.
NOTE 1: Obtaining precision force data over a large range of interest in the same test, such as when both elastic modulus and ultimate force are being
determined, place extreme requirements on the load cell and its calibration. For some equipment, a special calibration may be required. For some
combinations of material and load cell, simultaneous precision measurement of both elastic modulus and ultimate strength may not be possible and
measurement of modulus and strength may have to be performed in separate tests using a different load cell range for each test.
7.2.4 Grips—Each head of the testing machine shall carry one grip for holding the test specimen so that the direction of force applied to the specimen is
coincident with the longitudinal axis of the specimen. The grips shall apply sufficient lateral pressure to prevent slippage between the grip face and the
coupon. If tabs are used the grips should be long enough that they overhang the beveled portion of the tab by approximately 10 to 15 mm [0.5 in.]. It is
highly desirable to use grips that are rotationally self-aligning to minimize bending stresses in the coupon.
NOTE 2: Grip surfaces that are lightly serrated, approximately 1 serration/mm [25 serrations/in.], have been found satisfactory for use in wedge-action
grips when kept clean and sharp; coarse serrations may produce grip-induced failures in untabbed coupons. Smooth gripping surfaces have been used
successfully with either hydraulic grips or an emery cloth interface, or both.](https://image.slidesharecdn.com/d3039d3039m-230104131003-2949463a/85/D3039D3039M-11914-2-pdf-3-320.jpg)
![7.2.5 System Alignment—Poor system alignment can be a major contributor to premature failure, to elastic property data scatter, or both. Practice E1012
describes bending evaluation guidelines and describes potential sources of misalignment during tensile testing. In addition to Practice E1012, the degree
of bending in a tensile system can also be evaluated using the following related procedure. Specimen bending is considered separately in 11.6.1.
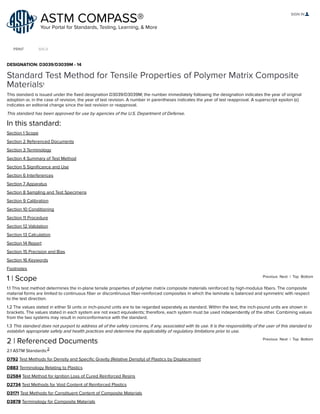
7.2.5.1 A rectangular alignment coupon, preferably similar in size and stiffness to the test specimen of interest, is instrumented with a minimum of three
longitudinal strain gages of similar type, two on the front face across the width and one on the back face of the specimen, as shown in Fig. 1. Any
difference in indicated strain between these gages during loading provides a measure of the amount of bending in the thickness plane (B ) and width
plane (B ) of the coupon. The strain gage location should normally be located in the middle of the coupon gage section (if modulus determination is a
concern), near a grip (if premature grip failures are a problem), or any combination of these areas.
FIG. 1 Gage Locations for System Alignment Check Coupon
S
G
1
S
G
2
S
G
3
SG1
&
SG2
w⁄2
w⁄8
(TYP 2PL)
Front Side
w
7.2.5.2 When evaluating system alignment, it is advisable to perform the alignment check with the same coupon inserted in each of the four possible
installation permutations (described relative to the initial position): initial (top-front facing observer), rotated back to front only (top back facing observer),
rotated end for end only (bottom front facing observer), and rotated both front to back and end to end (bottom back facing observer). These four data sets
provide an indication of whether the bending is due to the system itself or to tolerance in the alignment check coupon or gaging.
7.2.5.3 The zero strain point may be taken either before gripping or after gripping. The strain response of the alignment coupon is subsequently
monitored during the gripping process, the tensile loading process, or both. Eq 1 and Eq 2 use these indicated strains to calculate the ratio of the
percentage of bending strain to average extensional strain for each bending plane of the alignment coupon. Plotting percent bending versus axial
average strain is useful in understanding trends in the bending behavior of the system.
7.2.5.4 Problems with failures during gripping would be reason to examine bending strains during the gripping process in the location near the grip.
Concern over modulus data scatter would be reason to evaluate bending strains over the modulus evaluation force range for the typical transducer
location. Excessive failures near the grips would be reason to evaluate bending strains near the grip at high loading levels. While the maximum advisable
amount of system misalignment is material and location dependent, good testing practice is generally able to limit percent bending to a range of 3 to 5%
at moderate strain levels (>1000 με). A system showing excessive bending for the given application should be readjusted or modified.
where:
B = percent bending about system y axis (about the narrow plane), as calculated by Eq 1, %;
B = percent bending about system z axis (about the wide plane), as calculated by Eq 2, %;
ε , ε , and ε = indicated longitudinal strains displayed by Gages 1, 2, and 3, respectively, of Fig. 1, με; and
ε = ((ε +ε )/2+ε )/2
NOTE 3: Experimental error may be introduced by sources such as poor system alignment, specimen preparation and strain gage precision and
calibration. These sources of error may result in an average calculated strain (ε ) of 0, causing B and B (Eq 1 and Eq 2) to approach infinity as the
average calculated strain is the denominator. To minimize the potential for this occurrence during system alignment evaluation, it is recommended that
force be applied to the alignment coupon until all three strain gages measure positive strain of no less than 500 με with an ε of no less than 1000 με. If
these conditions can not be met, the test configuration should be adjusted prior to performing further system alignment evaluation.
7.3 Strain-Indicating Device—Force-strain data, if required, shall be determined by means of either a strain transducer or an extensometer. Attachment of
the strain-indicating device to the coupon shall not cause damage to the specimen surface. If Poisson's ratio is to be determined, the specimen shall be
instrumented to measure strain in both longitudinal and lateral directions. If the modulus of elasticity is to be determined, the longitudinal strain should be
simultaneously measured on opposite faces of the specimen to allow for a correction as a result of any bending of the specimen (see 11.6 for further
guidance).
7.3.1 Bonded Resistance Strain Gage Selection—Strain gage selection is a compromise based on the type of material. An active gage length of 6 mm [0.25
in.] is recommended for most materials. Active gage lengths should not be less than 3 mm [0.125 in.]. Gage calibration certification shall comply with Test
Methods E251. When testing woven fabric laminates, gage selection should consider the use of an active gage length that is at least as great as the
characteristic repeating unit of the weave. Some guidelines on the use of strain gages on composites follow. A general reference on the subject is Tuttle
and Brinson.
7.3.1.1 Surface preparation of fiber-reinforced composites in accordance with Practice E1237 can penetrate the matrix material and cause damage to the
reinforcing fibers resulting in improper coupon failures. Reinforcing fibers should not be exposed or damaged during the surface preparation process. The
strain gage manufacturer should be consulted regarding surface preparation guidelines and recommended bonding agents for composites pending the
development of a set of standard practices for strain gage installation surface preparation of fiber-reinforced composite materials.
y
z
y
z
1 2 3
ave 1 2 3
ave y z
ave
3
4](https://image.slidesharecdn.com/d3039d3039m-230104131003-2949463a/85/D3039D3039M-11914-2-pdf-4-320.jpg)
![Previous Next | Top Bottom
7.3.1.2 Consideration should be given to the selection of gages having larger resistances to reduce heating effects on low-conductivity materials.
Resistances of 350 Ω or higher are preferred. Additional consideration should be given to the use of the minimum possible gage excitation voltage
consistent with the desired accuracy (1 to 2 V is recommended) to reduce further the power consumed by the gage. Heating of the coupon by the gage
may affect the performance of the material directly, or it may affect the indicated strain as a result of a difference between the gage temperature
compensation factor and the coefficient of thermal expansion of the coupon material.
7.3.1.3 Consideration of some form of temperature compensation is recommended, even when testing at standard laboratory atmosphere. Temperature
compensation is required when testing in nonambient temperature environments.
7.3.1.4 Consideration should be given to the transverse sensitivity of the selected strain gage. The strain gage manufacturer should be consulted for
recommendations on transverse sensitivity corrections and effects on composites. This is particularly important for a transversely mounted gage used to
determine Poisson's ratio, as discussed in Note 13.
7.3.2 Extensometers—For most purposes, the extensometer gage length should be in the range of 10 to 50 mm [0.5 to 2.0 in.]. Extensometers shall satisfy,
at a minimum, Practice E83, Class B-1 requirements for the strain range of interest and shall be calibrated over that strain range in accordance with
Practice E83. For extremely stiff materials, or for measurement of transverse strains, the fixed error allowed by Class B-1 extensometers may be
significant, in which case Class A extensometers should be considered. The extensometer shall be essentially free of inertia lag at the specified speed of
testing, and the weight of the extensometer should not induce bending strains greater than those allowed in 6.3.
NOTE 4: It is generally less difficult to perform strain calibration on extensometers of longer gage length as less precision in displacement is required of
the extensometer calibration device.
7.4 Conditioning Chamber—When conditioning materials at nonlaboratory environments, a temperature/vaporlevel-controlled environmental conditioning
chamber is required that shall be capable of maintaining the required temperature to within ±3°C [±5°F] and the required relative vapor level to within ±3%.
Chamber conditions shall be monitored either on an automated continuous basis or on a manual basis at regular intervals.
7.5 Environmental Test Chamber—An environmental test chamber is required for test environments other than ambient testing laboratory conditions. This
chamber shall be capable of maintaining the gage section of the test specimen at the required test environment during the mechanical test.
8 | Sampling and Test Specimens
8.1 Sampling—Test at least five specimens per test condition unless valid results can be gained through the use of fewer specimens, such as in the case of
a designed experiment. For statistically significant data, the procedures outlined in Practice E122 should be consulted. Report the method of sampling.
NOTE 5: If specimens are to undergo environmental conditioning to equilibrium, and are of such type or geometry that the weight change of the material
cannot be properly measured by weighing the specimen itself (such as a tabbed mechanical coupon), then use another traveler coupon of the same
nominal thickness and appropriate size (but without tabs) to determine when equilibrium has been reached for the specimens being conditioned.
8.2 Geometry—Design of mechanical test coupons, especially those using end tabs, remains to a large extent an art rather than a science, with no
industry consensus on how to approach the engineering of the gripping interface. Each major composite testing laboratory has developed gripping
methods for the specific material systems and environments commonly encountered within that laboratory. Comparison of these methods shows them to
differ widely, making it extremely difficult to recommend a universally useful approach or set of approaches. Because of this difficulty, definition of the
geometry of the test coupon is broken down into the following three levels, which are discussed further in each appropriate section:
Purpose Degree of Geometry Definition
8.2.1 General Requirements Mandatory Shape and Tolerances
8.2.2 Specific Recommendations Nonmandatory Suggested Dimensions
8.2.3 Detailed Examples Nonmandatory Typical Practices
8.2.1 General Requirements:
8.2.1.1 Shape, Dimensions, and Tolerances—The complete list of requirements for specimen shape, dimensions, and tolerances is shown in Table 1.
TABLE 1 Tensile Specimen Geometry Requirements
Parameter Requirement
Coupon Requirements:
shape constant rectangular cross-section
minimum length gripping+2 times width+gage length
specimen width as needed
specimen width tolerance ±1% of width
specimen thickness as needed
specimen thickness tolerance ±4% of thickness
specimen flatness flat with light finger pressure
Tab Requirements (if used):
tab material as needed
fiber orientation (composite tabs) as needed
tab thickness as needed
tab thickness variation between tabs ±1% tab thickness
A](https://image.slidesharecdn.com/d3039d3039m-230104131003-2949463a/85/D3039D3039M-11914-2-pdf-5-320.jpg)
![Parameter Requirement
tab bevel angle 5 to 90°, inclusive
tab step at bevel to specimen feathered without damaging specimen
(A) See 8.2.2 or Table 2 for recommendations.
8.2.1.2 Use of Tabs—Tabs are not required. The key factor in the selection of specimen tolerances and gripping methods is the successful introduction of
force into the specimen and the prevention of premature failure as a result of a significant discontinuity. Therefore, determine the need to use tabs, and
specification of the major tab design parameters, by the end result: acceptable failure mode and location. If acceptable failure modes occur with
reasonable frequency, then there is no reason to change a given gripping method.
8.2.2 Specific Recommendations:
8.2.2.1 Width, Thickness, and Length—Select the specimen width and thickness to promote failure in the gage section and assure that the specimen
contains a sufficient number of fibers in the cross section to be statistically representative of the bulk material. The specimen length should normally be
substantially longer than the minimum requirement to minimize bending stresses caused by minor grip eccentricities. Keep the gage section as far from
the grips as reasonably possible and provide a significant amount of material under stress and therefore produce a more statistically significant result. The
minimum requirements for specimen design shown in Table 1 are by themselves insufficient to create a properly dimensioned and toleranced coupon
drawing. Therefore, recommendations on other important dimensions are provided for typical material configurations in Table 2. These geometries have
been found by a number of testing laboratories to produce acceptable failure modes on a wide variety of material systems, but use of them does not
guarantee success for every existing or future material system.
TABLE 2 Tensile Specimen Geometry Recommendations
Fiber
Orientation
Width,
mm [in.]
Overall Length,
mm [in.]
Thickness,
mm [in.]
Tab Length,
mm [in.]
Tab Thickness,
mm [in.]
Tab Bevel
Angle,°
0° unidirectional 15 [0.5] 250 [10.0] 1.0 [0.040] 56 [2.25] 1.5 [0.062] 7 or 90
90° unidirectional 25 [1.0] 175 [ 7.0] 2.0 [0.080] 25 [1.0] 1.5 [0.062] 90
balanced and symmetric 25 [1.0] 250 [10.0] 2.5 [0.100] emery cloth — —
random-discontinuous 25 [1.0] 250 [10.0] 2.5 [0.100] emery cloth — —
(A) Dimensions in this table and the tolerances of Fig. 2 or Fig. 3 are recommendations only and may be varied so long as the requirements of Table 1 are
met.
8.2.2.2 Gripping/Use of Tabs—There are many material configurations, such as multidirectional laminates, fabric-based materials, or randomly reinforced
sheet-molding compounds, which can be successfully tested without tabs. However, tabs are strongly recommended when testing unidirectional
materials (or strongly unidirectionally dominated laminates) to failure in the fiber direction. Tabs may also be required when testing unidirectional materials
in the matrix direction to prevent gripping damage.
8.2.2.3 Tab Geometry—Recommendations on important dimensions are provided for typical material configurations in Table 2. These dimensions have
been found by a number of testing laboratories to produce acceptable failure modes on a wide variety of material systems, but use of them does not
guarantee success for every existing or future material system. The selection of a tab configuration that can successfully produce a gage section tensile
failure is dependent upon the coupon material, coupon ply orientation, and the type of grips being used. When pressure-operated nonwedge grips are
used with care, squared-off 90° tabs have been used successfully. Wedge-operated grips have been used most successfully with tabs having low bevel
angles (7 to 10°) and a feathered smooth transition into the coupon. For alignment purposes, it is essential that the tabs be of matched thickness.
8.2.2.4 Friction Tabs—Tabs need not always be bonded to the material under test to be effective in introducing the force into the specimen. Friction tabs,
essentially nonbonded tabs held in place by the pressure of the grip, and often used with emery cloth or some other light abrasive between the tab and
the coupon, have been successfully used in some applications. In specific cases, lightly serrated wedge grips (see Note 2) have been successfully used
with only emery cloth as the interface between the grip and the coupon. However, the abrasive used must be able to withstand significant compressive
forces. Some types of emery cloth have been found ineffective in this application because of disintegration of the abrasive.
8.2.2.5 Tab Material—The most consistently used bonded tab material has been continuous E-glass fiber-reinforced polymer matrix materials (woven or
unwoven) in a [0/90]ns laminate configuration. The tab material is commonly applied at 45° to the force direction to provide a soft interface. Other
configurations that have reportedly been successfully used have incorporated steel tabs or tabs made of the same material as is being tested.
8.2.2.6 Bonded Tab Length—When using bonded tabs, estimate the minimum suggested tab length for bonded tabs by the following simple equation. As
this equation does not account for the peaking stresses that are known to exist at the ends of bonded joints. The tab length calculated by this equation
should normally be increased by some factor to reduce the chances of joint failure:
where:
L = minimum required bonded tab length, mm [in.];
F = ultimate tensile strength of coupon material, MPa [psi];
h = coupon thickness, mm [in.]; and
F = ultimate shear strength of adhesive, coupon material, or tab material (whichever is lowest), MPa [psi].
8.2.2.7 Bonded Tab Adhesive—Any high-elongation (tough) adhesive system that meets the environmental requirements may be used when bonding tabs
to the material under test. A uniform bondline of minimum thickness is desirable to reduce undesirable stresses in the assembly.
A
min
tu
su](https://image.slidesharecdn.com/d3039d3039m-230104131003-2949463a/85/D3039D3039M-11914-2-pdf-6-320.jpg)

![Previous Next | Top Bottom
10.1 The recommended pre-test condition is effective moisture equilibrium at a specific relative humidity as established by Test
Method D5229/D5229M; however, if the test requestor does not explicitly specify a pre-test conditioning environment, no conditioning is required and
the test specimens may be tested as prepared.
10.2 The pre-test specimen conditioning process, to include specified environmental exposure levels and resulting moisture content, shall be reported
with the test data.
NOTE 6: The term moisture, as used in Test Method D5229/D5229M, includes not only the vapor of a liquid and its condensate, but the liquid itself in
large quantities, as for immersion.
10.3 If no explicit conditioning process is performed, the specimen conditioning process shall be reported as “unconditioned” and the moisture content as
“unknown.”
11 | Procedure
11.1 Parameters To Be Specified Before Test:
11.1.1 The tension specimen sampling method, coupon type and geometry, and conditioning travelers (if required).
11.1.2 The tensile properties and data reporting format desired.
NOTE 7: Determine specific material property, accuracy, and data reporting requirements before test for proper selection of instrumentation and data-
recording equipment. Estimate operating stress and strain levels to aid in transducer selection, calibration of equipment, and determination of equipment
settings.
11.1.3 The environmental conditioning test parameters.
11.1.4 If performed, the sampling method, coupon geometry, and test parameters used to determine density and reinforcement volume.
11.2 General Instructions:
11.2.1 Report any deviations from this test method, whether intentional or inadvertent.
11.2.2 If specific gravity, density, reinforcement volume, or void volume are to be reported, then obtain these samples from the same panels being tension
tested. Specific gravity and density may be evaluated by means of Test Methods D792. Volume percent of the constituents may be evaluated by one of
the matrix digestion procedures of Test Method D3171, or, for certain reinforcement materials such as glass and ceramics, by the matrix burn-off technique
of Test Method D2584. The void content equations of Test Methods D2734 are applicable to both Test Method D2584 and the matrix digestion
procedures.
11.2.3 Following final specimen machining and any conditioning, but before the tension testing, determine the specimen area as A=w×h, at three places in
the gage section, and report the area as the average of these three determinations to the accuracy in 7.1. Record the average area in units of mm (in. ).
11.3 Speed of Testing—Set the speed of testing to effect a nearly constant strain rate in the gage section. If strain control is not available on the testing
machine, this may be approximated by repeated monitoring and adjusting of the rate of force application to maintain a nearly constant strain rate, as
measured by strain transducer response versus time. The strain rate should be selected so as to produce failure within 1 to 10 min. If the ultimate strain of
the material cannot be reasonably estimated, initial trials should be conducted using standard speeds until the ultimate strain of the material and the
compliance of the system are known, and the strain rate can be adjusted. The suggested standard speeds are:
11.3.1 Strain-Controlled Tests—A standard strain rate of 0.01 min .
11.3.2 Constant Head-Speed Tests—A standard head displacement rate of 2 mm/min [0.05 in./min].
NOTE 8: Use of a fixed head speed in testing machine systems with a high compliance may result in a strain rate that is much lower than required. Use of
wedge grips can cause extreme compliance in the system, especially when using compliant tab materials. In some such cases, actual strain rates 10 to 50
times lower than estimated by head speeds have been observed.
11.4 Test Environment—Condition the specimen to the desired moisture profile and, if possible, test under the same conditioning fluid exposure level.
However, cases such as elevated temperature testing of a moist specimen place unrealistic requirements on the capabilities of common testing machine
environmental chambers. In such cases, the mechanical test environment may need to be modified, for example, by testing at elevated temperature with
no fluid exposure control, but with a specified limit on time to failure from withdrawal from the conditioning chamber. Modifications to the test environment
shall be recorded. In the case where there is no fluid exposure control, the percentage moisture loss of the specimen prior to test completion may be
estimated by placing a conditioned traveler coupon of known weight within the test chamber at the same time as the specimen is placed in the chamber.
Upon completion of the test, the traveler coupon is removed from the chamber, weighed, and the percentage weight calculated and reported.
11.4.1 Store the specimen in the conditioned environment until test time, if the testing area environment is different than the conditioning environment.
11.5 Specimen Insertion—Place the specimen in the grips of the testing machine, taking care to align the long axis of the gripped specimen with the test
direction. Tighten the grips, recording the pressure used on pressure controllable (hydraulic or pneumatic) grips.
NOTE 9: The ends of the grip jaws on wedge-type grips should be even with each other following insertion to avoid inducing a bending moment that
results in premature failure of the specimen at the grip. When using untabbed specimens, a folded strip of medium grade (80 to 150 grit) emery cloth
between the specimen faces and the grip jaws (grit-side toward specimen) provides a nonslip grip on the specimen without jaw serration damage to the
surface of the specimen. When using tabbed specimens, insert the coupon so that the grip jaws extend approximately 10 to 15 mm [0.5 in.] past the
beginning of the tapered portion of the tab. Coupons having tabs that extend beyond the grips are prone to failure at the tab ends because of excessive
interlaminar stresses.
11.6 Transducer Installation—If strain response is to be determined attach the strain-indication transducer(s) to the specimen, symmetrically about the mid-
span, mid-width location. Attach the strain-recording instrumentation to the transducers on the specimen.
11.6.1 When determining modulus of elasticity, it is recommended that at least one specimen per like sample be evaluated with back-to-back axial
transducers to evaluate the percent bending, using Eq 4, at the average axial strain checkpoint value (the mid range of the appropriate chord modulus
strain range) shown in Table 3. A single transducer can be used if the percent bending is no more than 3%. When bending is greater than 3% averaged
2 2
−1](https://image.slidesharecdn.com/d3039d3039m-230104131003-2949463a/85/D3039D3039M-11914-2-pdf-8-320.jpg)
![Previous Next | Top Bottom
13 | Calculation
13.1 Tensile Stress/Tensile Strength—Calculate the ultimate tensile strength using Eq 5 and report the results to three significant figures. If the tensile
modulus is to be calculated, determine the tensile stress at each required data point using Eq 6.
where:
F = ultimate tensile strength, MPa [psi];
P = maximum force before failure, N [lbf];
σ = tensile stress at ith data point, MPa [psi];
P = force at ith data point, N [lbf]; and
A = average cross-sectional area from 11.2.3, mm [in. ].
13.2 Tensile Strain/Ultimate Tensile Strain—If tensile modulus or ultimate tensile strain is to be calculated, and material response is being determined by an
extensometer, determine the tensile strain from the indicated displacement at each required data point using Eq 7 and report the results to three
significant figures.
where:
ε = tensile strain at ith data point, με;
δ = extensometer displacement at ith data point, mm [in.]; and
L = extensometer gage length, mm [in.].
13.3 Tensile Modulus of Elasticity:
NOTE 11: To minimize potential effects of bending it is recommended that the strain data used for modulus of elasticity determination be the average of
the indicated strains from each side of the specimen, as discussed in 7.3 and 11.6.
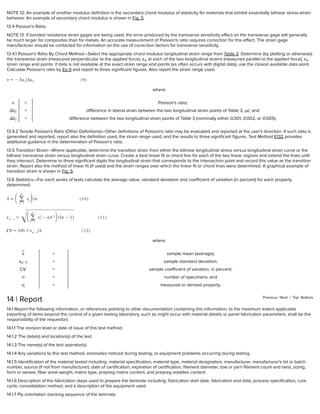
13.3.1 Tensile Chord Modulus of Elasticity—Select the appropriate chord modulus strain range from Table 3. Calculate the tensile chord modulus of
elasticity from the stress-strain data using Eq 8. If data is not available at the exact strain range end points (as often occurs with digital data), use the
closest available data point. Report the tensile chord modulus of elasticity to three significant figures. Also report the strain range used in the calculation.
A graphical example of chord modulus is shown in Fig. 5.
FIG. 5 Typical Tensile Stress-Strain Curves
0
0
5000
Strain ( ε)
10000
300
600
S
t
r
e
s
s
(MPa)
Ultimate
Example of Linear Response
Example of Bilinear Response
Transition Point
Ultimate
Chord Modulus
Region
13.3.1.1 The tabulated strain ranges should only be used for materials that do not exhibit a transition region (a significant change in the slope of the stress-
strain curve) within the given strain range. If a transition region occurs within the recommended strain range, then a more suitable strain range shall be
used and reported.
where:
E = tensile chord modulus of elasticity, GPa [psi];
Δσ = difference in applied tensile stress between the two strain points of Table 3, MPa [psi]; and
Δε = difference between the two strain points of Table 3 (nominally 0.002).
13.3.2 Tensile Modulus of Elasticity (Other Definitions)—Other definitions of elastic modulus may be evaluated and reported at the user's discretion. If such
data is generated and reported, report also the definition used, the strain range used, and the results to three significant figures. Test Method E111
provides additional guidance in the determination of modulus of elasticity.
tu
max
i
i
2 2
i
i
g
chord](https://image.slidesharecdn.com/d3039d3039m-230104131003-2949463a/85/D3039D3039M-11914-2-pdf-10-320.jpg)


This document describes a standard test method for determining the tensile properties of polymer matrix composite materials reinforced with high-modulus fibers. The test method involves mounting a thin flat composite strip in the grips of a mechanical testing machine and applying a tensile load while recording the force and strain. Properties that can be determined include ultimate tensile strength, ultimate tensile strain, tensile modulus of elasticity, Poisson's ratio, and transition strain. Factors that can influence the tensile response such as material, specimen preparation and conditioning, testing environment and method are also discussed.