Download as PDF, PPTX

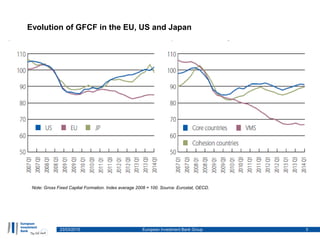
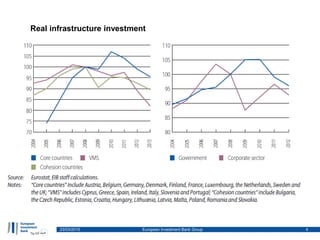
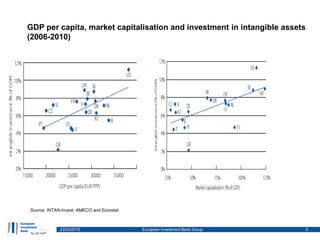
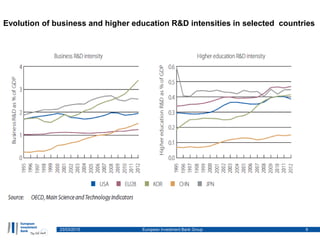
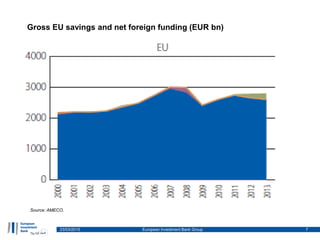
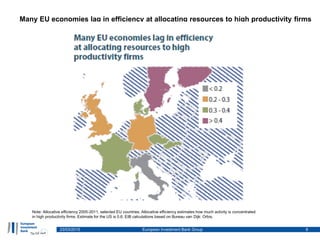
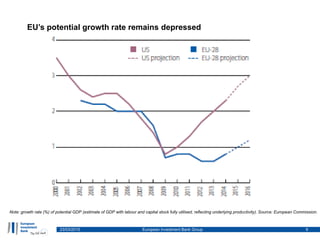
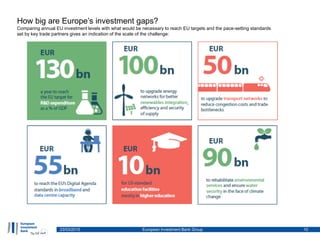


The document discusses investment gaps and competitiveness in the EU, emphasizing the challenges of allocating resources efficiently to high productivity firms. It compares current EU investment levels with necessary targets and highlights the depressed potential growth rate of the EU's GDP. The report contains data from various sources, including Eurostat and OECD, and provides contact details for European Investment Bank representatives.


