Download to read offline


![• Implications:
– Intergenerational transfer
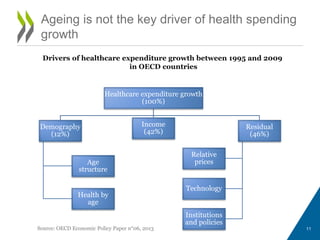
– As ageing is not the driver, so we cannot ‘ride out’
health spending by letting budgets run into deficit
– The policy challenges are relative budget priority, the
boundaries of financing, and productivity
What do we mean by fiscal
sustainability?
12
IMF: The capacity of a
government, at least in the
future, to finance its desired
expenditure programs, to
service any debt obligations
[…] and to ensure its solvency.
EU: This considers the ability of the
government to meet the costs of its current
and future debt through future revenues
(Indicator S1). The finite version of the budget
constraint is assessed with reference to a
target date of 2030 and a target level of debt
of 60 % of GDP (Indicator S2)](https://image.slidesharecdn.com/d1-am-session1-ankitkumar-oecd-140430045526-phpapp01/85/DELSA-GOV-Health-Session-1-Ankit-Kumar-oecd-12-320.jpg)
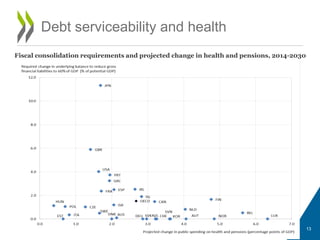
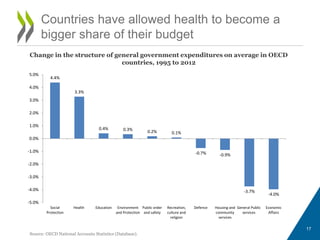
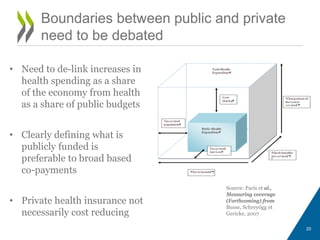

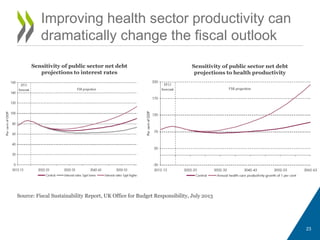
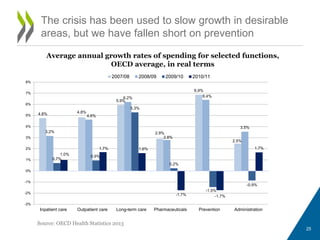


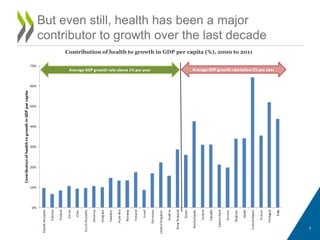
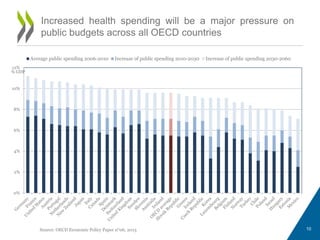
Health spending is likely to continue growing faster than economic growth, putting pressure on public budgets. While accommodating greater health spending may be acceptable, opportunities exist to increase productivity in health systems. In the long run, the correlation between health spending and GDP may need to be weakened to ensure fiscal sustainability, through policies like improving efficiency, shifting focus to prevention, and better defining public coverage.