Effectiveness on Health
Financingfor Health
Systems, Society and
Solutions
Health Financing / Health System Strengthening
Unit
WHO Country Office Indonesia
2.
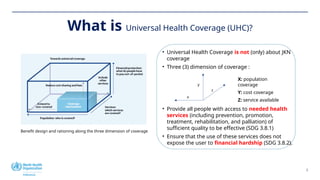
What is UniversalHealth Coverage (UHC)?
2
Benefit design and rationing along the three dimension of coverage
• Universal Health Coverage is not (only) about JKN
coverage
• Three (3) dimension of coverage :
• Provide all people with access to needed health
services (including prevention, promotion,
treatment, rehabilitation, and palliation) of
sufficient quality to be effective (SDG 3.8.1)
• Ensure that the use of these services does not
expose the user to financial hardship (SDG 3.8.2).
X: population
coverage
Y: cost coverage
Z: service available
x
y
z
3.
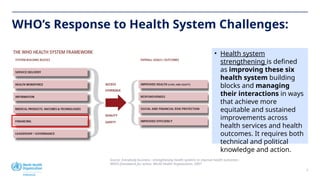
WHO’s Response toHealth System Challenges:
Source: Everybody business : strengthening health systems to improve health outcomes :
WHO’s framework for action. World Health Organization. 2007
3
• Health system
strengthening is defined
as improving these six
health system building
blocks and managing
their interactions in ways
that achieve more
equitable and sustained
improvements across
health services and health
outcomes. It requires both
technical and political
knowledge and action.
4.
4
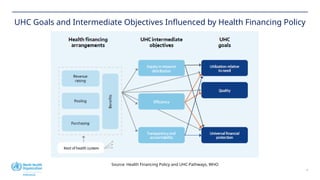
UHC Goals andIntermediate Objectives Influenced by Health Financing Policy
Source: Health Financing Policy and UHC Pathways, WHO
5.
5
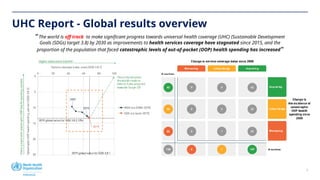
UHC Report -Global results overview
“ The world is off track to make significant progress towards universal health coverage (UHC) (Sustainable Development
Goals (SDGs) target 3.8) by 2030 as improvements to health services coverage have stagnated since 2015, and the
proportion of the population that faced catastrophic levels of out-of-pocket (OOP) health spending has increased“
6.
Indonesia Health Developmentthrough UHC Tracking
Source: Global UHC Report 2023, WHO
20 40 60 80 100
0
5
10
15
20
2000
2005 2010
2015
2017
2019
2005
2010
2015
2017
2019
2021
2000
2005
2010
2015
2017
2019
Global Indonesia SE Asia Region
UHC service coverage index (SDG indicator 3.8.1)
Catastrophic
out-of-pocket
health
spending
(SDG
indicator
3.8.2,
10%
threshold)
An increase in service coverage is better
Less
people
with
catastrophic
health
spending
is
better
SDG 3.8.2 Financial Protection
• Based on Catastrophic Health Spending in June 2021:
5.6 million people from poor households experienced
catastrophic out-of-pocket (OOP) health expenditures
(WHO, 2023).
• In 2020, about 28.9% of total health expenditure
came from OOP payments. The proportion of OOP to
Total Health Expenditure (THE) continues to decline,
although household contributions remain dominant
(MOH, 2024).
SDG 3.8.1 Service Delivery
Tracer Indicator
UHC SCI
Index
Reproductive, newborn, maternal and
child health (RMNCH)
Infectious Diseases (TB, HIV, Malaria,
Sanitation)
Non-Communicable Diseases
(Hypertension, Diabetes, Tobacco non-
use)
Service Capacity and Access (Hospital
bed, Health Workforce, IHR)
7.
7
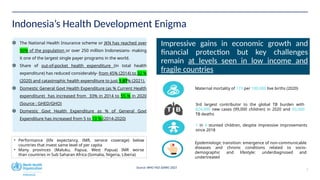
Indonesia’s Health DevelopmentEnigma
The National Health Insurance scheme or JKN has reached over
90% of the population or over 250 million Indonesians- making
it one of the largest single payer programs in the world.
Share of out-of-pocket health expenditure (in total health
expenditure) has reduced considerably- from 45% (2014) to 32 %
(2020) and catastrophic health expenditure to just 1.97% (2021).
Domestic General Govt Health Expenditure (as % Current Health
expenditure) has increased from 33% in 2014 to 55 % in 2020
(Source : GHED/GHO)
Domestic Govt Health Expenditure as % of General Govt
Expenditure has increased from 5 to 10 % (2014-2020)
Impressive gains in economic growth and
financial protection but key challenges
remain at levels seen in low income and
fragile countries
Maternal mortality of 173 per 100,000 live births (2020)
3rd largest contributor to the global TB burden with
824,000 new cases (99,000 children) in 2020 and 93,000
TB deaths
1 in 4 stunted children, despite impressive improvements
since 2018
Epidemiologic transition: emergence of non-communicable
diseases and chronic conditions related to socio-
demographic and lifestyle: underdiagnosed and
undertreated
• Performance (life expectancy, IMR, service coverage) below
countries that invest same level of per capita
• Many provinces (Maluku, Papua, West Papua) IMR worse
than countries in Sub Saharan Africa (Somalia, Nigeria, Liberia)
Source: WHO HSD SEARO 2023
8.
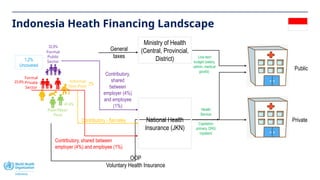
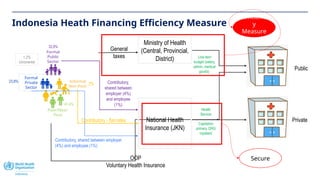
Indonesia Heath FinancingLandscape
23,8%
Formal
Private
Sector
Poor/Near-
Poor
Informal
Non-Poor
Formal
Public
Sector
General
taxes
32,8%
41,4%
Contributory, shared between
employer (4%) and employee (1%)
Public
Private
Line-item
budget (salary,
admin, medical
goods)
Ministry of Health
(Central, Provincial,
District)
Capitation
primary, DRG
inpatient
OOP
Voluntary Health Insurance
National Health
Insurance (JKN)
2%
Contributory,
shared
between
employer (4%)
and employee
(1%)
Contributory - flat-rates
1,2%
Uncovered
Health
Service
9.
9
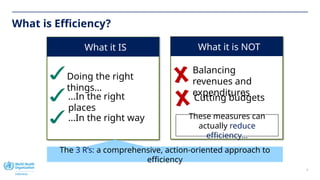
What is Efficiency?
Whatit IS
Doing the right
things…
…In the right
places
…In the right way
The 3 R’s: a comprehensive, action-oriented approach to
efficiency
What it is NOT
Balancing
revenues and
expenditures
Cutting budgets
These measures can
actually reduce
efficiency…
10.
10
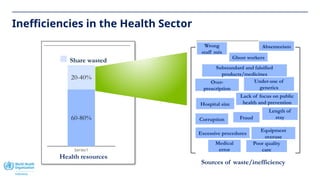
Inefficiencies in theHealth Sector
Series1
60-80%
20-40%
Health resources
Share wasted
Sources of waste/inefficiency
Wrong
staff mix
Under-use of
generics
Over-
prescription
Substandard and falsified
products/medicines
Hospital size
Length of
stay
Corruption Fraud
Excessive procedures
Equipment
overuse
Poor quality
care
Medical
error
Absenteeism
Ghost workers
Lack of focus on public
health and prevention
11.
11
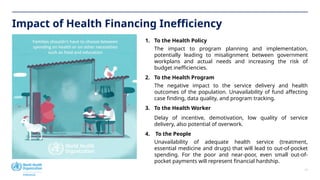
Impact of HealthFinancing Inefficiency
1. To the Health Policy
The impact to program planning and implementation,
potentially leading to misalignment between government
workplans and actual needs and increasing the risk of
budget inefficiencies.
2. To the Health Program
The negative impact to the service delivery and health
outcomes of the population. Unavailability of fund affecting
case finding, data quality, and program tracking.
3. To the Health Worker
Delay of incentive, demotivation, low quality of service
delivery, also potential of overwork.
4. To the People
Unavailability of adequate health service (treatment,
essential medicine and drugs) that will lead to out-of-pocket
spending. For the poor and near-poor, even small out-of-
pocket payments will represent financial hardship.
12.
Indonesia Heath FinancingEfficiency Measure
23,8%
Formal
Private
Sector
Poor/Near-
Poor
Informal
Non-Poor
Formal
Public
Sector
General
taxes
32,8%
41,4%
Contributory, shared between employer
(4%) and employee (1%)
Public
Private
Line-item
budget (salary,
admin, medical
goods)
Ministry of Health
(Central, Provincial,
District)
Capitation
primary, DRG
inpatient
OOP
Voluntary Health Insurance
National Health
Insurance (JKN)
2% Contributory,
shared between
employer (4%)
and employee
(1%)
Contributory - flat-rates
1,2%
Uncovered
Health
Service
Efficienc
y
Measure
s
Secure
13.
13
Australia
Bangladesh
Brazil Bhutan
China
Germany
Egypt
France
UK
India
Japan
Korea
Sri LankaMaldives
Myanmar Malaysia
Nepal
Philippines
Thailand
Turkiye
USA
Indonesia
0
10
20
30
40
50
60
70
80
90
100
SHI
contributions
shar
0 10 20 30 40 50 60 70 80 90 100
General taxation share of current health spending (%)
Australia
Bangladesh
Brazil
Bhutan
China
Germany
Egypt
France
UK
India
Japan
Korea
Sri Lanka
Maldives
Myanmar
Malaysia
Nepal
Philippines
Thailand
Timor-Leste
Turkiye
USA
Viet Nam
Indonesia
0
10
20
30
40
50
60
70
80
OOP
share
of
health
e
0 1 2 3 4 5 6 7 8 9 10 11 12
Public expenditure on health as share of GDP (%)
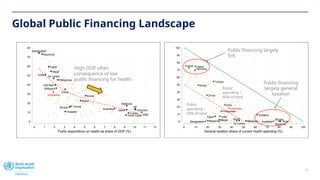
Global Public Financing Landscape
High OOP often
consequence of low
public financing for health
Public financing largely
SHI
Public financing
largely general
taxation
Public
spending >
50% of total
Public
spending <
50% of total
14.
14
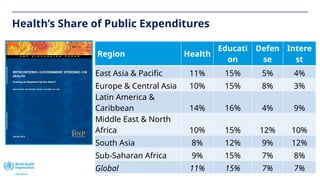
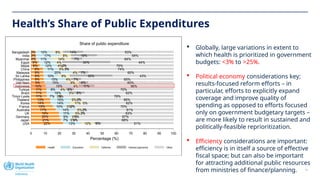
Health’s Share ofPublic Expenditures
Region Health
Educati
on
Defen
se
Intere
st
East Asia & Pacific 11% 15% 5% 4%
Europe & Central Asia 10% 15% 8% 3%
Latin America &
Caribbean 14% 16% 4% 9%
Middle East & North
Africa 10% 15% 12% 10%
South Asia 8% 12% 9% 12%
Sub-Saharan Africa 9% 15% 7% 8%
Global 11% 15% 7% 7%
15.
15
Health’s Share ofPublic Expenditures
Globally, large variations in extent to
which health is prioritized in government
budgets: <3% to >25%.
Political economy considerations key;
results-focused reform efforts – in
particular, efforts to explicitly expand
coverage and improve quality of
spending as opposed to efforts focused
only on government budgetary targets –
are more likely to result in sustained and
politically-feasible reprioritization.
Efficiency considerations are important:
efficiency is in itself a source of effective
fiscal space; but can also be important
for attracting additional public resources
from ministries of finance/planning.
22% 13% 10% 5% 51%
21% 7% 3%
1% 68%
20% 9% 3%
1% 67%
19% 11% 5% 2% 63%
17% 14% 5%2% 61%
15% 10% 3%
2% 70%
14% 14% 11% 0% 62%
13% 15% 5%2% 65%
11% 7% 3%
0% 79%
11% 16% 3% 8% 62%
11% 9% 4% 6% 70%
10% 19% 4% 11% 56%
9% 15% 9% 6% 60%
9% 15% 4% 7% 65%
9% 10% 9% 30% 43%
9% 20% 4% 7% 60%
8% 11% 5% 3% 74%
6% 12% 4%2% 75%
5% 12% 4% 34% 44%
4% 11% 14% 7% 64%
3% 17% 8% 18% 54%
3% 12% 8% 14% 63%
0 10 20 30 40 50 60 70 80 90 100
Percentage (%)
USA
Japan
Germany
UK
Australia
France
Korea
Thailand
Timor-Leste
Brazil
Turkiye
Indonesia
Viet Nam
Philippines
Sri Lanka
Malaysia
China
Nepal
Egypt
Myanmar
India
Bangladesh
Share of public expenditure
Health Education Defense Interest payments Other
16.
16
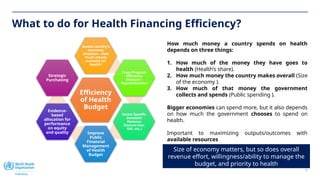
What to dofor Health Financing Efficiency?
Efficiency
of Health
Budget
Assess country’s
economic
situation – How
much money
available for
health?
Cross Program
Efficiency
Measure –
Reprioritization
Sector Specific
Domestic
Revenue
Sources (tax,
SHI, etc.)
Improve
Public
Financial
Management
of Health
Budget
Evidence-
based
allocation for
performance
on equity
and quality
Strategic
Purchasing
Size of economy matters, but so does overall
revenue effort, willingness/ability to manage the
budget, and priority to health
How much money a country spends on health
depends on three things:
1. How much of the money they have goes to
health (Health’s share).
2. How much money the country makes overall (Size
of the economy ).
3. How much of that money the government
collects and spends (Public spending ).
Bigger economies can spend more, but it also depends
on how much the government chooses to spend on
health.
Important to maximizing outputs/outcomes with
available resources
17.
Thank you
For moreinformation, please contact:
Name: Feby Oldfisra
Title: National Professional Officer - Health Financing
Email: oldfisraf@who.int
Editor's Notes
#11 Families should not have to choose between spending on health or on other necessities such as food and education