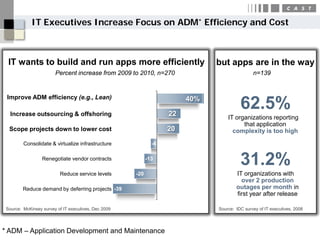
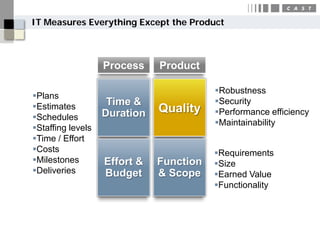
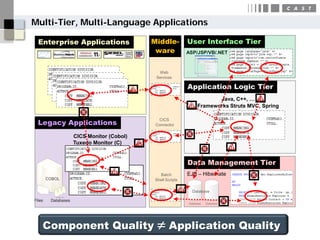
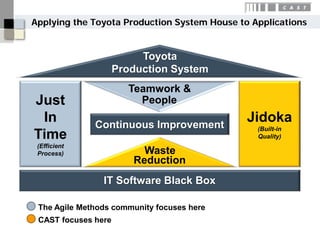
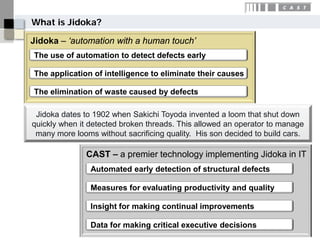
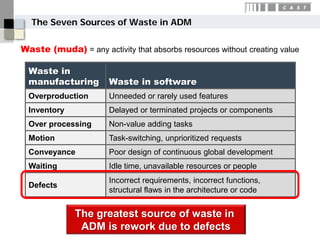
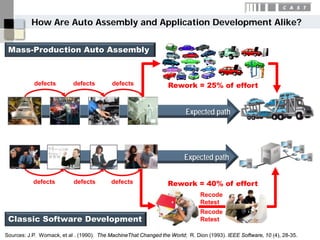
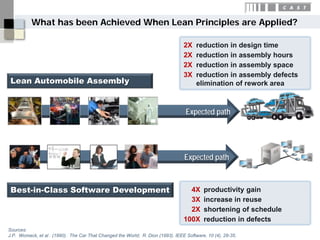
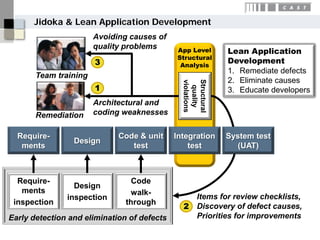
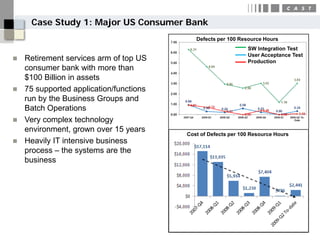
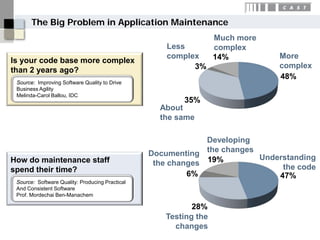
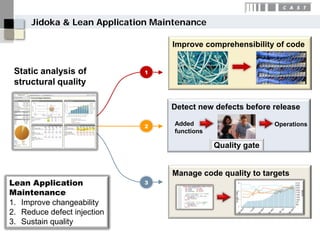
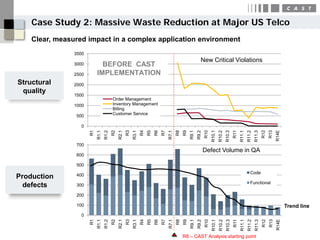
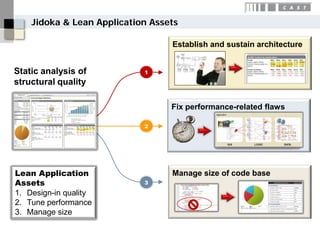
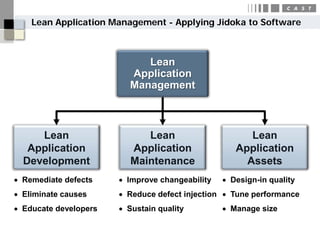
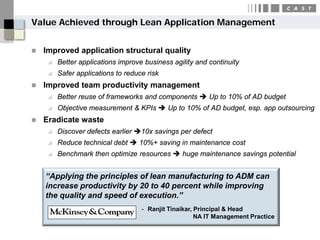
CUTTING IT COSTS BY
APPLYING LEAN PRINCIPLES
Cutting IT Costs by
  Applying Lean Principles
                             Dr. Bill Curtis
Senior Vice President & Chief Scientist, CAST
   Director, Consortium for IT Software Quality
Our Speaker


              Dr. Bill Curtis
              SVP & Chief Scientist, CAST
              Director, Consortium for IT
              Software Quality (CISQ)
IT Executives Increase Focus on ADM* Efficiency and Cost


  IT wants to build and run apps more efficiently                             but apps are in the way
                        Percent increase from 2009 to 2010, n=270                             n=139


 Improve ADM efficiency (e.g., Lean)

   Increase outsourcing & offshoring                               22
                                                                        40%
                                                                                        62.5%
                                                                                  IT organizations reporting
                                                                                        that application
  Scope projects down to lower cost                                20               complexity is too high
         Consolidate & virtualize infrastructure              -6

                  Renegotiate vendor contracts              -13
                                                                                        31.2%
                          Reduce service levels       -20                             IT organizations with
                                                                                        over 2 production
         Reduce demand by deferring projects -39                                      outages per month in
                                                                                      first year after release

 Source: McKinsey survey of IT executives, Dec 2009                           Source: IDC survey of IT executives, 2008


* ADM – Application Development and Maintenance
IT Measures Everything Except the Product


                   Process    Product

                                         Robustness
Plans
                    Time &               Security
Estimates                    Quality
                   Duration              Performance efficiency
Schedules
                                         Maintainability
Staffing levels
Time / Effort
Costs                                   Requirements
Milestones        Effort &   Function   Size
Deliveries        Budget     & Scope    Earned Value
                                         Functionality
Multi-Tier, Multi-Language Applications

  Enterprise Applications                   Middle-          User Interface Tier
                                             ware            ASP/JSP/VB/.NET


                                              Web
                                             Services

                                                             Application Logic Tier
                                                                        Java, C++, …
                                                                 Frameworks Struts MVC, Spring


  Legacy Applications
                                              CICS
                                             Connector

                     CICS Monitor (Cobol)
                     Tuxedo Monitor (C)


                                                             Data Management Tier
                                               Batch         EJB – Hibernate
        COBOL                                Shell Scripts

                                                               Database

Files    Databases


    Component Quality                         ≠ Application Quality
Applying the Toyota Production System House to Applications


                          Toyota
                     Production System
                       Teamwork &
Just                     People
 In           Continuous Improvement
                                              Jidoka
                                                (Built-in
Time                                            Quality)
 (Efficient
 Process)                 Waste
                        Reduction
                IT Software Black Box

 The Agile Methods community focuses here
 CAST focuses here
What is Jidoka?

Jidoka – ‘automation with a human touch’
The use of automation to detect defects early

The application of intelligence to eliminate their causes

The elimination of waste caused by defects

 Jidoka dates to 1902 when Sakichi Toyoda invented a loom that shut down
quickly when it detected broken threads. This allowed an operator to manage
 many more looms without sacrificing quality. His son decided to build cars.

               CAST – a premier technology implementing Jidoka in IT
                Automated early detection of structural defects

                Measures for evaluating productivity and quality

                Insight for making continual improvements

                Data for making critical executive decisions
The Seven Sources of Waste in ADM


Waste (muda) = any activity that absorbs resources without creating value

  Waste in
  manufacturing        Waste in software
  Overproduction       Unneeded or rarely used features
  Inventory            Delayed or terminated projects or components
  Over processing      Non-value adding tasks
  Motion               Task-switching, unprioritized requests
  Conveyance           Poor design of continuous global development
  Waiting              Idle time, unavailable resources or people
                       Incorrect requirements, incorrect functions,
  Defects
                       structural flaws in the architecture or code


              The greatest source of waste in
               ADM is rework due to defects
How Are Auto Assembly and Application Development Alike?


 Mass-Production Auto Assembly


           defects         defects         defects               Rework = 25% of effort


                                                                        Expected path


                                                                        Expected path

           defects         defects        defects                Rework = 40% of effort
                                                                              Recode
                                                                              Retest
                                                                              Recode
 Classic Software Development                                                 Retest

Sources: J.P. Womack, et al . (1990). The MachineThat Changed the World; R. Dion (1993). IEEE Software, 10 (4), 28-35.
Lean Application Management - Applying Jidoka to Software


                            Lean
                         Application
                         Management


     Lean                    Lean                      Lean
   Application            Application               Application
  Development             Maintenance                 Assets
• Remediate defects    • Improve changeability   • Design-in quality
• Eliminate causes     • Reduce defect injection • Tune performance
• Educate developers   • Sustain quality         • Manage size
What has been Achieved When Lean Principles are Applied?

                                                                                 2X    reduction in design time
                                                                                 2X    reduction in assembly hours
                                                                                 2X    reduction in assembly space
                                                                                 3X    reduction in assembly defects
 Lean Automobile Assembly                                                              elimination of rework area


                                                                                  Expected path


                                                                                 Expected path


 Best-in-Class Software Development                                                4X     productivity gain
                                                                                   3X     increase in reuse
                                                                                   2X     shortening of schedule
                                                                                 100X     reduction in defects
Sources:
J.P. Womack, et al . (1990). The Car That Changed the World; R. Dion (1993). IEEE Software, 10 (4), 28-35.
Jidoka & Lean Application Development
                       Avoiding causes of
                       quality problems      App Level      Lean Application
                                             Structural
                       3                      Analysis
                                                            Development
                                                            1. Remediate defects
       Team training
                                                            2. Eliminate causes


                                               Structural
                                               violations
                       1


                                                 quality
                                                            3. Educate developers
                       Architectural and
       Remediation     coding weaknesses

  Require-                   Code & unit     Integration    System test
                 Design
   ments                        test             test          (UAT)


  Require-                       Code
                 Design
   ments                        walk-
               inspection                        Items for review checklists,
 inspection                    through
                                               2 Discovery of defect causes,
Early detection and elimination of defects       Priorities for improvements
Case Study 1: Major US Consumer Bank
                                          Defects per 100 Resource Hours
                                                             SW Integration Test
                                                             User Acceptance Test
 Retirement services arm of top US                          Production
  consumer bank with more than
  $100 Billion in assets
 75 supported application/functions
  run by the Business Groups and
  Batch Operations
 Very complex technology
  environment, grown over 15 years
                                       Cost of Defects per 100 Resource Hours
 Heavily IT intensive business
  process – the systems are the
  business
The Big Problem in Application Maintenance
                                                                  Much more
                                                     Less         complex
                                                     complex      14%         More
Is your code base more complex
                                                           3%                 complex
than 2 years ago?
                                                                              48%
 Source: Improving Software Quality to Drive
 Business Agility
 Melinda-Carol Ballou, IDC
                                                        35%
                                                   About
                                                   the same

                                                              Developing
                                                 Documenting the changes Understanding
How do maintenance staff                          the changes 19%             the code
spend their time?
                                                          6%                 47%
 Source: Software Quality: Producing Practical
 And Consistent Software
 Prof. Mordechai Ben-Manachem

                                                           28%
                                                    Testing the
                                                      changes
Jidoka & Lean Application Maintenance

                                   Improve comprehensibility of code


 Static analysis of          1
 structural quality

                                   Detect new defects before release

                             2      Added                      Operations
                                    functions

                                                Quality gate


                                   Manage code quality to targets
Lean Application             3
Maintenance
1. Improve changeability
2. Reduce defect injection
3. Sustain quality
Case Study 2: Massive Waste Reduction at Major US Telco
    Clear, measured impact in a complex application environment
                3500
                                                                                                                 New Critical Violations
                3000          BEFORE CAST
                2500        IMPLEMENTATION
Structural      2000
 quality        1500
                                          Order Management
                1000                      Inventory Management
                                          Billing
                 500                      Customer Service

                   0
                       R1


                                          R2


                                                      R3


                                                                  R4
                                                                       R5
                                                                            R6
                                                                                 R7


                                                                                             R8
                                                                                                  R9


                                                                                                                     R10


                                                                                                                                                   R11


                                                                                                                                                                                 R12
                                                                                                                                                                                       R13
                            R1.1
                                   R1.2


                                               R2.1


                                                           R3.1


                                                                                      R7.1


                                                                                                       R9.1
                                                                                                              R9.2


                                                                                                                                                                                             R14E
                                                                                                                           R10.1
                                                                                                                                   R10.2
                                                                                                                                           R10.3


                                                                                                                                                         R11.1
                                                                                                                                                                 R11.2
                                                                                                                                                                         R11.3
                 700
                                                                                                                     Defect Volume in QA
                 600

                 500
                                                                                                                                                                    Code
Production       400
                                                                                                                                                                    Functional
  defects        300

                 200

                 100                                                                                                                                                                                Trend line
                   0
                       R1


                                          R2


                                                      R3


                                                                  R4
                                                                       R5
                                                                            R6
                                                                                 R7


                                                                                             R8
                                                                                                  R9


                                                                                                                     R10


                                                                                                                                                   R11


                                                                                                                                                                                 R12
                                                                                                                                                                                       R13
                            R1.1
                                   R1.2


                                               R2.1


                                                           R3.1


                                                                                      R7.1


                                                                                                       R9.1
                                                                                                              R9.2


                                                                                                                                                                                             R14E
                                                                                                                           R10.1
                                                                                                                                   R10.2
                                                                                                                                           R10.3


                                                                                                                                                         R11.1
                                                                                                                                                                 R11.2
                                                                                                                                                                         R11.3
                                                                                                  R8 – CAST Analysis starting point
Jidoka & Lean Application Assets

                                  Establish and sustain architecture


Static analysis of          1
structural quality

                                  Fix performance-related flaws

                            2


Lean Application                  Manage size of code base
Assets                      3

1. Design-in quality
2. Tune performance
3. Manage size
Lean Application Management - Applying Jidoka to Software


                            Lean
                         Application
                         Management


     Lean                    Lean                      Lean
   Application            Application               Application
  Development             Maintenance                 Assets
• Remediate defects    • Improve changeability   • Design-in quality
• Eliminate causes     • Reduce defect injection • Tune performance
• Educate developers   • Sustain quality         • Manage size
Value Achieved through Lean Application Management


   Improved application structural quality
        Better applications improve business agility and continuity
        Safer applications to reduce risk
   Improved team productivity management
        Better reuse of frameworks and components  Up to 10% of AD budget
        Objective measurement & KPIs  Up to 10% of AD budget, esp. app outsourcing
   Eradicate waste
        Discover defects earlier 10x savings per defect
        Reduce technical debt  10%+ saving in maintenance cost
        Benchmark then optimize resources  huge maintenance savings potential


    “Applying the principles of lean manufacturing to ADM can
    increase productivity by 20 to 40 percent while improving
    the quality and speed of execution.”
                                    - Ranjit Tinaikar, Principal & Head
                                                       NA IT Management Practice
CAST Application Intelligence Platform (AIP)
                                   Overview
Product - Structural Quality Metrics


 Most enterprises measure everything but the product delivered to the business
    CAST Application Intelligence Platform (AIP) measures the product itself


                           Process         Product

                                                        Robustness
                                                        Performance
                           Time &         Quality       Security          CAST AIP
       Planning           Duration       &Size         Changeability
       Estimation                                      Transferability
       Scheduling                                      Size
       Time Tracking
       Cost Tracking                                   Requirements
                                          Function &
                        Effort & Budget
                                            Scope
                                                        Earned Value
                                                        User Acceptance
                                                        Usability
CAST Inserts Actionable Visibility


    CAST Application Intelligence Center                     CxO & VP, …
                                                             Dashboard, reports
                         CAST Application
                         Intelligence PlatformTM
                           AI Management Studio
                           Knowledge Base
                           Approx one thousand rules and
                             best practices                  PM, QA, Architects…
                           Decade of software engineering    Std enforcement
                             expertise                        Early ID of violations
         CAST Application Analysis Engine                     Drill down to root cause

       CAST Native       CAST UA        3rd party
      Analyzers (28)      scripts      analyzers


Delivered Source Code:                                       Dev Teams, Suppliers
   CICS, IMS, COBOL, DB2 z/OS, PL/I                          Arch. visibility / Quick wins
   J2EE, .NET and all Major RDBMS                            Software engineering expertise
   Web Apps, BI, EAI, C/C++, VB, PB                          Continuous training/coaching
   Siebel, SAP, PSFT, OBS, Amdocs
Tangible and Measured Value

   Mitigate business risks with improved structural quality
         Better applications for higher business resiliency and continuity
         Risk-proofed projects more likely to deliver business benefits on time
   Make IT and suppliers more productive
         Eliminate waste in ADM
              Prevent coding errors in development: 10x savings in rework per coding error
              Keep technical debt from growing: up to 10% saving in maintenance cost
              Benchmark then optimize resources: maintenance savings potential
              Better reuse of frameworks and components: up to 10% of dev budget
         Reduce waste in operations
              Improve efficiency of large complex transactions & batch processes: up to 5% mips
              Reduce troubleshooting and rollover costs: lower Ops staff overtime
         Apply consistent measurement & KPIs for superior visibility
              Up to 10% of ADM budget, esp. ADM outsourcing


“Applying the principles of lean manufacturing to ADM can increase productivity by 20 to 40
               percent while improving the quality and speed of execution.”
                               - Ranjit Tinaikar, Principal, Head of NA IT Management Practice
Market Leader and a Pioneer

         250 Global Leaders Rely on CAST


SIsUse/Resell CAST
SIs Resell CAST                            Industry Groups Engage CAST


        Key Influencers Endorse CAST
Insurance Carrier Removes Technical Debt and Lowers Costs

 Industry: Insurance                                             Defect Density
 Portfolio statistics                              12
                                                    10


                                     Defects/KLOC
        Java – 3m LOC
                                                     8
        PowerBuilder – 400k LOC
                                                     6
        C++ Middleware – 800k LOC
                                                     4
   Changes per year                                 2

      2m LOC changes                                0
                                                         Year 1   Year 2   Year 3    Year 4    Year 5
      500 kLOC increment in code
                                                                           Year
       base
      About 300 projects                                                          Reduction in
                                                                                  defects in four
                                                                                   years of 56%
 Analysis of about 4m LOC performed weekly
 Benefits Measured:
    Defect density reduced 56% in 4 years
    Stabilized maintainability at 2.55
    All new apps at maintainability of 3.5


                                                                                                        25
L a nmo ea o t A T
 er    r bu C S


    w w c ss f aec m
     w .a tot r.o
              w
    bo .a tot aec m
     lgc ss f r.o
             w
w w fc b o .o c so q a t
 w . e o kc m/a tn u ly
    a                 i
w w sd s aen t a tot ae
 w . ie h r.e/ ss f r
     l         c    w
  w w t ie.o O Q a t
   w . t r m/ n u ly
       wt c         i

Software Measurement for Lean Application Management

  • 1.
    CUTTING IT COSTSBY APPLYING LEAN PRINCIPLES
  • 2.
    Cutting IT Costsby Applying Lean Principles Dr. Bill Curtis Senior Vice President & Chief Scientist, CAST Director, Consortium for IT Software Quality
  • 3.
    Our Speaker Dr. Bill Curtis SVP & Chief Scientist, CAST Director, Consortium for IT Software Quality (CISQ)
  • 4.
    IT Executives IncreaseFocus on ADM* Efficiency and Cost IT wants to build and run apps more efficiently but apps are in the way Percent increase from 2009 to 2010, n=270 n=139 Improve ADM efficiency (e.g., Lean) Increase outsourcing & offshoring 22 40% 62.5% IT organizations reporting that application Scope projects down to lower cost 20 complexity is too high Consolidate & virtualize infrastructure -6 Renegotiate vendor contracts -13 31.2% Reduce service levels -20 IT organizations with over 2 production Reduce demand by deferring projects -39 outages per month in first year after release Source: McKinsey survey of IT executives, Dec 2009 Source: IDC survey of IT executives, 2008 * ADM – Application Development and Maintenance
  • 5.
    IT Measures EverythingExcept the Product Process Product Robustness Plans Time & Security Estimates Quality Duration Performance efficiency Schedules Maintainability Staffing levels Time / Effort Costs Requirements Milestones Effort & Function Size Deliveries Budget & Scope Earned Value Functionality
  • 6.
    Multi-Tier, Multi-Language Applications Enterprise Applications Middle- User Interface Tier ware ASP/JSP/VB/.NET Web Services Application Logic Tier Java, C++, … Frameworks Struts MVC, Spring Legacy Applications CICS Connector CICS Monitor (Cobol) Tuxedo Monitor (C) Data Management Tier Batch EJB – Hibernate COBOL Shell Scripts Database Files Databases Component Quality ≠ Application Quality
  • 7.
    Applying the ToyotaProduction System House to Applications Toyota Production System Teamwork & Just People In Continuous Improvement Jidoka (Built-in Time Quality) (Efficient Process) Waste Reduction IT Software Black Box The Agile Methods community focuses here CAST focuses here
  • 8.
    What is Jidoka? Jidoka– ‘automation with a human touch’ The use of automation to detect defects early The application of intelligence to eliminate their causes The elimination of waste caused by defects Jidoka dates to 1902 when Sakichi Toyoda invented a loom that shut down quickly when it detected broken threads. This allowed an operator to manage many more looms without sacrificing quality. His son decided to build cars. CAST – a premier technology implementing Jidoka in IT Automated early detection of structural defects Measures for evaluating productivity and quality Insight for making continual improvements Data for making critical executive decisions
  • 9.
    The Seven Sourcesof Waste in ADM Waste (muda) = any activity that absorbs resources without creating value Waste in manufacturing Waste in software Overproduction Unneeded or rarely used features Inventory Delayed or terminated projects or components Over processing Non-value adding tasks Motion Task-switching, unprioritized requests Conveyance Poor design of continuous global development Waiting Idle time, unavailable resources or people Incorrect requirements, incorrect functions, Defects structural flaws in the architecture or code The greatest source of waste in ADM is rework due to defects
  • 10.
    How Are AutoAssembly and Application Development Alike? Mass-Production Auto Assembly defects defects defects Rework = 25% of effort Expected path Expected path defects defects defects Rework = 40% of effort Recode Retest Recode Classic Software Development Retest Sources: J.P. Womack, et al . (1990). The MachineThat Changed the World; R. Dion (1993). IEEE Software, 10 (4), 28-35.
  • 11.
    Lean Application Management- Applying Jidoka to Software Lean Application Management Lean Lean Lean Application Application Application Development Maintenance Assets • Remediate defects • Improve changeability • Design-in quality • Eliminate causes • Reduce defect injection • Tune performance • Educate developers • Sustain quality • Manage size
  • 12.
    What has beenAchieved When Lean Principles are Applied? 2X reduction in design time 2X reduction in assembly hours 2X reduction in assembly space 3X reduction in assembly defects Lean Automobile Assembly elimination of rework area Expected path Expected path Best-in-Class Software Development 4X productivity gain 3X increase in reuse 2X shortening of schedule 100X reduction in defects Sources: J.P. Womack, et al . (1990). The Car That Changed the World; R. Dion (1993). IEEE Software, 10 (4), 28-35.
  • 13.
    Jidoka & LeanApplication Development Avoiding causes of quality problems App Level Lean Application Structural 3 Analysis Development 1. Remediate defects Team training 2. Eliminate causes Structural violations 1 quality 3. Educate developers Architectural and Remediation coding weaknesses Require- Code & unit Integration System test Design ments test test (UAT) Require- Code Design ments walk- inspection Items for review checklists, inspection through 2 Discovery of defect causes, Early detection and elimination of defects Priorities for improvements
  • 14.
    Case Study 1:Major US Consumer Bank Defects per 100 Resource Hours SW Integration Test User Acceptance Test  Retirement services arm of top US Production consumer bank with more than $100 Billion in assets  75 supported application/functions run by the Business Groups and Batch Operations  Very complex technology environment, grown over 15 years Cost of Defects per 100 Resource Hours  Heavily IT intensive business process – the systems are the business
  • 15.
    The Big Problemin Application Maintenance Much more Less complex complex 14% More Is your code base more complex 3% complex than 2 years ago? 48% Source: Improving Software Quality to Drive Business Agility Melinda-Carol Ballou, IDC 35% About the same Developing Documenting the changes Understanding How do maintenance staff the changes 19% the code spend their time? 6% 47% Source: Software Quality: Producing Practical And Consistent Software Prof. Mordechai Ben-Manachem 28% Testing the changes
  • 16.
    Jidoka & LeanApplication Maintenance Improve comprehensibility of code Static analysis of 1 structural quality Detect new defects before release 2 Added Operations functions Quality gate Manage code quality to targets Lean Application 3 Maintenance 1. Improve changeability 2. Reduce defect injection 3. Sustain quality
  • 17.
    Case Study 2:Massive Waste Reduction at Major US Telco Clear, measured impact in a complex application environment 3500 New Critical Violations 3000 BEFORE CAST 2500 IMPLEMENTATION Structural 2000 quality 1500 Order Management 1000 Inventory Management Billing 500 Customer Service 0 R1 R2 R3 R4 R5 R6 R7 R8 R9 R10 R11 R12 R13 R1.1 R1.2 R2.1 R3.1 R7.1 R9.1 R9.2 R14E R10.1 R10.2 R10.3 R11.1 R11.2 R11.3 700 Defect Volume in QA 600 500 Code Production 400 Functional defects 300 200 100 Trend line 0 R1 R2 R3 R4 R5 R6 R7 R8 R9 R10 R11 R12 R13 R1.1 R1.2 R2.1 R3.1 R7.1 R9.1 R9.2 R14E R10.1 R10.2 R10.3 R11.1 R11.2 R11.3 R8 – CAST Analysis starting point
  • 18.
    Jidoka & LeanApplication Assets Establish and sustain architecture Static analysis of 1 structural quality Fix performance-related flaws 2 Lean Application Manage size of code base Assets 3 1. Design-in quality 2. Tune performance 3. Manage size
  • 19.
    Lean Application Management- Applying Jidoka to Software Lean Application Management Lean Lean Lean Application Application Application Development Maintenance Assets • Remediate defects • Improve changeability • Design-in quality • Eliminate causes • Reduce defect injection • Tune performance • Educate developers • Sustain quality • Manage size
  • 20.
    Value Achieved throughLean Application Management  Improved application structural quality  Better applications improve business agility and continuity  Safer applications to reduce risk  Improved team productivity management  Better reuse of frameworks and components  Up to 10% of AD budget  Objective measurement & KPIs  Up to 10% of AD budget, esp. app outsourcing  Eradicate waste  Discover defects earlier 10x savings per defect  Reduce technical debt  10%+ saving in maintenance cost  Benchmark then optimize resources  huge maintenance savings potential “Applying the principles of lean manufacturing to ADM can increase productivity by 20 to 40 percent while improving the quality and speed of execution.” - Ranjit Tinaikar, Principal & Head NA IT Management Practice
  • 21.
    CAST Application IntelligencePlatform (AIP) Overview
  • 22.
    Product - StructuralQuality Metrics Most enterprises measure everything but the product delivered to the business CAST Application Intelligence Platform (AIP) measures the product itself Process Product  Robustness  Performance Time & Quality  Security CAST AIP  Planning Duration &Size  Changeability  Estimation  Transferability  Scheduling  Size  Time Tracking  Cost Tracking  Requirements Function & Effort & Budget Scope  Earned Value  User Acceptance  Usability
  • 23.
    CAST Inserts ActionableVisibility CAST Application Intelligence Center CxO & VP, … Dashboard, reports CAST Application Intelligence PlatformTM  AI Management Studio  Knowledge Base  Approx one thousand rules and best practices PM, QA, Architects…  Decade of software engineering  Std enforcement expertise  Early ID of violations CAST Application Analysis Engine  Drill down to root cause CAST Native CAST UA 3rd party Analyzers (28) scripts analyzers Delivered Source Code: Dev Teams, Suppliers  CICS, IMS, COBOL, DB2 z/OS, PL/I  Arch. visibility / Quick wins  J2EE, .NET and all Major RDBMS  Software engineering expertise  Web Apps, BI, EAI, C/C++, VB, PB  Continuous training/coaching  Siebel, SAP, PSFT, OBS, Amdocs
  • 24.
    Tangible and MeasuredValue  Mitigate business risks with improved structural quality  Better applications for higher business resiliency and continuity  Risk-proofed projects more likely to deliver business benefits on time  Make IT and suppliers more productive  Eliminate waste in ADM  Prevent coding errors in development: 10x savings in rework per coding error  Keep technical debt from growing: up to 10% saving in maintenance cost  Benchmark then optimize resources: maintenance savings potential  Better reuse of frameworks and components: up to 10% of dev budget  Reduce waste in operations  Improve efficiency of large complex transactions & batch processes: up to 5% mips  Reduce troubleshooting and rollover costs: lower Ops staff overtime  Apply consistent measurement & KPIs for superior visibility  Up to 10% of ADM budget, esp. ADM outsourcing “Applying the principles of lean manufacturing to ADM can increase productivity by 20 to 40 percent while improving the quality and speed of execution.” - Ranjit Tinaikar, Principal, Head of NA IT Management Practice
  • 25.
    Market Leader anda Pioneer 250 Global Leaders Rely on CAST SIsUse/Resell CAST SIs Resell CAST Industry Groups Engage CAST Key Influencers Endorse CAST
  • 26.
    Insurance Carrier RemovesTechnical Debt and Lowers Costs  Industry: Insurance Defect Density  Portfolio statistics 12 10 Defects/KLOC  Java – 3m LOC 8  PowerBuilder – 400k LOC 6  C++ Middleware – 800k LOC 4  Changes per year 2  2m LOC changes 0 Year 1 Year 2 Year 3 Year 4 Year 5  500 kLOC increment in code Year base  About 300 projects Reduction in defects in four years of 56%  Analysis of about 4m LOC performed weekly  Benefits Measured:  Defect density reduced 56% in 4 years  Stabilized maintainability at 2.55  All new apps at maintainability of 3.5 25
  • 27.
    L a nmoea o t A T er r bu C S w w c ss f aec m w .a tot r.o w bo .a tot aec m lgc ss f r.o w w w fc b o .o c so q a t w . e o kc m/a tn u ly a i w w sd s aen t a tot ae w . ie h r.e/ ss f r l c w w w t ie.o O Q a t w . t r m/ n u ly wt c i