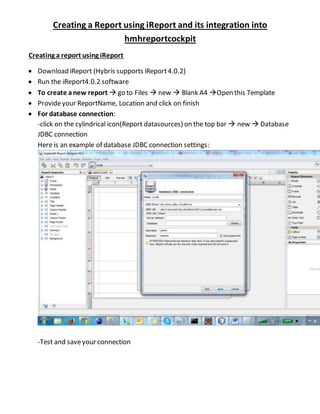
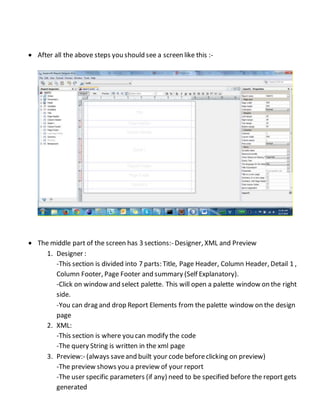
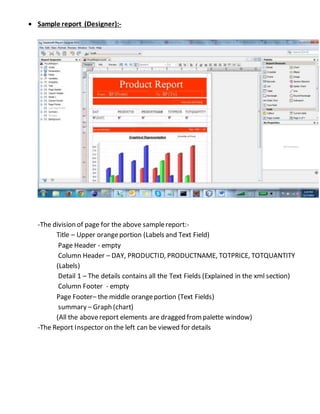
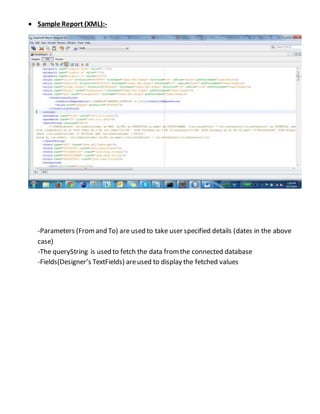
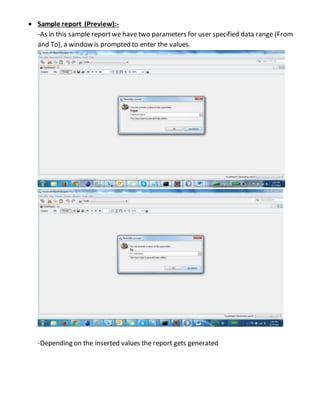
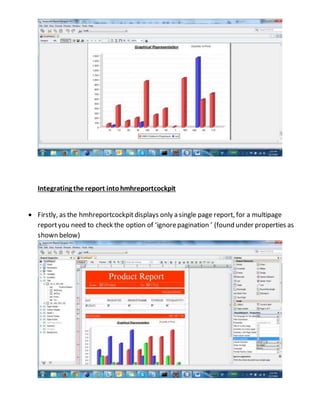
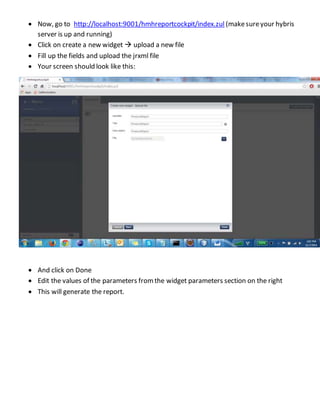
Creating a Report using iReport and its integration into
hmhreportcockpit
Creating a report using iReport
 Download iReport (Hybris supports iReport4.0.2)
 Run the iReport4.0.2 software
 To create anew report  go to Files  new  Blank A4 Open this Template
 Provideyour ReportName, Location and click on finish
 For database connection:
-click on the cylindrical icon(Report datasources) on the top bar  new  Database
JDBC connection
Here is an example of database JDBC connection settings:
-Test and saveyour connection
 After all the above steps you should see a screen like this :-
 The middle part of the screen has 3 sections:- Designer, XML and Preview
1. Designer :
-This section is divided into 7 parts: Title, Page Header, Column Header, Detail 1 ,
Column Footer, Page Footer and summary (Self Explanatory).
-Click on window and select palette. This will open a palette window on the right
side.
-You can drag and drop Report Elements from the palette window on the design
page
2. XML:
-This section is where you can modify the code
-The query String is written in the xml page
3. Preview:- (always saveand built your code beforeclicking on preview)
-The preview shows you a preview of your report
-The user specific parameters (if any) need to be specified before the report gets
generated
 Sample report (Designer):-
-The division of page for the above samplereport:-
Title – Upper orangeportion (Labels and Text Field)
Page Header - empty
Column Header – DAY, PRODUCTID, PRODUCTNAME, TOTPRICE, TOTQUANTITY
(Labels)
Detail 1 – The details contains all the Text Fields (Explained in the xml section)
Column Footer - empty
Page Footer– the middle orangeportion (Text Fields)
summary – Graph (chart)
(All the abovereport elements are dragged frompalette window)
-The Report Inspector on the left can be viewed for details
 Sample Report (XML):-
-Parameters (Fromand To) are used to take user specified details (dates in the above
case)
-The queryString is used to fetch the data fromthe connected database
-Fields(Designer’s TextFields) areused to display the fetched values
-Summary Chart:
-The series expression, categoryExpression and valueExpression basically represents the
x and y axis of the sample graph. Modification of the same will lead to different
graphical representations.
 Sample report (Preview):-
-As in this sample reportwe have two parameters for user specified data range (From
and To), a window is prompted to enter the values.
-Depending on the inserted values the report gets generated
Integrating the report intohmhreportcockpit
 Firstly, as the hmhreportcockpitdisplays only a single page report, for a multipage
reportyou need to check the option of ‘ignorepagination ’ (found under properties as
shown below)
 Now, go to http://localhost:9001/hmhreportcockpit/index.zul (makesureyour hybris
server is up and running)
 Click on create a new widget  upload a new file
 Fill up the fields and upload the jrxml file
 Your screen should look like this:
 And click on Done
 Edit the values of the parameters fromthe widget parameters section on the right
 This will generate the report.
Custom Report Tutorial

Custom Report Tutorial

  • 1.
    Creating a Reportusing iReport and its integration into hmhreportcockpit Creating a report using iReport  Download iReport (Hybris supports iReport4.0.2)  Run the iReport4.0.2 software  To create anew report  go to Files  new  Blank A4 Open this Template  Provideyour ReportName, Location and click on finish  For database connection: -click on the cylindrical icon(Report datasources) on the top bar  new  Database JDBC connection Here is an example of database JDBC connection settings: -Test and saveyour connection
  • 2.
     After allthe above steps you should see a screen like this :-  The middle part of the screen has 3 sections:- Designer, XML and Preview 1. Designer : -This section is divided into 7 parts: Title, Page Header, Column Header, Detail 1 , Column Footer, Page Footer and summary (Self Explanatory). -Click on window and select palette. This will open a palette window on the right side. -You can drag and drop Report Elements from the palette window on the design page 2. XML: -This section is where you can modify the code -The query String is written in the xml page 3. Preview:- (always saveand built your code beforeclicking on preview) -The preview shows you a preview of your report -The user specific parameters (if any) need to be specified before the report gets generated
  • 3.
     Sample report(Designer):- -The division of page for the above samplereport:- Title – Upper orangeportion (Labels and Text Field) Page Header - empty Column Header – DAY, PRODUCTID, PRODUCTNAME, TOTPRICE, TOTQUANTITY (Labels) Detail 1 – The details contains all the Text Fields (Explained in the xml section) Column Footer - empty Page Footer– the middle orangeportion (Text Fields) summary – Graph (chart) (All the abovereport elements are dragged frompalette window) -The Report Inspector on the left can be viewed for details
  • 4.
     Sample Report(XML):- -Parameters (Fromand To) are used to take user specified details (dates in the above case) -The queryString is used to fetch the data fromthe connected database -Fields(Designer’s TextFields) areused to display the fetched values
  • 5.
    -Summary Chart: -The seriesexpression, categoryExpression and valueExpression basically represents the x and y axis of the sample graph. Modification of the same will lead to different graphical representations.
  • 6.
     Sample report(Preview):- -As in this sample reportwe have two parameters for user specified data range (From and To), a window is prompted to enter the values. -Depending on the inserted values the report gets generated
  • 8.
    Integrating the reportintohmhreportcockpit  Firstly, as the hmhreportcockpitdisplays only a single page report, for a multipage reportyou need to check the option of ‘ignorepagination ’ (found under properties as shown below)
  • 9.
     Now, goto http://localhost:9001/hmhreportcockpit/index.zul (makesureyour hybris server is up and running)  Click on create a new widget  upload a new file  Fill up the fields and upload the jrxml file  Your screen should look like this:  And click on Done  Edit the values of the parameters fromthe widget parameters section on the right  This will generate the report.