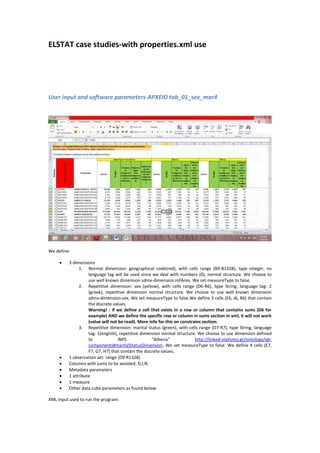
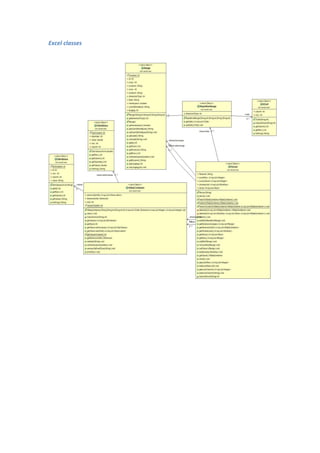
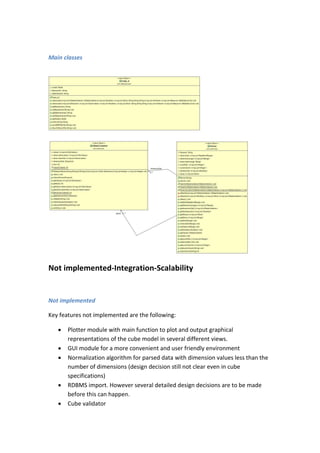
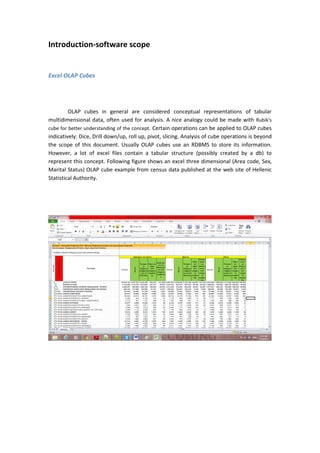
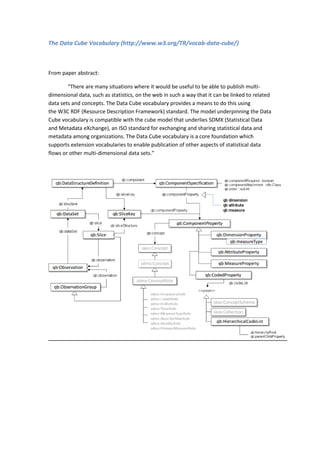
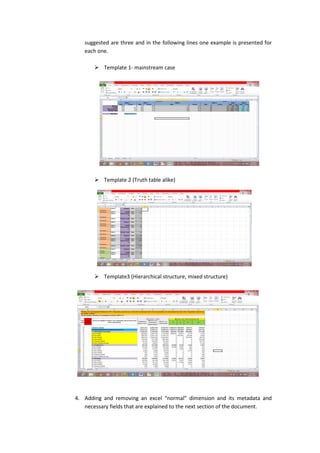
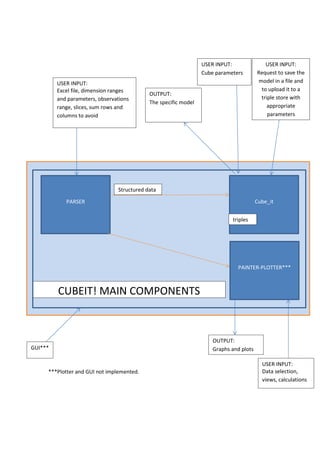
This document describes the Cube_it! software, which transforms statistical datasets from Excel files into linked data using the Data Cube vocabulary. It outlines the software's functions, which include importing Excel files, detecting dimensions and values, creating data cube models, and outputting RDF. The document provides examples of user input for an Excel file with dimensions like location and explains the software's logic, such as parsing the file, detecting dimension values by querying a triple store, and generating the data cube model resources and observations. Cube_it! aims to automate the creation of linked data from existing statistical datasets to make the data easier to access and link to other web resources.


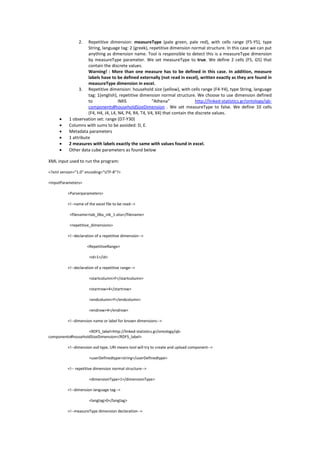
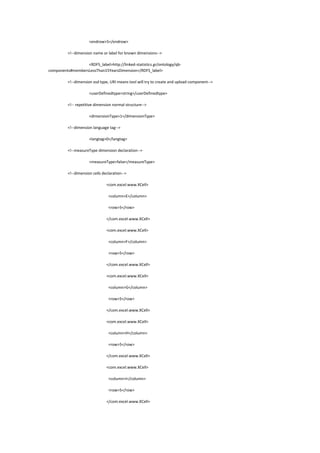
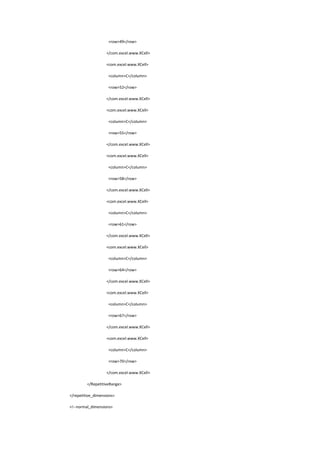
![Using Cube_it!-Function logic – ανάλυση
In this section, software parameters are described along with example input for the
excel file that represents the tabular data that have been used for the data cube vocabulary
description (http://www.w3.org/TR/vocab-data-cube/), having one extra dimension to
show the language tag parameter usage.
Step 1: global variables
1. String: Filename ("cubetestfile.xlsx")
2. Integer: Timeseries(0, 2013, 2001)-0 is the default value. By default no refPeriod
dimension will be used.
3. This variable is responsible for the metadata language tag of the data cube model.
Integer: Languagetag(0,1,2)- 0 is the default value. By default no xml language tag
will be used. Range:[0,2]
1 will be used for English language option
2 for Greek language option.
4. String: Filename-filetype for lod output(test.ttl)
Filename=test
ttl=filetype
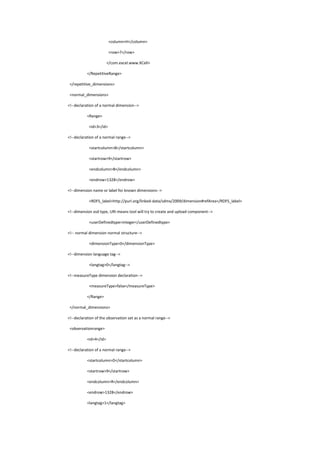
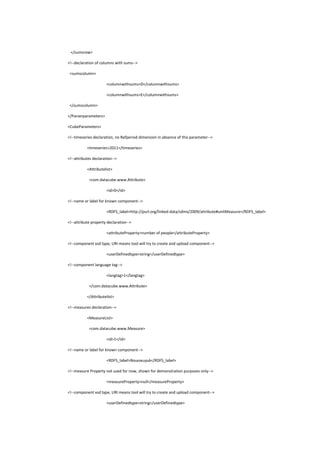
Step 2: excel parameters, definitions and user-input
Dimension types
Normal dimension
Repetitive dimension](https://image.slidesharecdn.com/a56287c7-0c07-479c-a0f1-fe854d72541d-150525223704-lva1-app6892/85/Cube_it-_software_report_for_IMIS-13-320.jpg)
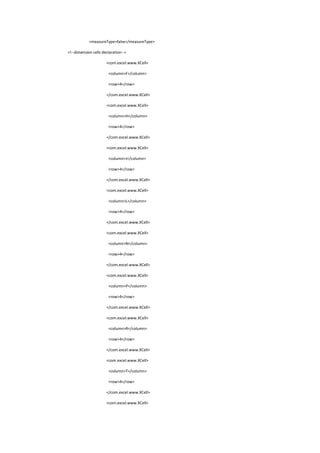
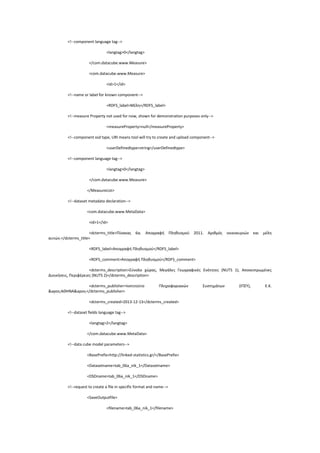
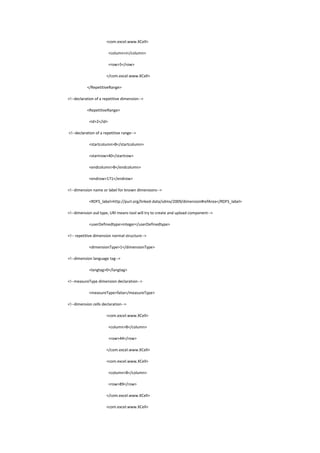
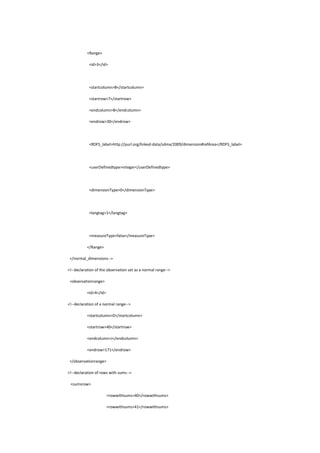
![Normal dimension and parameters:
String: Dimension name-Label(Location)
String: Starting Excel Column(“A”)- Range:[A,BZ]
Integer: Starting Excel Row(4)
String: Ending Excel Column(“A”)-Range:[A,BZ]
Integer: Ending Excel Row(7)
Integer: Languagetag(0,1,2)- 0 is the default value. By default no xml
language tag will be used. Range:[0,2]
1 will be used for English language option
2 for Greek language option.
Dimension datatype(string)- Range:{string, integer, date, datetime, double,
URI}. Last option (“URI”) means that user wants Cube_it! to try to store this
dimension to the Triple Store (upload it) in a Skos:ConceptScheme form.
Integer: Dimensiontype (1,2,3). This parameter defines the dimension
structure in excel. 1 is for normal dimensions (discrete or repetitive), 2 for
mixed structure (template 3) and 3 for mixed structure with hierarchical
dimensions (template 3).
Method:boolean setMeasureType(). Default value is FALSE.
This method is set to true when a dimension is chosen to be of type
qb:MeasureType
Repetitive dimension and parameters:
Dimension name-Label(Sex)](https://image.slidesharecdn.com/a56287c7-0c07-479c-a0f1-fe854d72541d-150525223704-lva1-app6892/85/Cube_it-_software_report_for_IMIS-14-320.jpg)
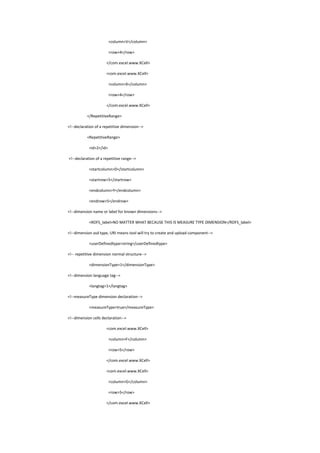
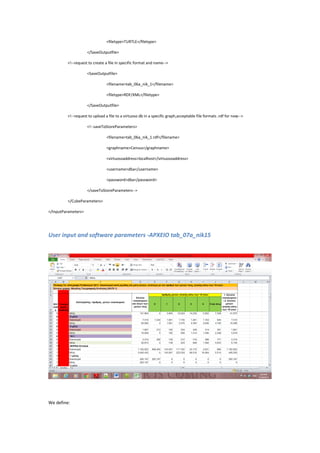
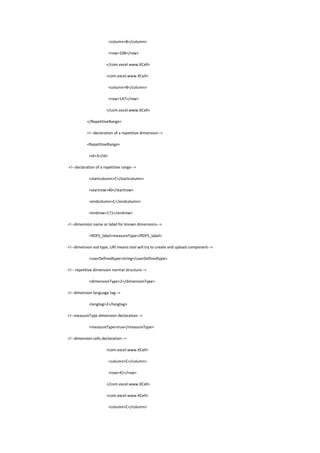
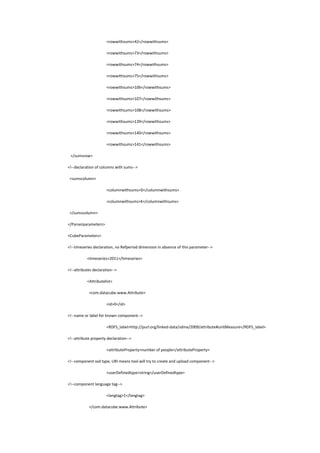
![ Starting Excel Column(“B”) -Range:[A,BZ]
Starting Excel Row(3)
Ending Excel Column(“M”) -Range:[A,BZ]
Ending Excel Row(3)
Dimension datatype (string)- Range:{string, integer, date, datetime, double,
URI}. Last option (“URI”) means that user wants Cube_it! to try to store this
dimension to the Triple Store (upload it) in a Skos:ConceptScheme form.
Integer: Languagetag(0,1,2)- 0 is the default value. By default no xml language
tag will be used. Range:[0,2]
o 1 will be used for English language option
o 2 for Greek language option.
Cells with discrete dimension values. Each cell is defined by the following
parameters (2 cells are defined here):
o String: Excel Column(“B”) -Range:[A,BZ]
o Integer: Excel Row(3)
and
o String: Excel Column(“E”) -Range:[A,BZ]
o String: Excel Row(3)
Integer: Dimensiontype (1,2,3). This parameter defines the dimension structure
in excel. 1 is for normal dimensions (discrete or repetitive), 2 for mixed structure
(template 3) and 3 for mixed structure with hierarchical dimensions (template
3).
Method:boolean setMeasureType(). Default value is FALSE
This method is set to true when a dimension is chosen to be of type
qb:MeasureType
Dataset(observations) and Parameters
Starting Excel Column(“B”) -Range:[A,BZ]
Starting Excel Row(4)
Ending Excel Column(“M”) -Range:[A,BZ]
Ending Excel Row(7)
Totals-rows and columns
Since cubes can construct totals and sums we need to filter the dataset from totals and
sums giving in some input. Parameters for this are whole rows and columns. At this example,
totals and sums do not exist. If needed we would provide for example:
Excel Totals Column(“N”) -Range:[A,BZ]
Excel Totals Row(8)](https://image.slidesharecdn.com/a56287c7-0c07-479c-a0f1-fe854d72541d-150525223704-lva1-app6892/85/Cube_it-_software_report_for_IMIS-15-320.jpg)
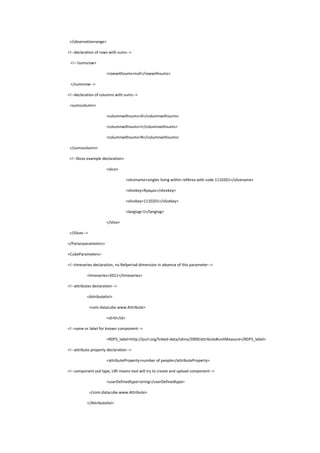
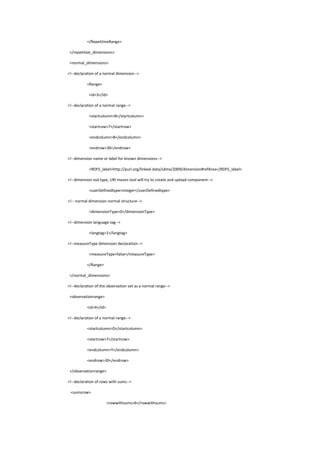
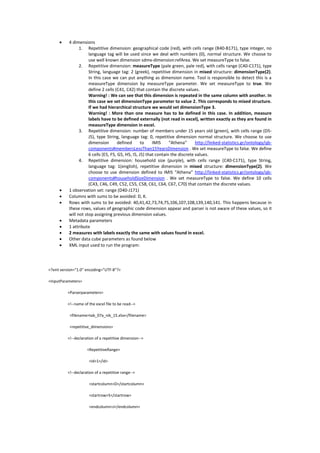
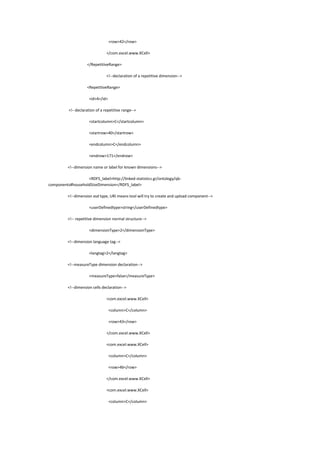
![Slices
At this point the software has everything it needs to parse the excel file. However, a user
may want to manipulate only a subset of the dataset so there is an option to slice data and
use slices to create lod data. For this, following parameters would be needed:
String slicekey name(“bysex”)
Integer: Languagetag(0,1,2)- 0 is the default value. By default no xml language
tag will be used. Range:[0,2]
o 1 will be used for English language option
o 2 for Greek language option.
String: Keyelement(“Male”)
Several key elements can be added as long as they exist in dimensions
Warning! : Slicing function has to be done before parsing or else parsing function should be
applied again.
Step 3: Input files-Parsing analysis
Next step after defining parameters for parsing is to use the parse function. At this
section the logic of parsing is given. What we have gathered so far is some ranges (also
mentioned as dimension definitions) along with some parameters (languagetag etc.) bound
to them, a range for the observation set, rows and columns to avoid and possibly slices that
are defined by slicekeys. A “parser” class (see API documentation) is responsible to read all
the data using the java Apache POI API(http://poi.apache.org/) and output the appropriate
structures that will be used by the data cube model creation class named “Cube_it” to
create the specific data cube model. “Parser” class reads the defined dimensions and stores
them appropriately, then reads the observation set and stores it and then has to make a
matching between them. Until now observations only have a value. However, we want them
to contain and dimension values, to make them dimensionless so we can build our model.
Matching is done by storing excel coordinates (row and column) for dimension values and
observations. When we find a row or column common to a dimension value and a specific
observation we add to this observation, this dimension value. This is of course the trivial
case (template 1). In some cases, dimension values only exist in a cell but are meant to exist
in series of cells. Following figure clearly shows this case. Cells C28, C31, C34, C37, C40 (in
blue) are dimension values of a dimension and each one of them should be propagated to](https://image.slidesharecdn.com/a56287c7-0c07-479c-a0f1-fe854d72541d-150525223704-lva1-app6892/85/Cube_it-_software_report_for_IMIS-16-320.jpg)
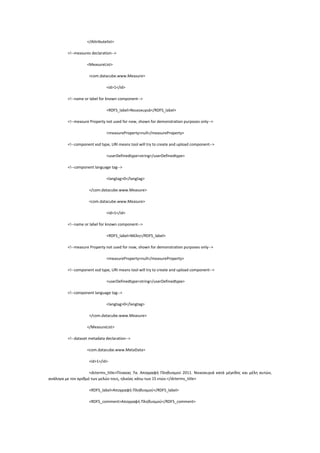
![data are frequently found in EL.STAT. excel files so a solution should be found and applied,
hopefully with the use of normalize function.
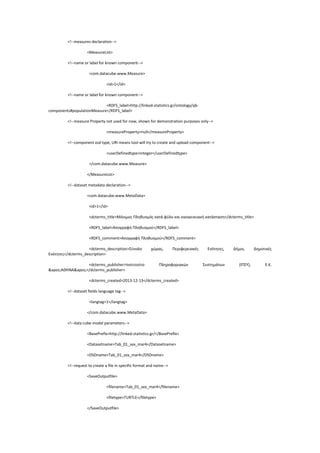
Step 5: Input data for the data cube model
User input to make the data cube model and write it to a file
Metadata for the cube dataset
String: Title(“life expectancy”)
String: label(“life expectancy”)
String: comment(“life expectancy within Welsh Unitary Authorities-extracted
from Stats Wales”)
String: description(“life expectancy within Welsh Unitary Authorities-extracted
from Stats Wales”)
String: publisher(“the publisher”)
String: dateofIssue(“2013/11/08”)
Integer: Languagetag(0,1,2)- 0 is the default value. By default no xml language
tag will be used. Range:[0,2]
o 1 will be used for English language option
o 2 for Greek language option.
Measures
String: Label(“lifeExpectancy”)](https://image.slidesharecdn.com/a56287c7-0c07-479c-a0f1-fe854d72541d-150525223704-lva1-app6892/85/Cube_it-_software_report_for_IMIS-19-320.jpg)
![ String: datatype(integer)- Range:{string, integer, date, datetime, double, URI}.
Last option (“URI”) means that user wants Cube_it! to try to store this measure
to the Triple Store (upload it).
Integer: Languagetag(0,1,2)- 0 is the default value. By default no xml language
tag will be used. Range:[0,2]
o 1 will be used for English language option
o 2 for Greek language option.
Attributes
String: Label(“unitMeasure”)
String: AttributeProperty(“Years”)
String: datatype(integer)- Range:{string, integer, date, datetime, double, URI}.
Last option (“URI”) means that user wants Cube_it! to try to store this attribute
to the Triple Store (upload it).
Integer: Languagetag(0,1,2)- 0 is the default value. By default no xml language
tag will be used. Range:[0,2]
o 1 will be used for English language option
o 2 for Greek language option.
Data cube parameters
String: BasePrefix(“http//:www.linked-statistics.gr”)
String:Datasetname(“dataset1”)
String:DataStructureDefinitionName(“d13”)
Step 6: making the cube analysis
The cube_it class is responsible to create our data cube model from scratch. First
creates an empty model that will be filled with our structured data and a data cube schema
to uses its properties and resources. Dataset and Data Structure Definition resources are
created. Then detects known measures and attributes and if a user has selected appropriate
option (URI option) and no URI has been found by detection, uploads the selected measures
and attributes. Dataset is given its properties and their values. Next step is a check to use
refPeriod dimension or not, defined by Timeseries variable. Components (dimensions,
measures and attributes) are initialized (given their appropriate properties) and added to
the DSD. Components can be separated to 4 different categories (cases).
Components with known URI but component values with no URI.](https://image.slidesharecdn.com/a56287c7-0c07-479c-a0f1-fe854d72541d-150525223704-lva1-app6892/85/Cube_it-_software_report_for_IMIS-20-320.jpg)
![ Components with known URI and component values with URI.
Components with no known URI but component values with URI.
Components with no known URI and component values with no URI.
Observation resources are created and dimensions resources are used to be assigned to
observations along with measure resource. Attribute has been chosen to be assigned to the
dataset. URIs patterns have been used according to the IMIS URI scheme. Language tags
have been used for label objects. Further information can be found in the API
documentation.
Step 7: storing files, upload to Open-link virtuoso store
User input to write a specific newly created data cube model to a file
String: filename (“the data_cube example”).
String filetype (“TURTLE”), [RDF/XML,RDF/XML-ABBREV,TURTLE, N-TRIPLE, N3].
User input to write a specific newly created data cube model file to a virtuoso store
String: filename (“the data_cube example.rdf”).
String: graphname(“the_data_cube_example”)
String:virtuosoaddress(“localhost”)
String:username(“dba”)
String:password(“dba”)
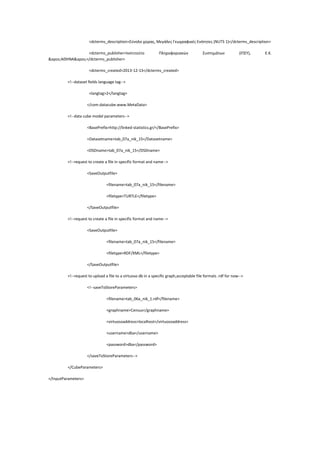
XML properties
Last software update has made possible the use of an xml to define parameters
mentioned above only in one file called properties.xml. Next step is to run
XML_input_Main_App class to use the tool. Parameters names have several changes so this
style of running will be explained to the next section(ELSTAT case studies) through 3 real
examples with el.stat. files.](https://image.slidesharecdn.com/a56287c7-0c07-479c-a0f1-fe854d72541d-150525223704-lva1-app6892/85/Cube_it-_software_report_for_IMIS-21-320.jpg)