Downloaded 28 times


![Policy on preventing flooding
• Nationaal Bestuursakkoord Water (2003)
Use of land Flooding Rainfall
[1/year]
Grass 5 percent 1/10
Agriculture 1 percent 1/25
Horticulture 1 percent 1/50
Cultivation under glass 1 percent 1/50
Urban Area 0 percent 1/100
2](https://image.slidesharecdn.com/cu078213precipitationandevapotranspiration-150825111942-lva1-app6892/75/Cu07821-3-precipitation-and-evapotranspiration-8-2048.jpg)
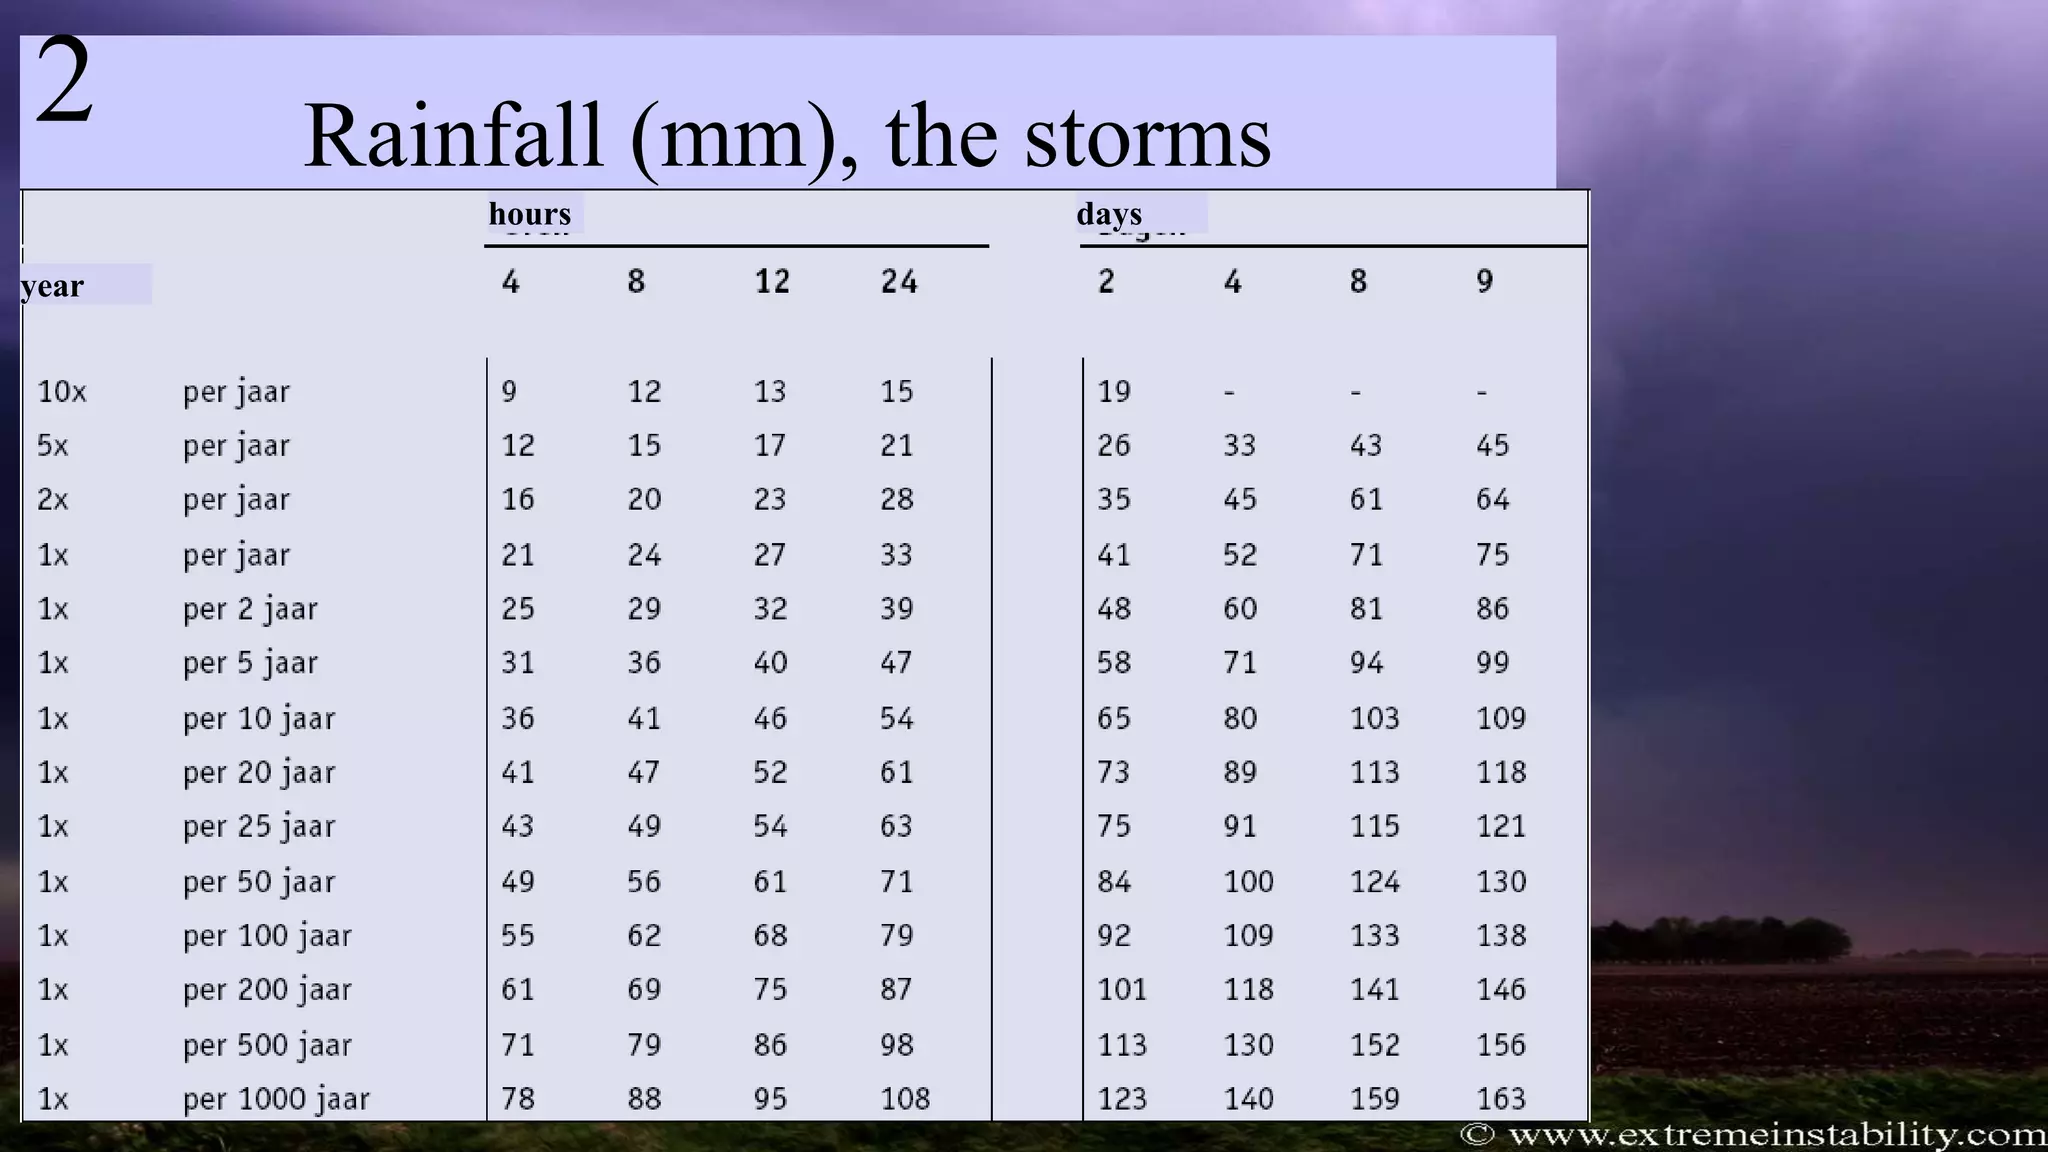


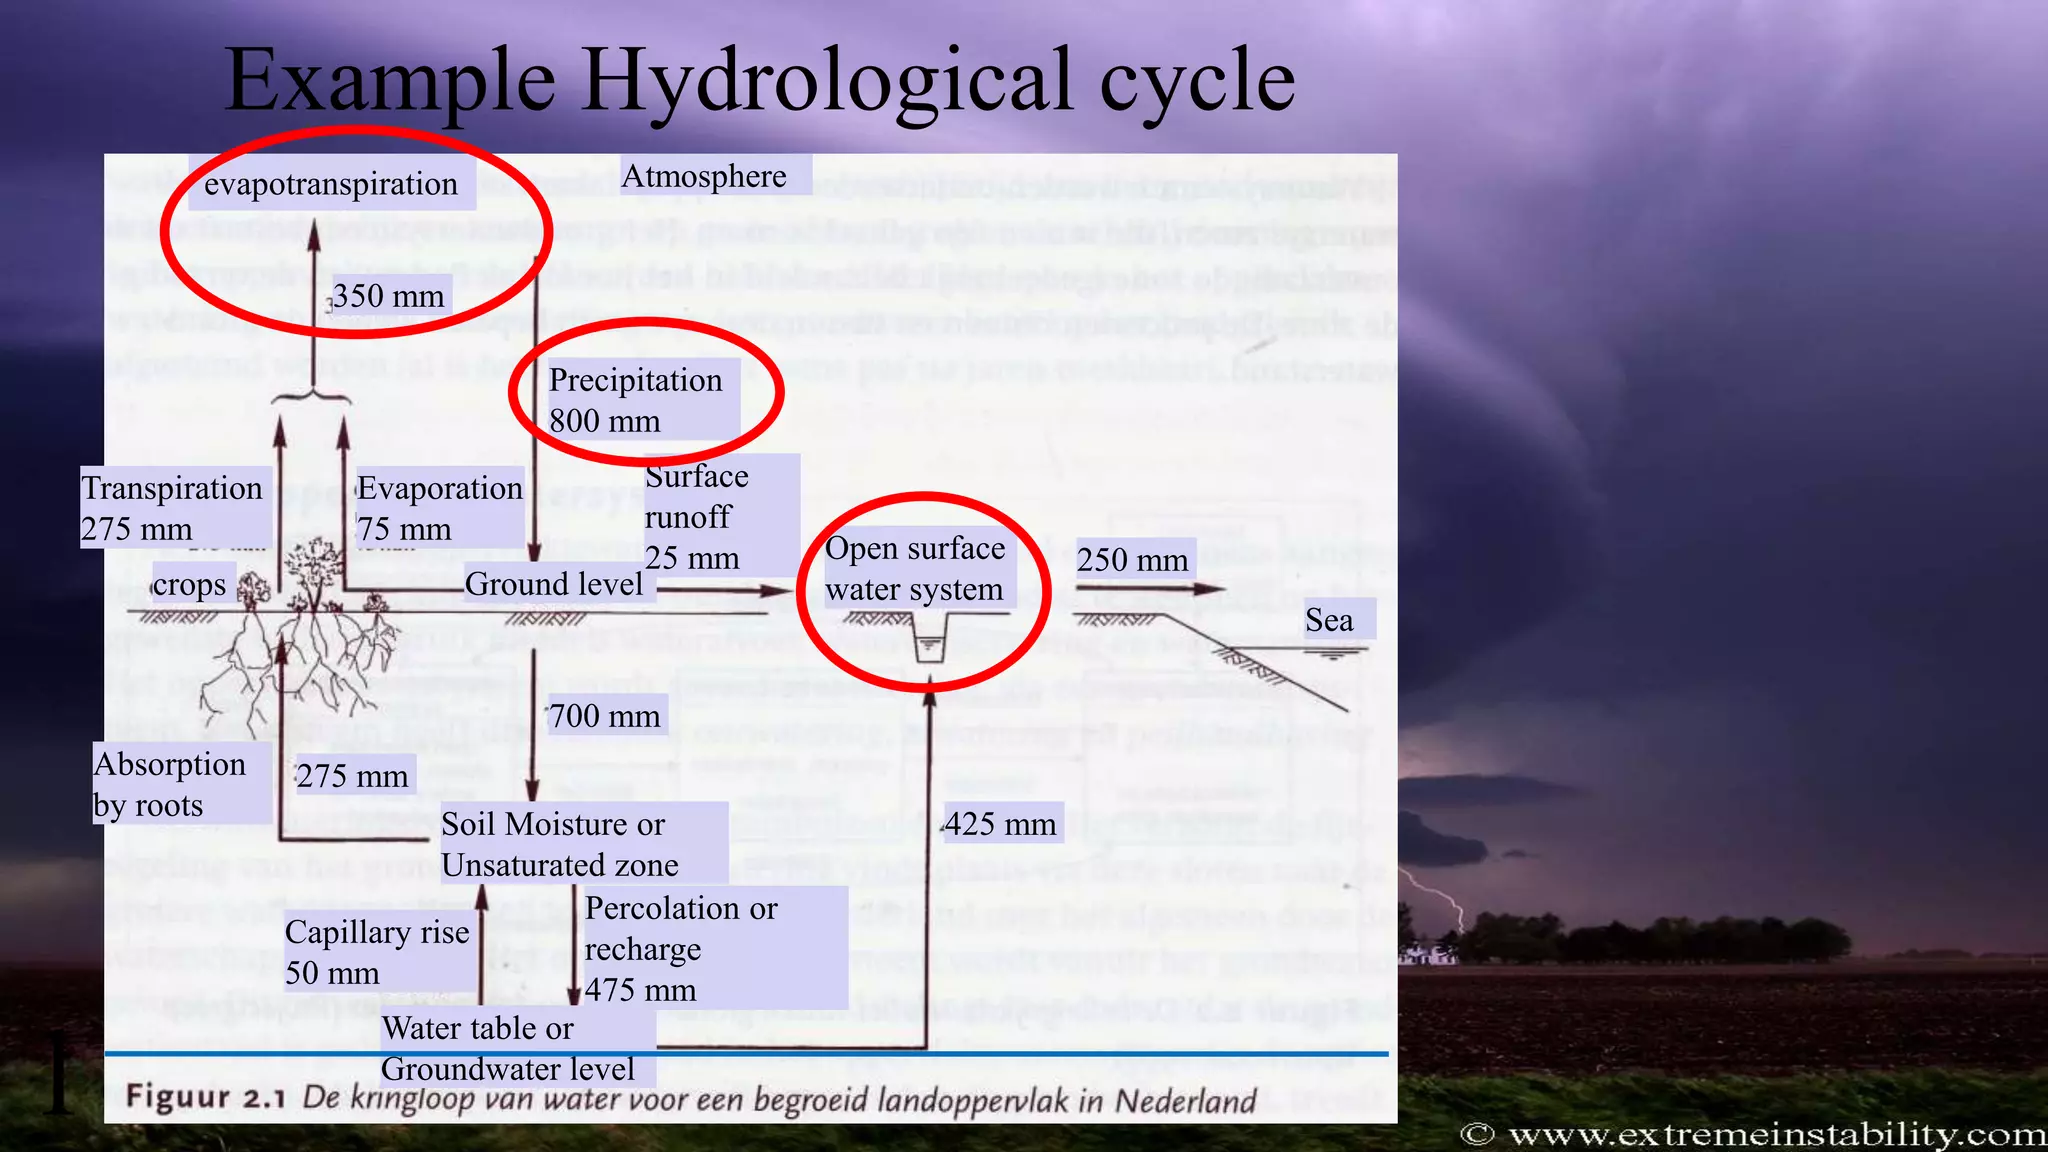
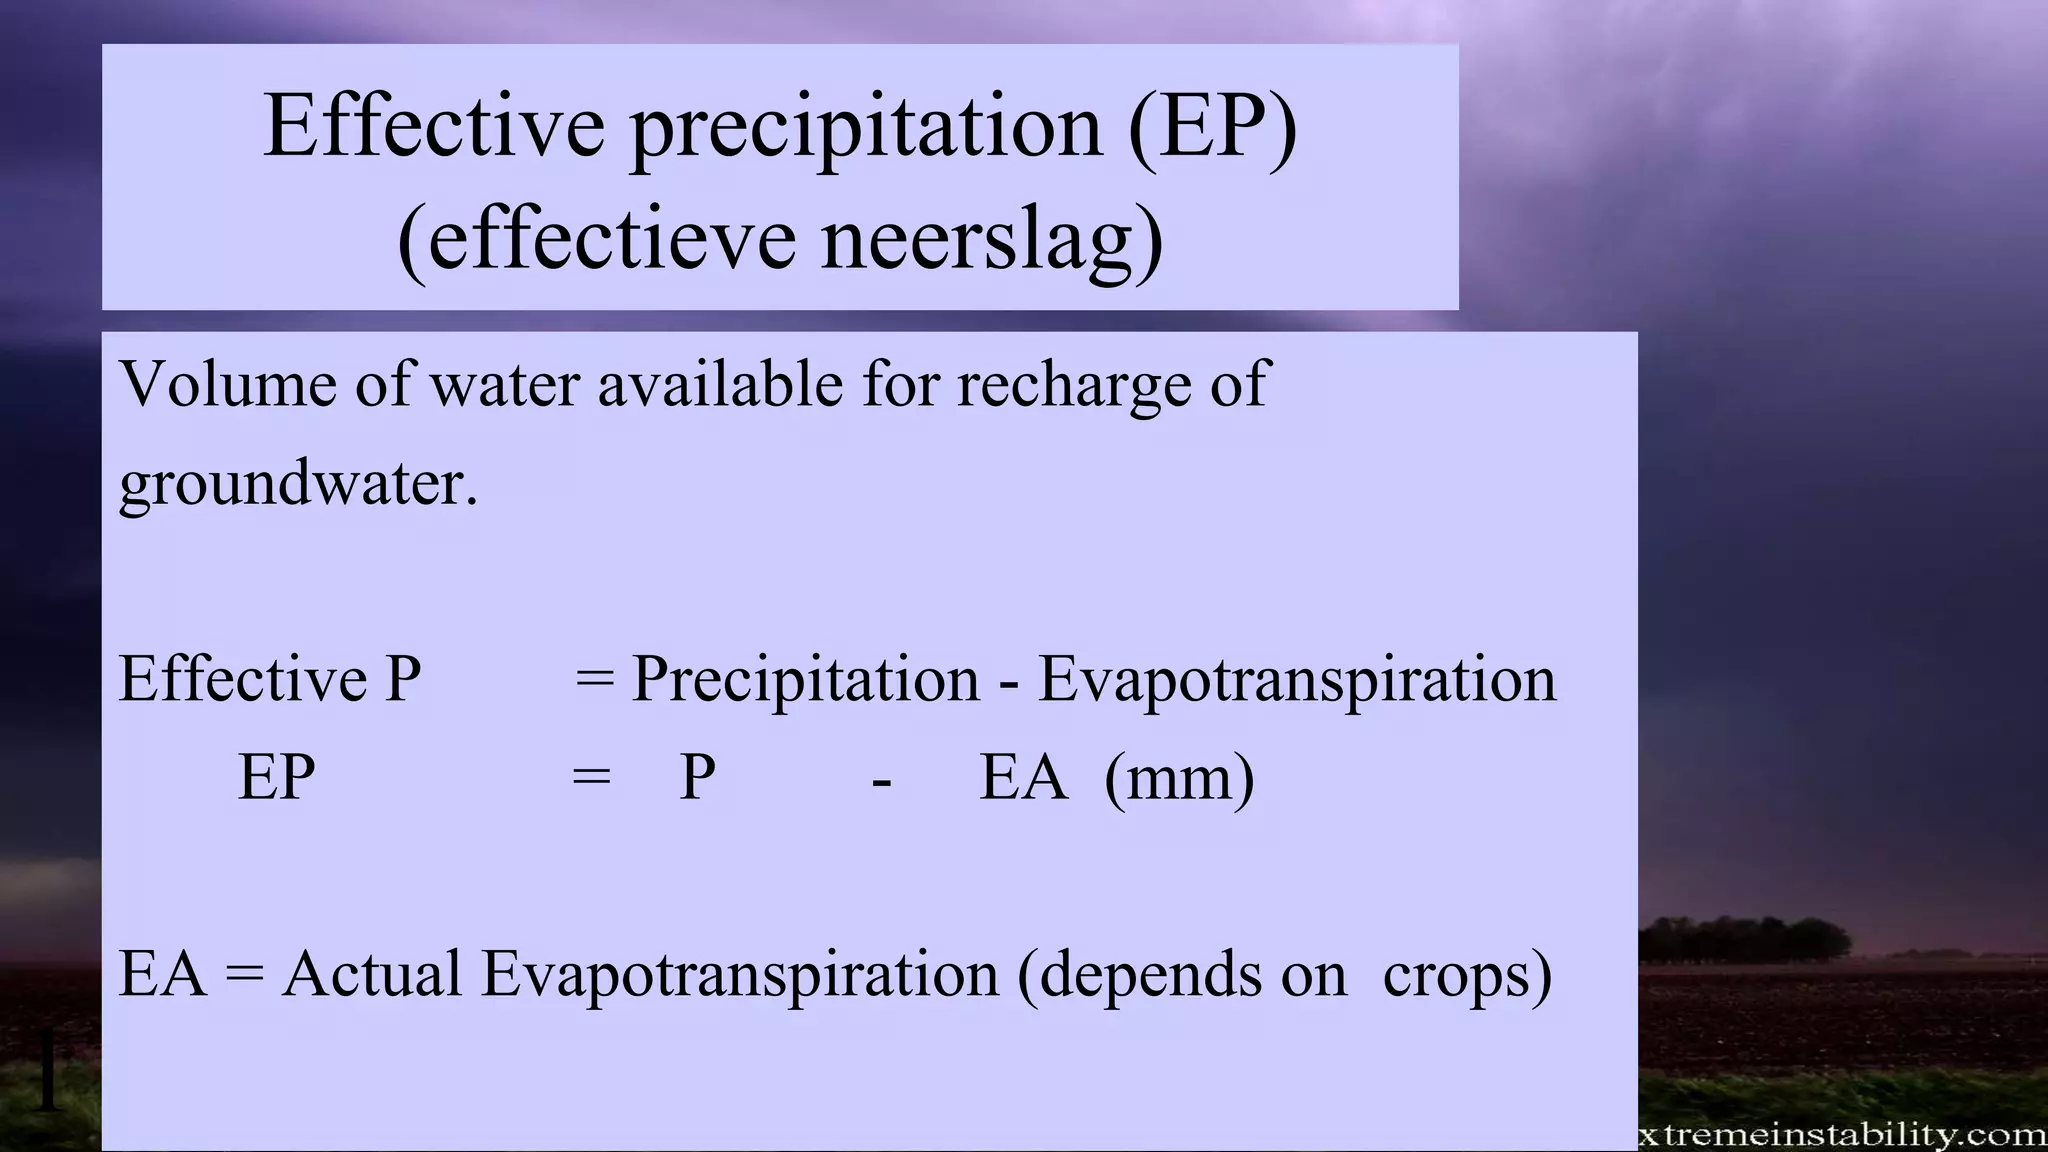
1. The hydrological cycle diagram shows the annual water balance for an area, with 800 mm of precipitation, 350 mm of evapotranspiration, 425 mm of surface runoff, and 475 mm of groundwater recharge. 2. Effective precipitation is defined as the volume of precipitation available for groundwater recharge, and is calculated as total precipitation minus actual evapotranspiration, which depends on crop type. 3. Extreme precipitation events like the 1998 "Westlandbui" storm that dropped 100 mm of rain in 24 hours can cause hundreds of millions of euros in flood damage.


