Magnolia 77354 market report collection january 2013
Weekly Market Recap
1. MARKET Weekly Market Recap
INSIGHTS December 12, 2011
Friday Prior Year Year Friday Prior Year Year
Close Week End Ago Close Week End Ago
Headlines Index Levels 12/9/11 12/2/11 12/31/10 12/9/10 Consumer Rates 12/9/11 12/2/11 12/31/10 12/9/10
• Ratings agencies warned of downgrades in Europe. Dow Jones 30 12,184 12,019 11,578 11,370 6 Month CD 0.64 0.63 0.41 0.41
Economic News S&P 500 1,255 1,244 1,258 1,233 30 Year Mortgage 4.18 4.21 4.82 4.66
• Jobless claims fell more than expected to 381,000. Nasdaq 2,647 2,627 2,653 2,617 Prime Rate 3.25 3.25 3.25 3.25
• ISM Non-Mfg. index ticked down to 52.0. Russell 2000 745 735 784 768
Commodities
• Oct. trade balance moved down to $-43.5bn. Bond Rates Gold 1709.00 1747.00 1405.50 1391.25
• Next week: retail sales, inventories, IP, CPI & FOMC Fed Funds Target 0.25 0.25 0.25 0.25 Crude Oil 99.41 100.96 89.84 88.37
meeting. 2 Year Treasury 0.23 0.25 0.60 0.63 Gasoline 3.29 3.31 3.05 2.96
Thought of the Week 10 Year Treasury 2.05 2.04 3.30 3.23
10 Year Municipal 2.60 2.81 3.75 3.55 Currency
A recent intensification of stress in the global financial $ per € 1.34 1.34 1.34 1.32
system, most evident in the skyrocketing cost and High Yield 8.58 8.70 7.51 7.67
$ per £ 1.56 1.56 1.57 1.57
deteriorated ability of European banks and sovereigns
¥ per $ 77.62 77.95 81.11 83.95
to borrow in private markets, has resulted in a call to 1 week YTD
action for policymakers the world over. As we show in Market Returns Local USD Local USD Wtd Avg
this week’s chart, global central banks have begun to S&P 500 0.91 0.91 1.79 1.79 Index P/E P/E Dividend Mkt Cap
respond to the tightening credit conditions, moderating MSCI - EAFE -0.68 -0.88 -11.63 -10.83 Characteristics Forward Trailing Yield (billions)
growth and easing inflation pressures by lowering key United Kingdom -0.39 -0.43 -2.59 -2.82 S&P 500 12.03 14.76 2.20 93.10
policy interest rates in both the developed and Europe ex-UK -0.13 -0.57 -12.60 -12.85 Russell 1000 Value 10.95 12.98 2.63 71.44
emerging world. Central banks have also taken a Japan -1.06 -0.64 -17.53 -13.83 Russell 1000 Growth 13.73 15.99 1.60 94.19
number of unconventional steps to ease policy and Asia ex-Japan -2.46 -3.16 -12.58 -14.24 Russell 2000 17.39 22.85 1.46 1.24
given the prospect of lower inflation around the world, a
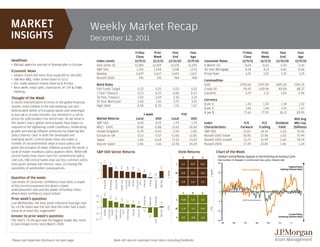
cycle of easier monetary policy appears likely. While EM S&P 500 Sector Returns Style Returns Chart of the Week
central banks have more room for conventional policy V B G Global Central Banks Appear to be Entering an Easing Cycle
rate cuts, DM central banks may use less common policy Net number of changes in central bank key policy interest rate
1.7
2 18
tools given already low interest rates, increasing the L 1.1 0.9 0.5
1.4
Tighter Policy
0.9
0.9
0.9
possibility of unintended consequences.
0.8
0.8
0.7
EM Central Banks (raising interest rates)
1
0.5
1 week
1 week
M 0.5 0.2 -0.2 12
0.1
0.0
Question of the week: 0
Financials
Technology
Industrials
Health Care
Consumer
Staples
Utilities
Consumer
Discr.
Telecom
Energy
Materials
S&P 500
Low levels of consumer confidence have been a staple S 1.4 1.4 1.5 6
of the current expansion but given a lower
unemployment rate and the power of holiday cheer,
0
where does confidence stand today? V B G
15.5
20
11.2
Industrials
Financials
Prior week's question:
Materials
9.2
L -0.8 1.8 3.3
6.4
DM Central Banks
5.2
-6
5.1
10
Last Wednesday, the Dow Jones Industrial Average rose
2.4
1.8
by +4.2%; when was the last time the index had a daily
YTD
0
YTD
M -2.4 -1.5 -0.4
move of at least this magnitude?
Utilities
Consumer
Staples
Health Care
Consumer
Discr.
Technology
Energy
Telecom
S&P 500
-12
-1.1
-10 Looser Policy
Answer to prior week's question:
-9.1
S -6.1 -3.8 -1.4 (lowering interest rates)
The Dow’s +4.2% gain was the biggest single day move -20
-16.8
-18
'05 '06 '07 '08 '09 '10 '11
in percentage terms since March 2009.
Please see important disclosure on next page. Note: All returns represent total return including dividends.