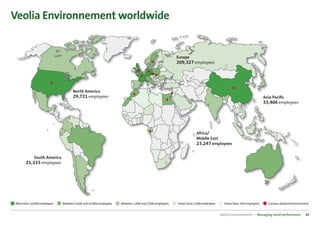
Veolia Environnement is a global leader in environmental solutions operating in 77 countries. It provides water, waste, and energy management services to both public and private sector clients.
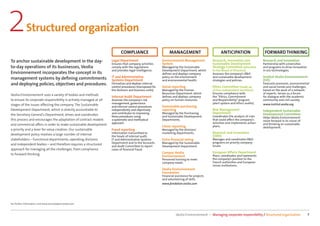
The company is committed to sustainable development and has established governance structures and policies to manage corporate social responsibility. These include an "Ethics, Commitment and Responsibility" program, sustainable development charter, and risk management processes.
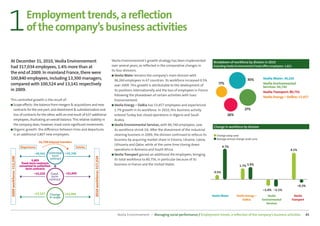
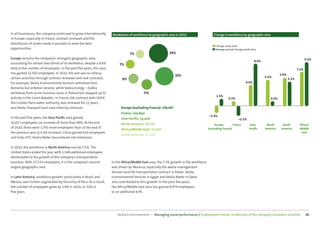
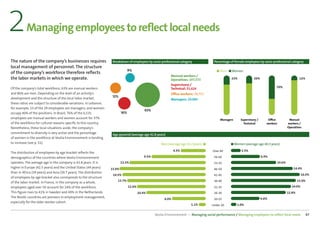
Veolia aims to integrate sustainability into its business activities through innovation, social business models, and measuring environmental and social performance indicators. It works with partners and stakeholders to advance access to basic services and combat issues like climate change and resource depletion.