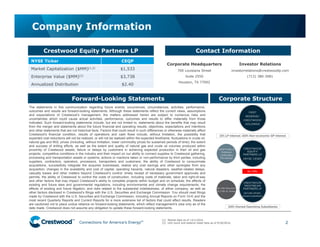
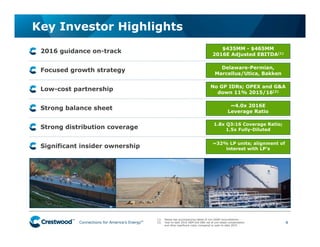
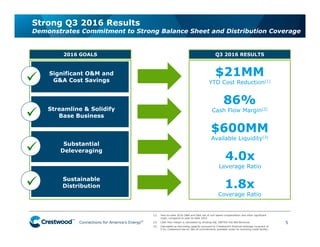
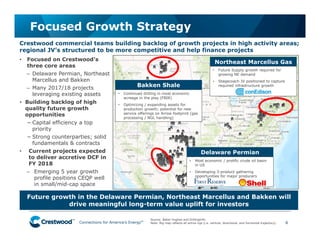
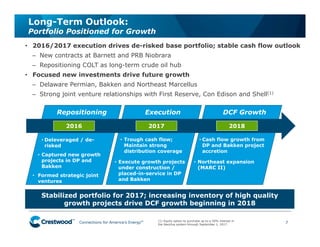
The document discusses Crestwood Midstream Partners LP and Crestwood Equity Partners LP. It provides an investor presentation covering key highlights, including 2016 guidance being on track, a focused growth strategy, a strong balance sheet, and significant insider ownership. It summarizes recent financial results and outlines the company's long-term outlook, focusing on growth opportunities in the Delaware Permian Basin, Northeast Marcellus shale, and Bakken shale plays.