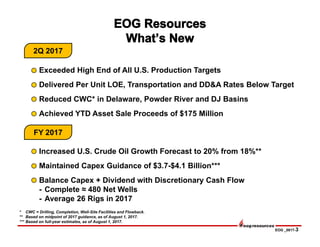
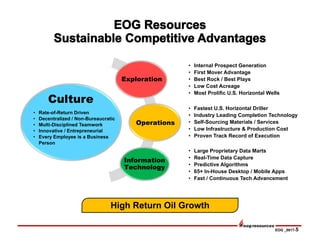
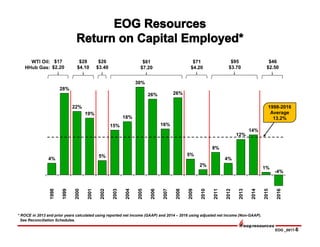
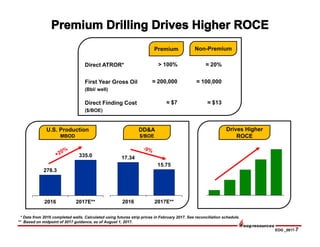
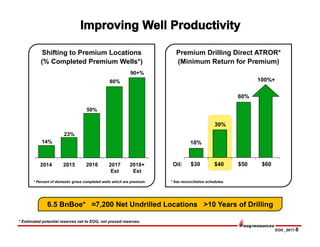
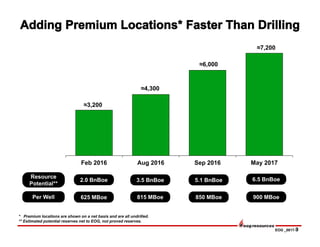
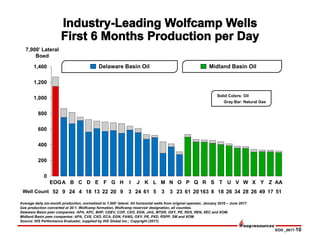
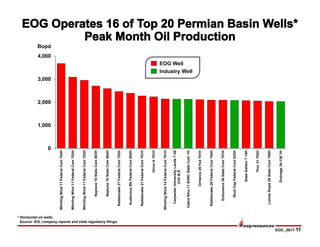
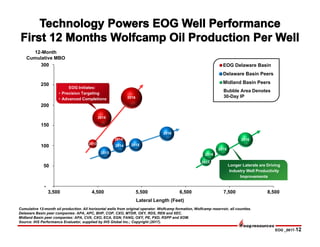
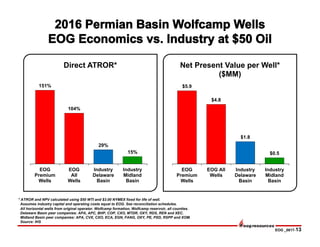
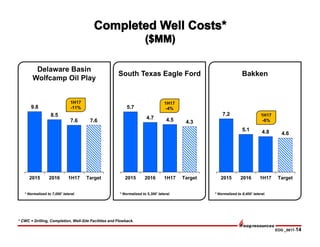
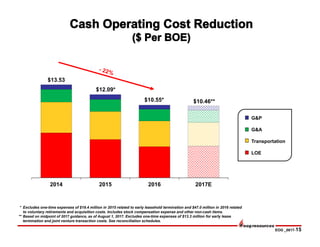
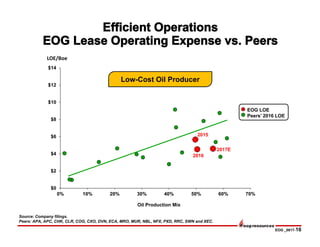
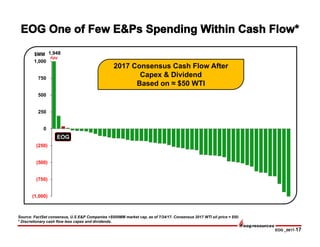
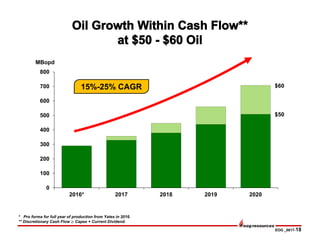
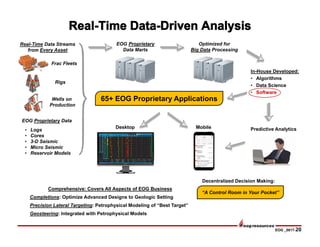
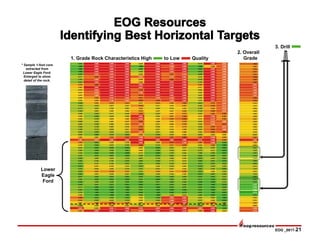
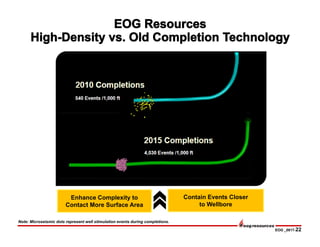
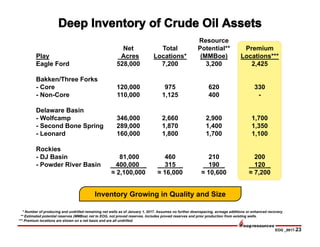
This document provides information about EOG Resources, Inc. (EOG), an oil and gas exploration and production company. It lists EOG's stock symbol and dividend, shares outstanding, and investor relations contacts. It also contains cautionary statements about forward-looking estimates and reserves, describes EOG's strategy of focusing on high-return oil growth through premium drilling locations and technological advantages, and provides production and well performance data to demonstrate EOG's leading position.
Rex Energy Corporate Presentation May 2013 - Including Upper Devonian DetailsMarcellus Drilling News
Rex Energy's May 2013 Corporate Presentation for investors. Slides 16 & 28 show details about Rex's Upper Devonian drilling activities. The Upper Devonian is a relatively new phenomenon in the northeast. The UD layer sits a few hundred feet above the Marcellus Shale layer and drillers are adopting a stacked play strategy of drilling the UD, Marcellus and Utica Shale--all in the same well bore.
Premium MEAN Stack Development Solutions for Modern BusinessesSynapseIndia
Stay ahead of the curve with our premium MEAN Stack Development Solutions. Our expert developers utilize MongoDB, Express.js, AngularJS, and Node.js to create modern and responsive web applications. Trust us for cutting-edge solutions that drive your business growth and success.
Know more: https://www.synapseindia.com/technology/mean-stack-development-company.html
Unveiling the Secrets How Does Generative AI Work.pdfSam H
At its core, generative artificial intelligence relies on the concept of generative models, which serve as engines that churn out entirely new data resembling their training data. It is like a sculptor who has studied so many forms found in nature and then uses this knowledge to create sculptures from his imagination that have never been seen before anywhere else. If taken to cyberspace, gans work almost the same way.
Personal Brand Statement:
As an Army veteran dedicated to lifelong learning, I bring a disciplined, strategic mindset to my pursuits. I am constantly expanding my knowledge to innovate and lead effectively. My journey is driven by a commitment to excellence, and to make a meaningful impact in the world.
India Orthopedic Devices Market: Unlocking Growth Secrets, Trends and Develop...Kumar Satyam
According to TechSci Research report, “India Orthopedic Devices Market -Industry Size, Share, Trends, Competition Forecast & Opportunities, 2030”, the India Orthopedic Devices Market stood at USD 1,280.54 Million in 2024 and is anticipated to grow with a CAGR of 7.84% in the forecast period, 2026-2030F. The India Orthopedic Devices Market is being driven by several factors. The most prominent ones include an increase in the elderly population, who are more prone to orthopedic conditions such as osteoporosis and arthritis. Moreover, the rise in sports injuries and road accidents are also contributing to the demand for orthopedic devices. Advances in technology and the introduction of innovative implants and prosthetics have further propelled the market growth. Additionally, government initiatives aimed at improving healthcare infrastructure and the increasing prevalence of lifestyle diseases have led to an upward trend in orthopedic surgeries, thereby fueling the market demand for these devices.
Memorandum Of Association Constitution of Company.pptseri bangash
www.seribangash.com
A Memorandum of Association (MOA) is a legal document that outlines the fundamental principles and objectives upon which a company operates. It serves as the company's charter or constitution and defines the scope of its activities. Here's a detailed note on the MOA:
Contents of Memorandum of Association:
Name Clause: This clause states the name of the company, which should end with words like "Limited" or "Ltd." for a public limited company and "Private Limited" or "Pvt. Ltd." for a private limited company.
https://seribangash.com/article-of-association-is-legal-doc-of-company/
Registered Office Clause: It specifies the location where the company's registered office is situated. This office is where all official communications and notices are sent.
Objective Clause: This clause delineates the main objectives for which the company is formed. It's important to define these objectives clearly, as the company cannot undertake activities beyond those mentioned in this clause.
www.seribangash.com
Liability Clause: It outlines the extent of liability of the company's members. In the case of companies limited by shares, the liability of members is limited to the amount unpaid on their shares. For companies limited by guarantee, members' liability is limited to the amount they undertake to contribute if the company is wound up.
https://seribangash.com/promotors-is-person-conceived-formation-company/
Capital Clause: This clause specifies the authorized capital of the company, i.e., the maximum amount of share capital the company is authorized to issue. It also mentions the division of this capital into shares and their respective nominal value.
Association Clause: It simply states that the subscribers wish to form a company and agree to become members of it, in accordance with the terms of the MOA.
Importance of Memorandum of Association:
Legal Requirement: The MOA is a legal requirement for the formation of a company. It must be filed with the Registrar of Companies during the incorporation process.
Constitutional Document: It serves as the company's constitutional document, defining its scope, powers, and limitations.
Protection of Members: It protects the interests of the company's members by clearly defining the objectives and limiting their liability.
External Communication: It provides clarity to external parties, such as investors, creditors, and regulatory authorities, regarding the company's objectives and powers.
https://seribangash.com/difference-public-and-private-company-law/
Binding Authority: The company and its members are bound by the provisions of the MOA. Any action taken beyond its scope may be considered ultra vires (beyond the powers) of the company and therefore void.
Amendment of MOA:
While the MOA lays down the company's fundamental principles, it is not entirely immutable. It can be amended, but only under specific circumstances and in compliance with legal procedures. Amendments typically require shareholder
What is the TDS Return Filing Due Date for FY 2024-25.pdfseoforlegalpillers
It is crucial for the taxpayers to understand about the TDS Return Filing Due Date, so that they can fulfill your TDS obligations efficiently. Taxpayers can avoid penalties by sticking to the deadlines and by accurate filing of TDS. Timely filing of TDS will make sure about the availability of tax credits. You can also seek the professional guidance of experts like Legal Pillers for timely filing of the TDS Return.
RMD24 | Debunking the non-endemic revenue myth Marvin Vacquier Droop | First ...BBPMedia1
Marvin neemt je in deze presentatie mee in de voordelen van non-endemic advertising op retail media netwerken. Hij brengt ook de uitdagingen in beeld die de markt op dit moment heeft op het gebied van retail media voor niet-leveranciers.
Retail media wordt gezien als het nieuwe advertising-medium en ook mediabureaus richten massaal retail media-afdelingen op. Merken die niet in de betreffende winkel liggen staan ook nog niet in de rij om op de retail media netwerken te adverteren. Marvin belicht de uitdagingen die er zijn om echt aansluiting te vinden op die markt van non-endemic advertising.
Improving profitability for small businessBen Wann
In this comprehensive presentation, we will explore strategies and practical tips for enhancing profitability in small businesses. Tailored to meet the unique challenges faced by small enterprises, this session covers various aspects that directly impact the bottom line. Attendees will learn how to optimize operational efficiency, manage expenses, and increase revenue through innovative marketing and customer engagement techniques.
What are the main advantages of using HR recruiter services.pdfHumanResourceDimensi1
HR recruiter services offer top talents to companies according to their specific needs. They handle all recruitment tasks from job posting to onboarding and help companies concentrate on their business growth. With their expertise and years of experience, they streamline the hiring process and save time and resources for the company.
[Note: This is a partial preview. To download this presentation, visit:
https://www.oeconsulting.com.sg/training-presentations]
Sustainability has become an increasingly critical topic as the world recognizes the need to protect our planet and its resources for future generations. Sustainability means meeting our current needs without compromising the ability of future generations to meet theirs. It involves long-term planning and consideration of the consequences of our actions. The goal is to create strategies that ensure the long-term viability of People, Planet, and Profit.
Leading companies such as Nike, Toyota, and Siemens are prioritizing sustainable innovation in their business models, setting an example for others to follow. In this Sustainability training presentation, you will learn key concepts, principles, and practices of sustainability applicable across industries. This training aims to create awareness and educate employees, senior executives, consultants, and other key stakeholders, including investors, policymakers, and supply chain partners, on the importance and implementation of sustainability.
LEARNING OBJECTIVES
1. Develop a comprehensive understanding of the fundamental principles and concepts that form the foundation of sustainability within corporate environments.
2. Explore the sustainability implementation model, focusing on effective measures and reporting strategies to track and communicate sustainability efforts.
3. Identify and define best practices and critical success factors essential for achieving sustainability goals within organizations.
CONTENTS
1. Introduction and Key Concepts of Sustainability
2. Principles and Practices of Sustainability
3. Measures and Reporting in Sustainability
4. Sustainability Implementation & Best Practices
To download the complete presentation, visit: https://www.oeconsulting.com.sg/training-presentations
Enterprise Excellence is Inclusive Excellence.pdfKaiNexus
Enterprise excellence and inclusive excellence are closely linked, and real-world challenges have shown that both are essential to the success of any organization. To achieve enterprise excellence, organizations must focus on improving their operations and processes while creating an inclusive environment that engages everyone. In this interactive session, the facilitator will highlight commonly established business practices and how they limit our ability to engage everyone every day. More importantly, though, participants will likely gain increased awareness of what we can do differently to maximize enterprise excellence through deliberate inclusion.
What is Enterprise Excellence?
Enterprise Excellence is a holistic approach that's aimed at achieving world-class performance across all aspects of the organization.
What might I learn?
A way to engage all in creating Inclusive Excellence. Lessons from the US military and their parallels to the story of Harry Potter. How belt systems and CI teams can destroy inclusive practices. How leadership language invites people to the party. There are three things leaders can do to engage everyone every day: maximizing psychological safety to create environments where folks learn, contribute, and challenge the status quo.
Who might benefit? Anyone and everyone leading folks from the shop floor to top floor.
Dr. William Harvey is a seasoned Operations Leader with extensive experience in chemical processing, manufacturing, and operations management. At Michelman, he currently oversees multiple sites, leading teams in strategic planning and coaching/practicing continuous improvement. William is set to start his eighth year of teaching at the University of Cincinnati where he teaches marketing, finance, and management. William holds various certifications in change management, quality, leadership, operational excellence, team building, and DiSC, among others.
Accpac to QuickBooks Conversion Navigating the Transition with Online Account...PaulBryant58
This article provides a comprehensive guide on how to
effectively manage the convert Accpac to QuickBooks , with a particular focus on utilizing online accounting services to streamline the process.
Accpac to QuickBooks Conversion Navigating the Transition with Online Account...
Eog 0817
1. NYSE Stock Symbol: EOG
Common Dividend: $0.67
Common Shares Outstanding: 577 Million
Internet Address:
http://www.eogresources.com
2Q 2017
Investor Relations Contacts
David J. Streit, Vice President IR/PR
(713) 571-4902, dstreit@eogresources.com
Kimberly M. Ehmer, Director IR/PR
(713) 571-4676, kehmer@eogresources.com
W. John Wagner, Engineer IR
(713) 571-4404, wjwagner@eogresources.com
2. Copyright; Assumption of Risk: Copyright 2017. This presentation and the contents of this presentation have been copyrighted by EOG Resources, Inc. (EOG). All rights reserved. Copying of the presentation is
forbidden without the prior written consent of EOG. Information in this presentation is provided “as is” without warranty of any kind, either express or implied, including but not limited to the implied warranties of
merchantability, fitness for a particular purpose and the timeliness of the information. You assume all risk in using the information. In no event shall EOG or its representatives be liable for any special, indirect or
consequential damages resulting from the use of the information.
Cautionary Notice Regarding Forward-Looking Statements: This presentation includes forward-looking statements within the meaning of Section 27A of the Securities Act of 1933, as amended, and Section 21E of the
Securities Exchange Act of 1934, as amended. All statements, other than statements of historical facts, including, among others, statements and projections regarding EOG's future financial position, operations,
performance, business strategy, returns, budgets, reserves, levels of production, costs and asset sales, statements regarding future commodity prices and statements regarding the plans and objectives of EOG's
management for future operations, are forward-looking statements. EOG typically uses words such as "expect," "anticipate," "estimate," "project," "strategy," "intend," "plan," "target," "goal," "may," "will," "should" and
"believe" or the negative of those terms or other variations or comparable terminology to identify its forward-looking statements. In particular, statements, express or implied, concerning EOG's future operating results
and returns or EOG's ability to replace or increase reserves, increase production, reduce or otherwise control operating and capital costs, generate income or cash flows or pay dividends are forward-looking statements.
Forward-looking statements are not guarantees of performance. Although EOG believes the expectations reflected in its forward-looking statements are reasonable and are based on reasonable assumptions, no
assurance can be given that these assumptions are accurate or that any of these expectations will be achieved (in full or at all) or will prove to have been correct. Moreover, EOG's forward-looking statements may be
affected by known, unknown or currently unforeseen risks, events or circumstances that may be outside EOG's control. Important factors that could cause EOG's actual results to differ materially from the expectations
reflected in EOG's forward-looking statements include, among others:
• the timing, extent and duration of changes in prices for, supplies of, and demand for, crude oil and condensate, natural gas liquids, natural gas and related commodities;
• the extent to which EOG is successful in its efforts to acquire or discover additional reserves;
• the extent to which EOG is successful in its efforts to economically develop its acreage in, produce reserves and achieve anticipated production levels from, and maximize reserve recovery from, its existing and future
crude oil and natural gas exploration and development projects;
• the extent to which EOG is successful in its efforts to market its crude oil and condensate, natural gas liquids, natural gas and related commodity production;
• the availability, proximity and capacity of, and costs associated with, appropriate gathering, processing, compression, transportation and refining facilities;
• the availability, cost, terms and timing of issuance or execution of, and competition for, mineral licenses and leases and governmental and other permits and rights-of-way, and EOG’s ability to retain mineral licenses
and leases;
• the impact of, and changes in, government policies, laws and regulations, including tax laws and regulations; environmental, health and safety laws and regulations relating to air emissions, disposal of produced
water, drilling fluids and other wastes, hydraulic fracturing and access to and use of water; laws and regulations imposing conditions or restrictions on drilling and completion operations and on the transportation of
crude oil and natural gas; laws and regulations with respect to derivatives and hedging activities; and laws and regulations with respect to the import and export of crude oil, natural gas and related commodities;
• EOG's ability to effectively integrate acquired crude oil and natural gas properties into its operations, fully identify existing and potential problems with respect to such properties and accurately estimate reserves,
production and costs with respect to such properties;
• the extent to which EOG's third-party-operated crude oil and natural gas properties are operated successfully and economically;
• competition in the oil and gas exploration and production industry for the acquisition of licenses, leases and properties, employees and other personnel, facilities, equipment, materials and services;
• the availability and cost of employees and other personnel, facilities, equipment, materials (such as water) and services;
• the accuracy of reserve estimates, which by their nature involve the exercise of professional judgment and may therefore be imprecise;
• weather, including its impact on crude oil and natural gas demand, and weather-related delays in drilling and in the installation and operation (by EOG or third parties) of production, gathering, processing, refining,
compression and transportation facilities;
• the ability of EOG's customers and other contractual counterparties to satisfy their obligations to EOG and, related thereto, to access the credit and capital markets to obtain financing needed to satisfy their
obligations to EOG;
• EOG's ability to access the commercial paper market and other credit and capital markets to obtain financing on terms it deems acceptable, if at all, and to otherwise satisfy its capital expenditure requirements;
• the extent to which EOG is successful in its completion of planned asset dispositions;
• the extent and effect of any hedging activities engaged in by EOG;
• the timing and extent of changes in foreign currency exchange rates, interest rates, inflation rates, global and domestic financial market conditions and global and domestic general economic conditions;
• political conditions and developments around the world (such as political instability and armed conflict), including in the areas in which EOG operates;
• the use of competing energy sources and the development of alternative energy sources;
• the extent to which EOG incurs uninsured losses and liabilities or losses and liabilities in excess of its insurance coverage;
• acts of war and terrorism and responses to these acts;
• physical, electronic and cyber security breaches; and
• the other factors described under ITEM 1A, Risk Factors, on pages 13 through 22 of EOG’s Annual Report on Form 10-K for the fiscal year ended December 31, 2016 and any updates to those factors set forth in EOG's
subsequent Quarterly Reports on Form 10-Q or Current Reports on Form 8-K.
In light of these risks, uncertainties and assumptions, the events anticipated by EOG's forward-looking statements may not occur, and, if any of such events do, we may not have anticipated the timing of their occurrence
or the duration and extent of their impact on our actual results. Accordingly, you should not place any undue reliance on any of EOG's forward-looking statements. EOG's forward-looking statements speak only as of the
date made, and EOG undertakes no obligation, other than as required by applicable law, to update or revise its forward-looking statements, whether as a result of new information, subsequent events, anticipated or
unanticipated circumstances or otherwise.
Oil and Gas Reserves; Non-GAAP Financial Measures: The United States Securities and Exchange Commission (SEC) permits oil and gas companies, in their filings with the SEC, to disclose not only “proved” reserves
(i.e., quantities of oil and gas that are estimated to be recoverable with a high degree of confidence), but also “probable” reserves (i.e., quantities of oil and gas that are as likely as not to be recovered) as well as
“possible” reserves (i.e., additional quantities of oil and gas that might be recovered, but with a lower probability than probable reserves). Statements of reserves are only estimates and may not correspond to the
ultimate quantities of oil and gas recovered. Any reserve estimates provided in this presentation that are not specifically designated as being estimates of proved reserves may include "potential" reserves and/or other
estimated reserves not necessarily calculated in accordance with, or contemplated by, the SEC’s latest reserve reporting guidelines. Investors are urged to consider closely the disclosure in EOG’s Annual Report on
Form 10-K for the fiscal year ended December 31, 2016, available from EOG at P.O. Box 4362, Houston, Texas 77210-4362 (Attn: Investor Relations). You can also obtain this report from the SEC by calling 1-800-SEC-0330
or from the SEC's website at www.sec.gov. In addition, reconciliation and calculation schedules for non-GAAP financial measures can be found on the EOG website at www.eogresources.com.
3. EOG _0817-3
Exceeded High End of All U.S. Production Targets
Delivered Per Unit LOE, Transportation and DD&A Rates Below Target
Reduced CWC* in Delaware, Powder River and DJ Basins
Achieved YTD Asset Sale Proceeds of $175 Million
Increased U.S. Crude Oil Growth Forecast to 20% from 18%**
Maintained Capex Guidance of $3.7-$4.1 Billion***
Balance Capex + Dividend with Discretionary Cash Flow
- Complete ≈ 480 Net Wells
- Average 26 Rigs in 2017
* CWC = Drilling, Completion, Well-Site Facilities and Flowback.
** Based on midpoint of 2017 guidance, as of August 1, 2017.
*** Based on full-year estimates, as of August 1, 2017.
2Q 2017
FY 2017
4. EOG _0817-4
U.S. Leader in Return on Capital Employed
U.S. Oil Growth Leader
Among Lowest Cost Producers in Global Oil Market
Commitment to Safety and the Environment
Create Significant Long-Term Shareholder Value
5. EOG _0817-5
High Return Oil Growth
• Fastest U.S. Horizontal Driller
• Industry Leading Completion Technology
• Self-Sourcing Materials / Services
• Low Infrastructure & Production Cost
• Proven Track Record of Execution
• Internal Prospect Generation
• First Mover Advantage
• Best Rock / Best Plays
• Low Cost Acreage
• Most Prolific U.S. Horizontal Wells
• Large Proprietary Data Marts
• Real-Time Data Capture
• Predictive Algorithms
• 65+ In-House Desktop / Mobile Apps
• Fast / Continuous Tech Advancement
Exploration
Operations
Information
Technology
• Rate-of-Return Driven
• Decentralized / Non-Bureaucratic
• Multi-Disciplined Teamwork
• Innovative / Entrepreneurial
• Every Employee is a Business
Person
Culture
6. EOG _0817-6
WTI Oil:
HHub Gas:
4%
28%
22%
19%
5%
15%
18%
30%
26%
16%
26%
5%
2%
8%
4%
12%
14%
1%
-4%
1998
1999
2000
2001
2002
2003
2004
2005
2006
2007
2008
2009
2010
2011
2012
2013
2014
2015
2016
* ROCE in 2013 and prior years calculated using reported net income (GAAP) and 2014 – 2016 using adjusted net income (Non-GAAP).
See Reconciliation Schedules.
$17
$2.20
$28
$4.10
$61
$7.20
$71
$4.20
$95
$3.70
$46
$2.50
$26
$3.40
1998-2016
Average
13.2%
7. EOG _0817-7
278.3
335.0
2016 2017E**
* Data from 2016 completed wells. Calculated using futures strip prices in February 2017. See reconciliation schedule.
** Based on midpoint of 2017 guidance, as of August 1, 2017.
17.34
15.75
2016 2017E**
Non-PremiumPremium
DD&A
$/BOE
U.S. Production
MBOD
Direct ATROR*
First Year Gross Oil
(Bbl/ well)
Direct Finding Cost
($/BOE)
> 100%
≈ 200,000
≈ $7
≈ 20%
≈ 100,000
≈ $13
Drives Higher
ROCE
8. EOG _0817-8
$30 $40 $50 $60
* Percent of domestic gross completed wells which are premium.
14%
23%
50%
80%
2014 2015 2016 2017
Est
2018+
Est
100%+
10%
60%
30%
Oil:
* See reconciliation schedules.
Premium Drilling Direct ATROR*
(Minimum Return for Premium)
Shifting to Premium Locations
(% Completed Premium Wells*)
90+%
* Estimated potential reserves net to EOG, not proved reserves.
6.5 BnBoe* ≈7,200 Net Undrilled Locations >10 Years of Drilling
9. EOG _0817-9
Resource
Potential**
* Premium locations are shown on a net basis and are all undrilled.
** Estimated potential reserves net to EOG, not proved reserves.
Per Well
Feb 2016 Aug 2016 Sep 2016 May 2017
2.0 BnBoe
625 MBoe
3.5 BnBoe
815 MBoe
5.1 BnBoe
850 MBoe
6.5 BnBoe
900 MBoe
≈3,200
≈4,300
≈6,000
≈7,200
10. EOG _0817-10
0
200
400
600
800
1,000
1,200
1,400
EOGA B C D E F G H I J K L M N O P Q R S T U V W X Y Z AA
52 9 24 4 18 13 22 20 9 3 24 61 5 3 3 23 61 20 163 8 18 26 34 28 26 49 17 51
7,000’ Lateral
Boed
Delaware Basin Oil
Average daily six-month production, normalized to 7,000’ lateral. All horizontal wells from original operator, January 2016 – June 2017.
Gas production converted at 20:1. Wolfcamp formation, Wolfcamp reservoir designation, all counties.
Delaware Basin peer companies: APA, APC, BHP, CDEV, COP, CXO, EGN, JAG, MTDR, OXY, PE, RDS, REN, XEC and XOM.
Midland Basin peer companies: APA, CVX, CXO, ECA, EGN, FANG, OXY, PE, PXD, RSPP, SM and XOM.
Source: IHS Performance Evaluator, supplied by IHS Global Inc.; Copyright (2017).
Well Count
Midland Basin Oil
Solid Colors: Oil
Gray Bar: Natural Gas
12. EOG _0817-12
-
50,000
100,000
150,000
200,000
250,000
300,000
3,500 4,500 5,500 6,500 7,500 8,500
EOG Delaware Basin
Delaware Basin Peers
Midland Basin Peers
Lateral Length (Feet)
12-Month
Cumulative MBO
2016
2016
2016
2013
2015
2014
2015
20152014
2014
2013
2013
250
200
150
100
50
300
Longer Laterals are Driving
Industry Well Productivity
Improvements
Bubble Area Denotes
30-Day IP
Cumulative 12-month oil production. All horizontal wells from original operator. Wolfcamp formation, Wolfcamp reservoir, all counties.
Delaware Basin peer companies: APA, APC, BHP, COP, CXO, MTDR, OXY, RDS, REN and XEC.
Midland Basin peer companies: APA, CVX, CXO, ECA, EGN, FANG, OXY, PE, PXD, RSPP and XOM.
Source: IHS Performance Evaluator, supplied by IHS Global Inc.; Copyright (2017).
EOG Initiates:
• Precision Targeting
• Advanced Completions
13. EOG _0817-13
* ATROR and NPV calculated using $50 WTI and $3.00 NYMEX fixed for life of well.
Assumes industry capital and operating costs equal to EOG. See reconciliation schedules.
All horizontal wells from original operator. Wolfcamp formation, Wolfcamp reservoir, all counties.
Delaware Basin peer companies: APA, APC, BHP, COP, CXO, MTDR, OXY, RDS, REN and XEC.
Midland Basin peer companies: APA, CVX, CXO, ECA, EGN, FANG, OXY, PE, PXD, RSPP and XOM.
Source: IHS
Direct ATROR* Net Present Value per Well*
($MM)
151%
104%
29%
15%
EOG
Premium
Wells
EOG
All
Wells
Industry
Delaware
Basin
Industry
Midland
Basin
$5.9
$4.8
$1.8
$0.5
EOG
Premium
Wells
EOG All
Wells
Industry
Delaware
Basin
Industry
Midland
Basin
14. EOG _0817-14
7.2
5.1 4.8 4.6
2015 2016 1H17 Target
5.7
4.7 4.5 4.3
2015 2016 1H17 Target
* CWC = Drilling, Completion, Well-Site Facilities and Flowback.
9.8
8.5
7.6 7.6
2015 2016 1H17 Target
Delaware Basin
Wolfcamp Oil Play
South Texas Eagle Ford Bakken
* Normalized to 5,300’ lateral. * Normalized to 8,400’ lateral.* Normalized to 7,000’ lateral.
1H17
-11%
1H17
-4%
1H17
-6%
15. EOG _0817-15
2014 2015 2016 2017E
$13.53
$12.09*
$10.55*
G&P
G&A
Transportation
LOE
* Excludes one-time expenses of $19.4 million in 2015 related to early leasehold termination and $47.0 million in 2016 related
to voluntary retirements and acquisition costs. Includes stock compensation expense and other non-cash items.
** Based on midpoint of 2017 guidance, as of August 1, 2017. Excludes one-time expenses of $13.3 million for early lease
termination and joint venture transaction costs. See reconciliation schedules.
$10.46**
20. EOG _0817-20
Real-Time Data Streams
from Every Asset
EOG Proprietary
Data Marts
Desktop Mobile
In-House Developed:
• Algorithms
• Data Science
• Software
Predictive Analytics
“A Control Room in Your Pocket”
Frac Fleets
Rigs
Wells on
Production
EOG Proprietary Data
• Logs
• Cores
• 3-D Seismic
• Micro Seismic
• Reservoir Models
Optimized for
Big Data Processing
Comprehensive: Covers All Aspects of EOG Business
Completions: Optimize Advanced Designs to Geologic Setting
Precision Lateral Targeting: Petrophysical Modeling of “Best Target”
Geosteering: Integrated with Petrophysical Models
Decentralized Decision Making:
65+ EOG Proprietary Applications
21. EOG _0817-21
Lower
Eagle
Ford
1. Grade Rock Characteristics High to Low Quality
2. Overall
Grade
3. Drill
* Sample 1-foot core
extracted from
Lower Eagle Ford.
Enlarged to show
detail of the rock.
22. EOG _0817-22
Contain Events Closer
to Wellbore
Enhance Complexity to
Contact More Surface Area
Note: Microseismic dots represent well stimulation events during completions.
23. EOG _0817-23
Play
Net
Acres
Total
Locations*
Resource
Potential**
(MMBoe)
Premium
Locations***
Eagle Ford 528,000 7,200 3,200 2,425
Bakken/Three Forks
- Core
- Non-Core
120,000
110,000
975
1,125
620
400
330
-
Delaware Basin
- Wolfcamp 346,000 2,660 2,900 1,700
- Second Bone Spring 289,000 1,870 1,400 1,350
- Leonard 160,000 1,800 1,700 1,100
Rockies
- DJ Basin
- Powder River Basin
81,000
400,000 _
460
315 _
210
190 _
200
120 _
≈ 2,100,000 ≈ 16,000 ≈ 10,600 ≈ 7,200
* Number of producing and undrilled remaining net wells as of January 1, 2017. Assumes no further downspacing, acreage additions or enhanced recovery.
** Estimated potential reserves (MMBoe) net to EOG, not proved reserves. Includes proved reserves and prior production from existing wells.
*** Premium locations are shown on a net basis and are all undrilled.
Inventory Growing in Quality and Size
24. EOG _0817-24
Production and
Reserve Growth/
ReplacementReturns
A 20%
B 40%
C 10%
D
F 25%
10%
EOG 6%30%
E
G 10%
H 30%
Source: Company Reports. Percentages represent approximate weightings applied in determining 2016 executive officer short-term incentive compensation.
Peer companies: APA, APC, COP, DVN, HES, MRO, NBL and PXD.
EOG Employees Are Incentivized to Deliver Returns
20%
25%
10% 30%
26. EOG _0817-26
Middle East
Venezuela
Brazil
Russia
Nigeria
Angola
US L48 Conv
Mexico
GOM
$0
$10
$20
$30
$40
$50
$60
$70
$80
$90
$100
Middle
East/Russia
Medium Cost
Conventional
US
Tight Oil
Deep
Water
High Cost
Non-OPEC
Arctic / Russian
Unconventional
* Brent equivalent price required to achieve 10% Direct ATROR (see reconciliation schedules).
Source: PIRA.
Brent ($/BBL)
49% 28% 5% 13% 5% -% World Supply
US L48 Conv
Oil Sands
New Marginal Cost of Oil
(≈ $65 - $75)
North Sea
U.S. Tight OilFar East
Russia EOG ($30)
*
EOG Competitive Globally
27. EOG _0817-27
Brushy Canyon
Leonard A
Leonard B
1st Bone Spring
2nd Bone Spring
3rd Bone Spring
Upper Wolfcamp
Middle Wolfcamp
Lower Wolfcamp
4,800’
One World
Trade Center
1,792’
Battery Park to Wall Street to City Hall 4,800’ Middle
Bakken
Lower
Eagle
Ford
40’
150’
Battery
Park
Wall Street
City Hall
28. EOG _0817-28
Net Resource Potential 6.0 BnBoe*
6,330 Net Locations; 7,200’ Laterals
Average 13 Rigs Operating in 2017
Significant Infrastructure Installed
- Water Sourcing, Gathering and
Recycling
- Sand Rail-Car Unloading Facilities
- Oil and Gas Gathering and Takeaway
Low LOE Per-Unit Rate
Test Permian Northwest Shelf in 2017
Eddy
Lea
Loving
Winkler
Culberson
Ward
Reeves
Chaves
Roosevelt
Northwest
Shelf
143,000
Net Acres
Delaware
Basin
416,000
Net Acres
EOG 559,000 Net Acres
* Estimated potential reserves net to EOG, not proved reserves. Includes 462 MMBoe of proved reserves booked at
December 31, 2016 and prior production from existing wells.
29. EOG _0817-29
346,000 Net Acres Prospective with Multiple Target Zones
- 2,660 Net Wells
- Complete ≈110 Net Wells in 2017 vs. 71 in 2016
Estimated Resource Potential 2.9 BnBoe,* Net to EOG
Oil Play
- 226,000 Net Acres, 1,585 Net Wells; 660’ Spacing
- Upper and Middle Zones
- EUR 1,330 MBoe, Gross; 1,050 MBoe, NAR
- CWC** Target $7.6 MM for 7,000’ Lateral
Combo Play
- 120,000 Net Acres, 1,075 Net Wells; 880’ Spacing
- Upper and Middle Zones
- EUR 1,550 MBoe, Gross; 1,200 MBoe, NAR
- CWC** Target $7.5 MM for 8,300’ Lateral
Testing 500’ Spacing and Additional Targets
Wolfcamp Oil and Combo Plays Bopd Boed Lateral
- 2Q 2017 25 Gross Wells 30-Day IP 1,945 3,010 6,500’
* Estimated potential reserves net to EOG, not proved reserves. Includes 330 MMBoe of proved reserves booked at December 31, 2016
and prior production from existing wells.
** CWC = Drilling, Completion, Well-Site Facilities and Flowback
NGLs
32%
Typical Wolfcamp
Combo Well
Gas
42%
Oil
26%
Gas
27%
NGLs
20%
Oil
53%
Typical Wolfcamp
Oil Well
30. EOG _0817-30
289,000 Net Acres Prospective in Northern Delaware Basin
- 1,870 Net Wells; ≈ 850’ Spacing
- Complete ≈25 Net Wells in 2017 vs. 13 in 2016
Estimated Resource Potential 1.4 BnBoe,* Net to EOG
Typical Well
- EUR 950 MBoe, Gross; 780 MBoe, NAR
- CWC** Target $7.3 MM for 7,000’ Lateral
* Estimated potential reserves net to EOG, not proved reserves. Includes 67 MMBoe of proved reserves in Second Bone Spring and
66 MMBoe in Leonard Shale booked at December 31, 2016 and prior production from existing wells.
** CWC = Drilling, Completion, Well-Site Facilities and Flowback.
NGLs
16%
Typical Second Bone
Spring Well
Gas
22%
Oil
62%
160,000 Net Acres Prospective; 1,800 Net Wells
- 660’ Spacing in A and B Zones
- Complete ≈5 Net Wells in 2017 vs. 8 in 2016
Estimated Resource Potential 1.7 BnBoe,* Net to EOG
Typical Well
- EUR 1,175 MBoe, Gross; 940 MBoe, NAR
- CWC** Target $6.3 MM for 6,800’ Lateral
NGLs
28%
Typical Red Hills
Leonard Shale Well
Gas
41%
Oil
31%
Second Bone Spring
Leonard Shale
31. EOG _0817-31
-10
40
90
140
190
240
0 90 180 270 360
0
50
100
150
200
250
300
350
0 90 180 270 360
Delaware Basin Second Bone Spring Wells
Average Cumulative Production*
Delaware Basin Wolfcamp Oil Wells
Average Cumulative Production*
(MBoe)
Producing Days
* Normalized to 4,500-foot lateral.
2015
Producing Days
(MBoe)
2015
2016 2016
* Normalized to 4,500-foot lateral.
32. EOG _0817-32
WEBB
FRIO
BEE
UVALDE
DIMMIT
BEXAR
KINNEY
ZAVALA
MEDINA
LA SALLE
LAVACA
MAVERICK
LIVE OAK
ATASCOSA
DE WITT
FAYETTE
MCMULLEN
WILSON
GONZALES
KARNES
GUADALUPE
Oil
71%
Gas
15%
NGLs
14%
Typical Eagle Ford Well
Largest Oil Producer and Acreage Holder in the Eagle Ford
- Average 8 Rigs Operating in 2017
- Complete ≈195 Net Wells in 2017 vs. 236 in 2016
Estimated Resource Potential 3.2 BnBoe;* 7,200 Net Wells
Typical Well
- 5,300’ Lateral; ≈40-Acre Spacing
- EUR 580 MBoe, Gross; 450 MBoe, NAR
- CWC** $4.7MM in 2016; Target $4.3MM
Precision Targeting
- Lateral Drilling Window 20’ vs. Prior 150’
Implementing Enhanced Oil Recovery Program
- Incremental Reserves 30%-70%
- Direct ATROR*** >30% and PVI**** >2.0
Bopd Boed Lateral
2Q 2017 51 Gross Wells 30-Day IP 1,520 1,960 6,500’
- Lynch Unit 2H-4H 2,555 3,245 5,800’
- Olympic A 1H-D 4H 2,160 2,910 6,600’
- Dio Unit 11H-15H 2,135 2,840 5,100’
* Estimated potential reserves net to EOG, not proved reserves. Includes 1,003 MMBoe proved reserves booked at December 31, 2016
and prior production from existing wells.
** CWC = Drilling, Completion, Well-Site Facilities and Flowback
*** See reconciliation schedules. Assumes oil price $40 per barrel WTI and natural gas price $2.50 per MMBtu Henry Hub.
**** Net present value divided by capital investment.
Crude Oil
Window
Dry Gas
Window
Wet Gas
Window
0 25 Miles
San Antonio
Corpus Christi
Laredo
EOG 590,000 Net Acres
528,000 Net Acres in Oil Window
33. EOG _0817-33
0
25
50
75
100
125
150
175
0 90 180 270 360
Eagle Ford East Wells
Average Cumulative Oil Production*
2012
2013
2014
Eagle Ford West Wells
Average Cumulative Oil Production*
(Mbo)
Producing Days
* Normalized to 6,600-foot lateral.
2015
0
25
50
75
100
125
150
175
0 90 180 270 360
Producing Days
* Normalized to 4,600-foot lateral.
(Mbo)
2012
2013
2014
2015
2016
2016
34. EOG _0817-34
* Estimated potential reserves net to EOG, not proved reserves. Includes 208 MMBoe proved reserves in Bakken/Three Forks
booked at December 31, 2016. Includes prior production from existing wells.
** CWC = Drilling, Completion, Well-Site Facilities and Flowback.
Complete ≈35 Net Wells in 2017 vs. 48 in 2016
Estimated Resource Potential 1.0 BnBoe*
- 8,400’ Lateral
- $5.1 MM CWC** in 2016; Target $4.6 MM
- 650’ Spacing
Focus on Premium Locations
- Bakken Core and Antelope Extension Areas
- 120,000 Net Acres
LOE per BOE Reduced 43% Last Two Years
- Installed Water Handling and Other Infrastructure
Bopd Boed Lateral
2Q 2017 22 Gross Wells 30-Day IP 1,175 1,450 8,400’
- Clarks Creek 73-75, 110-0719H 2,075 2,965 9,800’
Gas
15%
Williston Basin
Remaining Wells
Oil
70%
NGL
15%
Canada
Bakken
Core
Antelope
Extension
Bakken
Lite
State Line
Elm
Coulee
EOG Acreage – Bakken/Three Forks
Bakken Oil Saturated
20 Miles
Stanley, ND
Core
Non-Core
35. EOG _0817-35
PRB Turner Sand Identified as Premium Play
- Testing 4,800’ Column of Stacked Pay
Complete ≈30 Net Wells in 2017 vs. 20 in 2016
CWC* Target $5.0MM for 8,000’ Lateral
- 2Q Wells at Target
8 Gross Turner Wells 2Q 2017 Bopd Boed Lateral
- 30-Day IP 910 1,745 8,700’
DJ Basin Codell Identified as Premium Play
Complete ≈15 Net Wells in 2017 vs. 30 in 2016
CWC* Target $4.5MM for 9,000’ Lateral
- 2Q Wells at Target
10 Gross Codell Wells 2Q 2017 Bopd Boed Lateral
770 885 9,000’
Powder River Basin
DJ Basin
DJ Basin
EOG 81,000 Net Acres
Laramie
Weld
CO
WY
Powder River Basin
Campbell
Crook
Weston
NiobraraConverse
Natrona
Johnson
Sheridan WY
MT
EOG 400,000 Net Acres
PRB Core
Exploration
Area
Average 2 Rigs in Rockies in 2017
* CWC = Drilling, Completion, Well-Site Facilities and Flowback.
36. EOG _0817-36
East Irish Sea (Conwy)
- Production Commenced March 2016
- Optimum Production Rate ≈10,000 Bopd
- Undergoing Facility Improvements
Sercan Joint Development Project
- Completed 5 Gross / 3 Net Well Program
Completed One Additional Net Well in July
- Drill and Complete Three Additional Net Wells
in 2H 2017
Entered Into New Gas Supply Contract
- Enables Additional Premium Drilling
TRINIDAD
ATLANTIC
OCEAN
U(a)
VENEZUELA
4(a)
U(b)
SECC
NORTH
SEA
East
Irish
Sea
Trinidad and Tobago
United Kingdom
Trinidad
United Kingdom
37. Copyright; Assumption of Risk: Copyright 2017. This presentation and the contents of this presentation have been copyrighted by EOG Resources, Inc. (EOG). All rights reserved. Copying of the presentation is
forbidden without the prior written consent of EOG. Information in this presentation is provided “as is” without warranty of any kind, either express or implied, including but not limited to the implied warranties of
merchantability, fitness for a particular purpose and the timeliness of the information. You assume all risk in using the information. In no event shall EOG or its representatives be liable for any special, indirect or
consequential damages resulting from the use of the information.
Cautionary Notice Regarding Forward-Looking Statements: This presentation includes forward-looking statements within the meaning of Section 27A of the Securities Act of 1933, as amended, and Section 21E of the
Securities Exchange Act of 1934, as amended. All statements, other than statements of historical facts, including, among others, statements and projections regarding EOG's future financial position, operations,
performance, business strategy, returns, budgets, reserves, levels of production, costs and asset sales, statements regarding future commodity prices and statements regarding the plans and objectives of EOG's
management for future operations, are forward-looking statements. EOG typically uses words such as "expect," "anticipate," "estimate," "project," "strategy," "intend," "plan," "target," "goal," "may," "will," "should" and
"believe" or the negative of those terms or other variations or comparable terminology to identify its forward-looking statements. In particular, statements, express or implied, concerning EOG's future operating results
and returns or EOG's ability to replace or increase reserves, increase production, reduce or otherwise control operating and capital costs, generate income or cash flows or pay dividends are forward-looking statements.
Forward-looking statements are not guarantees of performance. Although EOG believes the expectations reflected in its forward-looking statements are reasonable and are based on reasonable assumptions, no
assurance can be given that these assumptions are accurate or that any of these expectations will be achieved (in full or at all) or will prove to have been correct. Moreover, EOG's forward-looking statements may be
affected by known, unknown or currently unforeseen risks, events or circumstances that may be outside EOG's control. Important factors that could cause EOG's actual results to differ materially from the expectations
reflected in EOG's forward-looking statements include, among others:
• the timing, extent and duration of changes in prices for, supplies of, and demand for, crude oil and condensate, natural gas liquids, natural gas and related commodities;
• the extent to which EOG is successful in its efforts to acquire or discover additional reserves;
• the extent to which EOG is successful in its efforts to economically develop its acreage in, produce reserves and achieve anticipated production levels from, and maximize reserve recovery from, its existing and future
crude oil and natural gas exploration and development projects;
• the extent to which EOG is successful in its efforts to market its crude oil and condensate, natural gas liquids, natural gas and related commodity production;
• the availability, proximity and capacity of, and costs associated with, appropriate gathering, processing, compression, transportation and refining facilities;
• the availability, cost, terms and timing of issuance or execution of, and competition for, mineral licenses and leases and governmental and other permits and rights-of-way, and EOG’s ability to retain mineral licenses
and leases;
• the impact of, and changes in, government policies, laws and regulations, including tax laws and regulations; environmental, health and safety laws and regulations relating to air emissions, disposal of produced
water, drilling fluids and other wastes, hydraulic fracturing and access to and use of water; laws and regulations imposing conditions or restrictions on drilling and completion operations and on the transportation of
crude oil and natural gas; laws and regulations with respect to derivatives and hedging activities; and laws and regulations with respect to the import and export of crude oil, natural gas and related commodities;
• EOG's ability to effectively integrate acquired crude oil and natural gas properties into its operations, fully identify existing and potential problems with respect to such properties and accurately estimate reserves,
production and costs with respect to such properties;
• the extent to which EOG's third-party-operated crude oil and natural gas properties are operated successfully and economically;
• competition in the oil and gas exploration and production industry for the acquisition of licenses, leases and properties, employees and other personnel, facilities, equipment, materials and services;
• the availability and cost of employees and other personnel, facilities, equipment, materials (such as water) and services;
• the accuracy of reserve estimates, which by their nature involve the exercise of professional judgment and may therefore be imprecise;
• weather, including its impact on crude oil and natural gas demand, and weather-related delays in drilling and in the installation and operation (by EOG or third parties) of production, gathering, processing, refining,
compression and transportation facilities;
• the ability of EOG's customers and other contractual counterparties to satisfy their obligations to EOG and, related thereto, to access the credit and capital markets to obtain financing needed to satisfy their
obligations to EOG;
• EOG's ability to access the commercial paper market and other credit and capital markets to obtain financing on terms it deems acceptable, if at all, and to otherwise satisfy its capital expenditure requirements;
• the extent to which EOG is successful in its completion of planned asset dispositions;
• the extent and effect of any hedging activities engaged in by EOG;
• the timing and extent of changes in foreign currency exchange rates, interest rates, inflation rates, global and domestic financial market conditions and global and domestic general economic conditions;
• political conditions and developments around the world (such as political instability and armed conflict), including in the areas in which EOG operates;
• the use of competing energy sources and the development of alternative energy sources;
• the extent to which EOG incurs uninsured losses and liabilities or losses and liabilities in excess of its insurance coverage;
• acts of war and terrorism and responses to these acts;
• physical, electronic and cyber security breaches; and
• the other factors described under ITEM 1A, Risk Factors, on pages 13 through 22 of EOG’s Annual Report on Form 10-K for the fiscal year ended December 31, 2016 and any updates to those factors set forth in EOG's
subsequent Quarterly Reports on Form 10-Q or Current Reports on Form 8-K.
In light of these risks, uncertainties and assumptions, the events anticipated by EOG's forward-looking statements may not occur, and, if any of such events do, we may not have anticipated the timing of their occurrence
or the duration and extent of their impact on our actual results. Accordingly, you should not place any undue reliance on any of EOG's forward-looking statements. EOG's forward-looking statements speak only as of the
date made, and EOG undertakes no obligation, other than as required by applicable law, to update or revise its forward-looking statements, whether as a result of new information, subsequent events, anticipated or
unanticipated circumstances or otherwise.
Oil and Gas Reserves; Non-GAAP Financial Measures: The United States Securities and Exchange Commission (SEC) permits oil and gas companies, in their filings with the SEC, to disclose not only “proved” reserves
(i.e., quantities of oil and gas that are estimated to be recoverable with a high degree of confidence), but also “probable” reserves (i.e., quantities of oil and gas that are as likely as not to be recovered) as well as
“possible” reserves (i.e., additional quantities of oil and gas that might be recovered, but with a lower probability than probable reserves). Statements of reserves are only estimates and may not correspond to the
ultimate quantities of oil and gas recovered. Any reserve estimates provided in this presentation that are not specifically designated as being estimates of proved reserves may include "potential" reserves and/or other
estimated reserves not necessarily calculated in accordance with, or contemplated by, the SEC’s latest reserve reporting guidelines. Investors are urged to consider closely the disclosure in EOG’s Annual Report on
Form 10-K for the fiscal year ended December 31, 2016, available from EOG at P.O. Box 4362, Houston, Texas 77210-4362 (Attn: Investor Relations). You can also obtain this report from the SEC by calling 1-800-SEC-0330
or from the SEC's website at www.sec.gov. In addition, reconciliation and calculation schedules for non-GAAP financial measures can be found on the EOG website at www.eogresources.com.