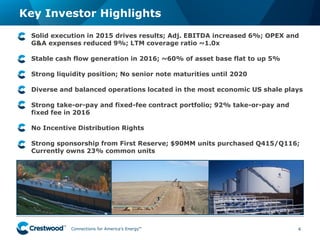
SlideShare a Scribd company logo
1 of 24
Download to read offline
Presentation Title
Presentation Subtitle
Crestwood Midstream Partners LP Crestwood Equity Partners LP
Connections for America’s Energy
™
™
Presentation Title
Presentation Subtitle
Crestwood Midstream Partners LP Crestwood Equity Partners LP
Connections for America’s Energy
™
™
Presentation Title
Presentation Subtitle
Crestwood Midstream Partners LP Crestwood Equity Partners LP
Connections for America’s Energy
™
™
2/29/2016
Presentation Title
Presentation Subtitle
Crestwood Midstream Partners LP Crestwood Equity Partners LP
Connections for America’s Energy
™
™
Presentation Title
Presentation Subtitle
Crestwood Midstream Partners LP Crestwood Equity Partners LP
Connections for America’s Energy
™
™
Connections for America’s Energy
™
™
Investor Presentation
March 2016
Connections for America’s Energy
™
™
™
™
™
™
The statements in this communication regarding future events, occurrences, circumstances, activities, performance, outcomes and results are forward-looking
statements. Although these statements reflect the current views, assumptions and expectations of Crestwood’s management, the matters addressed herein are
subject to numerous risks and uncertainties which could cause actual activities, performance, outcomes and results to differ materially from those indicated.
Such forward-looking statements include, but are not limited to, statements about the benefits that may result from the merger and statements about the future
financial and operating results, objectives, expectations and intentions and other statements that are not historical facts. Factors that could result in such
differences or otherwise materially affect Crestwood’s financial condition, results of operations and cash flows include, without limitation, the possibility that
expected cost reductions will not be realized, or will not be realized within the expected timeframe; fluctuations in crude oil, natural gas and NGL prices
(including, without limitation, lower commodity prices for sustained periods of time); the extent and success of drilling efforts, as well as the extent and quality of
natural gas and crude oil volumes produced within proximity of Crestwood assets; failure or delays by customers in achieving expected production in their oil
and gas projects; competitive conditions in the industry and their impact on our ability to connect supplies to Crestwood gathering, processing and
transportation assets or systems; actions or inactions taken or non-performance by third parties, including suppliers, contractors, operators, processors,
transporters and customers; the ability of Crestwood to consummate acquisitions, successfully integrate the acquired businesses, realize any cost savings and
other synergies from any acquisition; changes in the availability and cost of capital; operating hazards, natural disasters, weather-related delays, casualty
losses and other matters beyond Crestwood’s control; timely receipt of necessary government approvals and permits, the ability of Crestwood to control the
costs of construction, including costs of materials, labor and right-of-way and other factors that may impact Crestwood’s ability to complete projects within
budget and on schedule; the effects of existing and future laws and governmental regulations, including environmental and climate change requirements; the
effects of existing and future litigation; and risks related to the substantial indebtedness, of either company, as well as other factors disclosed in Crestwood’s
filings with the U.S. Securities and Exchange Commission. You should read filings made by Crestwood with the U.S. Securities and Exchange Commission,
including Annual Reports on Form 10-K and the most recent Quarterly Reports and Current Reports for a more extensive list of factors that could affect results.
Readers are cautioned not to place undue reliance on forward-looking statements, which reflect management’s view only as of the date made. Crestwood does
not assume any obligation to update these forward-looking statements.
Company Information
2
Forward-Looking Statements
Contact Information
Corporate Headquarters
700 Louisiana Street
Suite 2550
Houston, TX 77002
(1) Market price as of 2/24/2016.
(2) Unit count and balance sheet data as of 12/31/2015.
Crestwood Equity Partners LP
NYSE Ticker CEQP
Market Capitalization ($MM)(1,2) $617
Enterprise Value ($MM)(2) $3,724
Annualized Distribution $5.50
Investor Relations
investorrelations@crestwoodlp.com
(713) 380-3081
Connections for America’s Energy
™
™
™
™
™
™
Key Investor Highlights
3
Connections for America’s Energy
™
™
™
™
™
™
• Solid execution in 2015 drives results; Adj. EBITDA increased 6%; OPEX and
G&A expenses reduced 9%; LTM coverage ratio ~1.0x
• Stable cash flow generation in 2016; ~60% of asset base flat to up 5%
• Strong liquidity position; No senior note maturities until 2020
• Diverse and balanced operations located in the most economic US shale plays
• Strong take-or-pay and fixed-fee contract portfolio; 92% take-or-pay and
fixed fee in 2016
• No Incentive Distribution Rights
• Strong sponsorship from First Reserve; $90MM units purchased Q415/Q116;
Currently owns 23% common units
Key Investor Highlights
4
Connections for America’s Energy
™
™
™
™
™
™
2016 Outlook
5
Marketing, Supply & Logistics
• Adjusted EBITDA:
$95MM - $100MM
• Flat cash flows in 2016
• Marketing business supported
by hard assets and long-term
relationships
2016E Adjusted EBITDA of $490 million to $520 million; ~60% of the business flat
to up in 2016
2016E Segment Cash Flow Reduced CAPEX
Gathering &
Processing
43%
Storage &
Transportation
40%
Marketing
Supply &
Logistics
17%
2016E Adj. EBITDA Guidance
$490MM - $520MM
Segment Outlook
Storage & Transportation
• Adjusted EBITDA:
$225MM - $235MM
• Volumes trending flat to up 5% in
2016
• NE S&T and COLT Hub take-or-
pay contracts drive stable cash
flow
Gathering & Processing
• Adjusted EBITDA:
$235MM - $250MM
• Volumes trending 15%-20%
lower in 2016
• 2016E cash flow forecasts
include conservative forecasts
for Barnett and PRB Niobrara
assets
(1) Excludes corporate G&A expenses of $65 million.
Segment Contribution
(1) (1)
($MM) ($MM)
Connections for America’s Energy
™
™
™
™
™
™
Repositioning Crestwood in 2015/16
6
Corporate Structure
69.1 MM common units
62.1 MM preferred units
In a challenging market, Crestwood continues to take actionable steps to improve its
positioning and broaden its investment appeal
No IDRs
Key Items
• In 2015, reduced O&M and G&A expenses by
$26MM year-over-year through Project Adapt
initiatives
• Limiting growth capital expenditures to previously
committed contractual projects
Simplification
Merger
Cost Cutting /
Reduced Capex
• In 1Q 2015, completed Project Adapt to cut costs
and improve processes and efficiencies
• In 2Q 2015, restructured operations to Pipeline
Services and Marketing, Supply & Logistics divisions
• On September 30, 2015, closed merger between
Crestwood Equity and Crestwood Midstream
• Improved cost of capital by eliminating IDRs
Deleverage
Strategy
• In 2016, Crestwood is pursuing strategic steps to
strengthen the balance sheet in lower-for-longer
environment
• Evaluating full range of options, including further
CAPEX and cost reductions, divesting of assets, and
evaluating appropriate distribution level
Streamlined
Business
Connections for America’s Energy
™
™
™
™
™
™
Existing Scale and New Investment Opportunities
in the Right Places
7
Bakken
• Over 75% of cash flow is
sourced from two premier
basins: Marcellus and
Bakken
• Marcellus and Bakken cash
flow trading multiples
illustrate valuation
disconnect
• Delaware-Permian expansion
projects provide opportunity
to build third franchise
position
• Scale and diversity of
remaining cash flows are
competitively positioned
across multiple resource
plays
Crestwood’s crude oil and natural gas operations are situated in the highest
returning shale plays
Marcellus
Connections for America’s Energy
™
™
™
™
™
™
Fixed-Fee Contracts Provide Safety Net
8
Contract Portfolio 2016E EBITDA
Variable
Rate Contracts
8%
Take-or-Pay and
Fixed-Fee
Contracts
92%
 92% of 2016E EBITDA from take-or-pay and fixed-fee contracts
 Significant cash flow contribution protected from commodity change and volume reduction
55% of EBITDA is
guaranteed through take-
or-pay contracts
YoY Margin Growth Despite Commodity Prices
Adjusted EBITDA
Crude Oil and Natural Gas Prices
Crude Oil
Natural Gas
Y-o-Y Adj. EBITDA
Growth: 6.4%
Crude Oil decline: (61%)
Natural Gas decline: (45%)
Connections for America’s Energy
™
™
™
™
™
™
$299
$253
$100
$150
$200
$250
$300
$350
4Q14 Annualized FY 2015
Expense / Fixed Charge Reduction Strategy
9
($MM)
Total Expenses Total Expenses by Segment
Crestwood exceeded stated cost reduction goals in 2015; On-track to remove an
additional $10MM in 2016
• In 2015, Crestwood materially reduced expenses and fixed charges to improve margins and coverage:
– Reduced O&M and Adj. G&A(1) costs by $26.4 million in 2015 over 2014
– Additional 2016 cost savings of >$10MM; 2016+ run-rate savings of >$35MM
• Results drive greater profitability in the current industry environment
• Increased efficiency without sacrificing customer service, safety or compliance
• Simplification adds to coverage improvement through fixed charge elimination
(1) Adjusted G&A is defined as general and administrative expenses less unit-based compensation
charges and significant transaction and environmental related costs and other items.
(1)
4Q14
Annualized FY 2015
($MM)
Total
Expenses
Total
Expenses Variance
Gathering & Processing $109 $89 ($20)
Storage & Transportation $27 $32 $5
Marketing, Supply & Logistics $79 $70 ($9)
Adjusted G&A $84 $63 ($21)
Total Expenses $299 $253 ($46)
%-Change (15.4%)
Connections for America’s Energy
™
™
™
™
™
™
Consistent Operating and Financial Results
10
(1) See accompanying tables of non-GAAP reconciliations.
(2) Cash flow margin is calculated by dividing Adj. EBITDA into Net Revenue.
(3) Cash flow margin adjusted for Q4 2015 shut-in and weather impacts.
Adjusted EBITDA and Margins(1)
Natural Gas Volumes
Improving financial performance demonstrates strong baseline cash flow; Q4 2015
strongly impacted by warm weather
(2)
Crude Oil Volumes
$18.0
Q415 miss of
$18mm
attributable to
unseasonably
warm
weather;
depressed NE
regional
pricing
(3)
$118.5
Connections for America’s Energy
™
™
™
™
™
™
Capital Structure
11
Capitalization
• Strong liquidity position
– 1.5 billion revolving credit facility
– ~50% drawn RCF balance
• No near-term maturities;
attractive long-term capital
– $1.8 billion senior notes; 6.00%-6.25% coupon
– Nearest maturity 2020
• Ample covenant cushion
• Strong fixed charge coverage
• No need to access capital markets
in 2016
Crestwood has ample liquidity to execute business plan in challenging market
Debt Maturities
No near-term
debt maturities
RCF
6%
Notes
6.125%
Notes
6.25%
Notes
($ millions) 12/31/2015
Cash $0.5
Total Debt $2,540.3
Total Partners' Capital $2,946.9
Total Capitalization $5,487.2
Credit & Liquidity Stats
Total Leverage Ratio 4.75x
Senior Secured Leverage Ratio 1.37x
Total Leverage Covenant 5.50x
Senior Secured Leverage Covenant 3.75x
Summary
($MM)
Connections for America’s Energy
™
™
™
™
™
™
• Diverse customer base is comprised of integrated
producers, refiners, utilities, and petrochemical
companies
• The majority of customers well-positioned to
navigate a lower-for-longer environment
• Crestwood is actively monitoring at-risk
counterparties to mitigate cash flow risk in 2016
• Highly confident in contractual positioning to
mitigate cash flow loss from potential bankruptcies
Quicksilver Resources
• Filed for bankruptcy March 2015; Began sales
process in Q4 2015
• BlueStone Natural Resources emerged as winning
bidder; Must close by March 2016
• Binding agreement in place with the back up bidder
• Long-term resolution likely by Q2 2016
Manageable Counterparty Risk
12
Crestwood has a diverse customer portfolio; producer counterparty risk manageable
in the event of continued market deterioration
2016E Cash Flow ExposureCounterparty Risk Overview
Manageable
counterparty
risk in 2016
(1)
(1) Represents total annual cash flow contributions from higher risk counterparties.
Connections for America’s Energy
™
™
™
™
™
™
Core Operations Update
13
Connections for America’s Energy
™
™
™
™
™
™
• Bakken has continued to produce
sufficient producer wellhead returns
– 94% of rigs operating in four counties
(McKenzie, Williams, Mountrail, Dunn)
– ~340 permits have been filed in those four
counties in last 120 days
– Estimated breakeven WTI pricing of $24-
$41/bbl in these four core counties
– Producers improved IP rates, realized cost
reductions, and minimized cost to market
– Reducing days to drill to 10-12 days
• Crestwood producers continue to
achieve strong results:
– In the last 120 days, Arrow producers have
filed approximately 100 permits in the
Bakken
– Halcon expects 2016 wells put online to
have an EUR of ~900 Mboe; average D&C
of $6.2MM
– Whiting reported 24-hr IP rate of 4,300
Boe/d on Crestwood’s system
Bakken Producers Remain Active Around
Crestwood’s Assets
14
Permits Filed in Last 120 Days
Permits Heat Map
By Arrow Producers
9
2
38
48
Source: North Dakota Industrial Commission
As of February 24, 2016.
Connections for America’s Energy
™
™
™
™
™
™
0
25
50
75
100
125
Q1:14 Q2:14 Q3:14 Q4:14 Q1:15 Q2:15 Q3:15 Q4:15
GatheringVolumes(Mboe/d)
Crude Oil Natural Gas Water
$0
$5
$10
$15
$20
$25
Q1:14 Q2:14 Q3:14 Q4:14 Q1:15 Q2:15 Q3:15 Q4:15
AdjustedEBITDA($MM)
Bakken Arrow Gathering System
15
Tier 1 acreage dedication with substantial long-term growth through system build out
Summary
• ~150,000 acre dedication under LT contracts
• Crude, natural gas and water gathering
• Producers continuing active development through aid-
in-construction lateral requests
• Lower operating cost in 2015 improves margin
• Arrow volumes have increased 14% year-over-year and
76% since Q1 2014
• Arrow system connected to COLT Hub through Tesoro
and Hiland crude oil pipelines
Long-Term Outlook
• >1,200 estimated future drilling locations
• 45-55 new well connects expected in 2016
– XTO, WPX and QEP approximately 90% of 2016
development activity
• Achieved record crude volume of 80 MBbls/d in October
2015
(1) Natural gas converted to barrels at 6:1.
Arrow Adjusted EBITDA
Increasing Gathering Volumes from Continued
Drilling Activity
(1)
Connections for America’s Energy
™
™
™
™
™
™
Bakken COLT Hub and Connector
16
COLT Hub is the leading Bakken CBR facility linking Bakken crude supply to prime
refinery markets
Source: Genscape February 2016; EIA.
Summary
• Premier crude oil pipeline, storage and CBR facility in
the Bakken
• 160 MBbls/d crude-by-rail facility; 1.2 MMBbls storage
capacity; 70 MBbls/d COLT connector pipeline
• ~300 MBbls/d supply aggregation capacity at COLT
Hub (gathering, truck rack, pipelines)
• Strong refiner customers dependent on the Bakken
barrel and crude-by-rail transportation
Top 5 Bakken CBR Facilities
COLT Hub
Customers
Maintaining Market Share Going into 2016
BakkenPipeline/Crude-by-Rail(Bbls/d)
• Pipeline and CBR remain >1,000 Bbls/d
− 67% Pipeline / 33% CBR
• Crestwood’s COLT Hub currently ~25%
CBR market share
Connections for America’s Energy
™
™
™
™
™
™
$10
$15
$20
$25
$30
$35
$40
$45
Q1:14 Q2:14 Q3:14 Q4:14 Q1:15 Q2:15 Q3:15 Q4:15
AdjustedEBITDA($MM)
17
NE Marcellus Storage and Transportation
Summary 200 MMcf/d
North-South
Expansion
Wilmot
Receipt
Point
MARC I
Transco
Meter
Long-Term Outlook
• ~3.5 Bcf/d Marcellus dry gas supply access through
upstream gathering and producer connections
• 530 MMcf/d receipt point at Wilmot in-service
• MARC I – In Q4 2015, secured two anchor shippers for 120
MMcf/d on expansion to Transco
• MARC II – Non-binding indications of interest >700 MMcf/d
support connecting MARC I with PennEast
Critical infrastructure for NE demand markets (NYC) provide significant level of
contracted cash flows and growth opportunities
Storage
• Irreplaceable storage position with top East Coast utility
customers: Con Ed, NJNG, NYSEG, PSEG
• ~41 Bcf of natural gas storage; 99% subscribed
Transportation
• MARC I / North-South pipeline capacity of ~2.0 Bcf/d
connecting to premium north east markets (Millennium,
TGP, Transco)
• North-South Pipeline – 200 MMcf/d expansion completed in
2014; expansion fully contracted
Consistent Cash Flow from
Take-or-Pay Contracts
Connections for America’s Energy
™
™
™
™
™
™
• 20-year, fixed-fee contracts for gathering and compression
services with Antero Resources
− ~140,000 acre dedication (235 wells connected)
− ~1,850 Antero drilling locations on Crestwood dedication
− Average IP rate for 2015 well connects of 18 MMcf/d on
Crestwood’s acreage
− Current system capacity of 875 MMcf/d
− 450 MMcf/d MVC on gathering system; compression MVC at
~50% of design capacity
• Current YTD average volumes of 480 MMcf/d
SW Marcellus Gathering & Compression
18
Long-term fee-based contracts in southwest Marcellus core production window
Summary
Markwest
Sherwood
Processing Greenbrier
Rich Gas
Area
Crestwood
Dedication Area
Antero Midstream
Dedication Area
Key Drivers for Future Drilling
• Antero has 22 DUCs connected to Crestwood’s system;
Antero expects to bring all of these wells online in 2017
• Q4 2015: Regional gathering pipeline provides access to premium
priced markets
• New Southwest Marcellus / Utica pipeline takeaway projects:
− Antero: 4.0 Bcf/d of firm takeaway by YE2017 will increase
favorable price index exposure to 94% of sales1
− SW Marcellus / Utica region: >20 Bcf/d of new firm takeaway
by YE2018 will dramatically increase SW Marcellus netbacks
• Dry gas economics improving with challenged northeast liquids
prices
(1) See November Antero Resources company presentation.
Connections for America’s Energy
™
™
™
™
™
™
Delaware-Permian: Reservoir Overview
19
• The Delaware-Permian offers stacked pay potential and low
break-even economics
• Substantial drilling activity in the past five years has focused on
the Wolfcamp and Bone Spring formations
Wolfcamp
Western Frontier
Bone Spring
Western Fairway
Wolfcamp
Reeves Core
NorthernDelawareSouthernDelaware
Source: Wood Mackenzie May playbook.
Willow Lake
3-Stream
Gathering Project
Summary Delaware-Permian Map
Crestwood’s developing position is located in the core of the Wolfcamp and Bone Spring formations
Wolfcamp
Bone Spring
• Crestwood’s developing projects are located in the Western
Frontier and Reeves Core
• Western Frontier
– Largest expected recoveries, primarily condensate, highest avg.
API gravity in the Wolfcamp
– Avg. well profile: 820 Mboe EUR, 723 Boe/d IP-30, and 24% oil
• Reeves Core
– Lowest breakeven sub-play in the Delaware Basin, substantial
de-risking since 2013
– Avg. well profile: 600 Mboe EUR, 720 Boe/d IP-30, and 59% oil
• Crestwood’s current asset footprint is located in the Western
Fairway
• Western Fairway
– Top producing Bone Spring sub-play in 2015
– Avg. well profile: 589 Mboe EUR, 687 Boe/d IP-30, and 30% oil
Connections for America’s Energy
™
™
™
™
™
™
Delaware-Permian: Expansion Projects
20
Crestwood is actively expanding its footprint in the heart of the Delaware Permian
Basin, the most active shale play in the US
Other Long-Term Opportunities
• Integrated gas, condensate, and water gathering system
• 600 miles of pipelines spanning over 400,000 acres
• Full development to include 109,200 of horsepower from 65
compression units at 8 centralized compressor stations
3-Stream Gathering System
Proposed Expansion Map
• Orla Terminal:
− Capacity of 200 MBbls of crude oil tankage
− 8 truck loading and unloading bays; up to 64 MBbls/d
− Additional services include blending, condensate
stabilization and 3rd party trucking services
• Delta Pipeline
− Condensate pipeline header from Orla to multiple outlets
providing access to Cushing, Houston, & Corpus Christi
− ~180 mile, 20” pipeline, 200 MBbls/d of capacity
2
3
3
2
1
Willow Lake Expansion
• Expanded processing capacity to 50 MMcf/d
• 41 new wells dedicated to be completed in 2016/2017
• Projects: Dublin Ranch to Willow Lake connector, RJT skid,
upsized interconnects for increased residue take-away options
• Placed into service January 2016; on schedule
1
3
Willow Lake
Delta Pipeline
Orla Terminal
3-Stream
Gathering
System
Connections for America’s Energy
™
™
™
™
™
™
• Leading marketer of Marcellus/Utica NGLs
• 2.8 MMBbls of Northeast US NGL storage
capacity; >500 NGL trucking units; >1,600
NGL railcars
• Sources, transports, stores and delivers NGLs
to domestic and export markets; >350
customers
• Commenced LPG exports through Marcus
Hook, PA
• New LPG terminals in WY, RI and NC underway
• Strong NGL supply continues to push prices
lower creating a buying opportunity to build
seasonal storage
• Marketing opportunities to diversify in the West
Coast and Rocky Mountain regions
21
Crestwood NGL Assets and Services
Servicing
Blue Chip
Customers
Crestwood is well-positioned to benefit from continued Marcellus/Utica NGL supply growth
through its integrated logistics platform including Bath and Seymour storage, ME2 pipeline
capacity and Marcus Hook export capability
Summary Leading Marcellus/Utica NGL Logistics Platform
Marcus Hook
NGL Exports
Bath
NGL Storage
Seymour
NGL Storage
60
15
34
88
75
218
2015E = 490 MBPD
UEO-CHK
Dominion
Blue Racer
Crestwood
BP
Markwest
Connections for America’s Energy
™
™
™
™
™
™
The Crestwood Investment Opportunity
No Incentive Distribution
Rights
22
1
Substantial Expense /
Fixed Charge Reduction
2
Solid Financial Results
year-over-year
3
Diversified / Balanced
Portfolio
4
Fixed Fee / Firm Contract
Profile
5
Current Valuation Not Indicative
of Business Fundamentals
Leveraged to Volume Growth
with Commodity Price Upside
1
Cost of Capital Improvement
2
Expansion Opportunities in
Delaware Permian Basin and
NE S&T
3
Strengthened Balance Sheet
in 2016
4
Attractive Valuation Entry Point
5
Execution Drives Significant Upside
Return Opportunity
Strong Liquidity /
No near-term maturities
6
Connections for America’s Energy
™
™
™
™
™
™
Non-GAAP Reconciliations
23
Connections for America’s Energy
™
™
™
™
™
™
CEQP Non-GAAP Reconciliations
24
(in millions, unaudited)
4th Qtr 3rd Qtr 2nd Qtr 1st Qtr 4th Qtr 3rd Qtr 2nd Qtr 1st Qtr
EBITDA
Net income (loss) (1,402.4)$ (623.4)$ (296.0)$ 18.1$ (30.7)$ 11.9$ (4.8)$ 13.2$
Interest and debt expense, net 35.4 35.7 35.4 33.6 31.3 31.5 32.6 31.7
Loss on modification/extinguishment of debt 0.2 2.7 17.1 — — — — —
Provision (benefit) for income taxes (1.2) (0.3) (0.3) 0.4 — 0.1 0.2 0.8
Depreciation, amortization and accretion 75.6 75.5 74.8 74.2 76.1 71.7 71.2 66.3
EBITDA (a)
(1,292.4)$ (509.8)$ (169.0)$ 126.3$ 76.7$ 115.2$ 99.2$ 112.0$
Significant items impacting EBITDA:
Unit-based compensation charges 4.1 3.9 5.9 5.8 4.9 4.8 6.2 5.4
(Gain) loss on long-lived assets, net 817.3 2.3 0.6 1.0 2.7 0.9 (1.2) (0.5)
Goodwill impairment 515.4 609.9 281.0 — 48.8 — — —
Loss on contingent consideration — — — — — — 6.5 2.1
(Earnings) loss from unconsolidated affiliates, net 72.0 (2.8) (5.0) (3.4) (0.6) (0.3) 1.5 0.1
Adjusted EBITDA from unconsolidated affiliates, net 6.9 6.2 5.7 6.5 2.9 1.9 0.4 1.7
Change in fair value of commodity inventory-related
derivative contracts (5.3) 8.1 1.5 1.1 (3.5) 1.0 2.9 (10.7)
Significant transaction and environmental related costs and
other items 0.9 15.7 12.4 4.6 0.8 5.4 2.2 6.5
Adjusted EBITDA (a)
118.9$ 133.5$ 133.1$ 141.9$ 132.7$ 128.9$ 117.7$ 116.6$
Distributable Cash Flow
Adjusted EBITDA (a)
118.9 133.5 133.1 141.9 132.7 128.9 117.7 116.6
Cash interest expense (b)
(33.5) (33.7) (33.3) (31.8) (29.4) (30.3) (31.2) (30.4)
Maintenance capital expenditures (c)
(10.0) (4.1) (3.9) (5.4) (9.4) (4.8) (5.7) (7.0)
(Provision) benefit for income taxes 1.2 0.3 0.3 (0.4) — (0.1) (0.2) (0.8)
Deficiency payments (0.9) (0.6) 5.7 (0.6) 3.5 2.3 3.8 1.1
Distributable cash flow attributable to CEQP 75.7$ 95.4$ 101.9$ 103.7$ 97.4$ 96.0$ 84.4$ 79.5$
Distirbutions to Niobrara Preferred (3.8) (3.8) (3.8) (3.8) — — — —
Distributable cash flow attributable to CEQP common (d)
71.9$ 91.6$ 98.1$ 99.9$ 97.4$ 96.0$ 84.4$ 79.5$
(b) Cash interest expense less amortization of deferred financing costs plus bond premium amortization plus or minus fair value adjustment of interest rate swaps.
(c) M aintenance capital expenditures are defined as those capital expenditures which do not increase operating capacity or revenues from existing levels.
(d) Distributable cash flow is defined as Adjusted EBITDA, less cash interest expense, maintenance capital expenditures, income taxes, and deficiency payments (primarily related to deferred revenue). Distributable cash flow should not be considered an alternative to cash flows from operating
activities or any other measure of financial performance calculated in accordance with generally accepted accounting principles as those items are used to measure operating performance, liquidity, or the ability to service debt obligations. We believe that distributable cash flow provides additional
information for evaluating our ability to declare and pay distributions to unitholders. Distributable cash flow, as we define it, may not be comparable to distributable cash flow or similarly titled measures used by other corporations and partnerships.
20142015
CRESTWOOD EQUITY PARTNERS LP
Reconciliation of Non-GAAP Financial Measures
(a) EBITDA is defined as income before income taxes, plus debt-related costs (net interest and debt expense and loss on modification/extinguishment of debt) and depreciation, amortization and accretion expense. In addition, Adjusted EBITDA considers the adjusted earnings impact of our
unconsolidated affiliates by adjusting our equity earnings or losses from our unconsolidated affiliates for our proportionate share of their depreciation and interest. Adjusted EBITA also considers the impact of certain significant items, such as unit-based compensation charges, gains and
impairments of long-lived assets and goodwill, gains and losses on acquisition-related contingencies, third party costs incurred related to potential and completed acquisitions, certain environmental remediation costs, certain costs related to our 2015 cost savings initiatives, the change in fair value of
commodity inventory-related derivative contracts, and other transactions identified in a specific reporting period. The change in fair value of commodity inventory-related derivative contracts is considered in determining Adjusted EBITDA given that the timing of recognizing gains and losses on these
derivative contracts differs from the recognition of revenue for the related underlying sale of inventory that these derivatives relate to. Changes in the fair value of other derivative contracts is not considered in determining Adjusted EBITDA given the relatively short-term nature of those derivative
contracts. EBITDA and Adjusted EBITDA are not measures calculated in accordance with GAAP, as they do not include deductions for items such as depreciation, amortization and accretion, interest and income taxes, which are necessary to maintain our business. EBITDA and Adjusted EBITDA
should not be considered an alternative to net income, operating cash flow or any other measure of financial performance presented in accordance with GAAP. EBITDA and Adjusted EBITDA calculations may vary among entities, so our computation may not be comparable to measures used by
other companies.

More Related Content

What's hot

Investor presentation november 2015 v rbc final
Investor presentation november 2015 v rbc finalInvestor presentation november 2015 v rbc final
Investor presentation november 2015 v rbc finalCrestwoodCorporate
 
Q1 16 operations report - final
Q1 16 operations report - finalQ1 16 operations report - final
Q1 16 operations report - finalEnLinkMidstreamLLC
 
Enlk & enlc operations report third quarter 2017
Enlk & enlc operations report third quarter 2017Enlk & enlc operations report third quarter 2017
Enlk & enlc operations report third quarter 2017EnLinkMidstreamLLC
 
Crestwood investor deck august 2017
Crestwood investor deck august 2017Crestwood investor deck august 2017
Crestwood investor deck august 2017CrestwoodCorporate
 
Q4 15 operations report final2
Q4 15 operations report   final2Q4 15 operations report   final2
Q4 15 operations report final2EnLinkMidstreamLLC
 
Enlk and enlc second quarter 2017 operations report
Enlk and enlc second quarter 2017 operations reportEnlk and enlc second quarter 2017 operations report
Enlk and enlc second quarter 2017 operations reportEnLinkMidstreamLLC
 
Jp morgan okc bus tour may 16 16 - final
Jp morgan okc bus tour   may 16 16 - finalJp morgan okc bus tour   may 16 16 - final
Jp morgan okc bus tour may 16 16 - finalEnLinkMidstreamLLC
 
Project phoenix investor presentation 10232016_225pm_ct
Project phoenix investor presentation 10232016_225pm_ctProject phoenix investor presentation 10232016_225pm_ct
Project phoenix investor presentation 10232016_225pm_ctir_jpenergy
 
Enlink Midstream NAPTP Presentation
Enlink Midstream NAPTP Presentation Enlink Midstream NAPTP Presentation
Enlink Midstream NAPTP Presentation EnLinkMidstreamLLC
 
Crestwood MLPA 2017 Annual Investor Conference Presentation
Crestwood MLPA 2017 Annual Investor Conference PresentationCrestwood MLPA 2017 Annual Investor Conference Presentation
Crestwood MLPA 2017 Annual Investor Conference PresentationCrestwoodCorporate
 
Citi crestwood investor presentation_august 2016
Citi crestwood investor presentation_august 2016Citi crestwood investor presentation_august 2016
Citi crestwood investor presentation_august 2016CrestwoodCorporate
 
2017 12 capital one conference final
2017 12 capital one conference final2017 12 capital one conference final
2017 12 capital one conference finalDenbury
 
Celp investor presentation march 2017 final
Celp investor presentation march 2017 finalCelp investor presentation march 2017 final
Celp investor presentation march 2017 finalCypressEnergy
 
Am website presentation (a) december 2016
Am website presentation (a)   december 2016Am website presentation (a)   december 2016
Am website presentation (a) december 2016anteromidstream
 
Am website presentation march 2016
Am website presentation   march 2016Am website presentation   march 2016
Am website presentation march 2016anteromidstream
 
Am website presentation (c) february 2017
Am website presentation (c)   february 2017Am website presentation (c)   february 2017
Am website presentation (c) february 2017anteromidstream
 
Am website presentation april 2016
Am website presentation   april 2016Am website presentation   april 2016
Am website presentation april 2016anteromidstream
 

What's hot (20)

Investor presentation november 2015 v rbc final
Investor presentation november 2015 v rbc finalInvestor presentation november 2015 v rbc final
Investor presentation november 2015 v rbc final
 
Q1 16 operations report - final
Q1 16 operations report - finalQ1 16 operations report - final
Q1 16 operations report - final
 
Enlk & enlc operations report third quarter 2017
Enlk & enlc operations report third quarter 2017Enlk & enlc operations report third quarter 2017
Enlk & enlc operations report third quarter 2017
 
Crestwood investor deck august 2017
Crestwood investor deck august 2017Crestwood investor deck august 2017
Crestwood investor deck august 2017
 
Q4 15 operations report final2
Q4 15 operations report   final2Q4 15 operations report   final2
Q4 15 operations report final2
 
Enlk and enlc second quarter 2017 operations report
Enlk and enlc second quarter 2017 operations reportEnlk and enlc second quarter 2017 operations report
Enlk and enlc second quarter 2017 operations report
 
Devon Sharpens Focus
Devon Sharpens FocusDevon Sharpens Focus
Devon Sharpens Focus
 
Jp morgan okc bus tour may 16 16 - final
Jp morgan okc bus tour   may 16 16 - finalJp morgan okc bus tour   may 16 16 - final
Jp morgan okc bus tour may 16 16 - final
 
Project phoenix investor presentation 10232016_225pm_ct
Project phoenix investor presentation 10232016_225pm_ctProject phoenix investor presentation 10232016_225pm_ct
Project phoenix investor presentation 10232016_225pm_ct
 
Enlink Midstream NAPTP Presentation
Enlink Midstream NAPTP Presentation Enlink Midstream NAPTP Presentation
Enlink Midstream NAPTP Presentation
 
Crestwood MLPA 2017 Annual Investor Conference Presentation
Crestwood MLPA 2017 Annual Investor Conference PresentationCrestwood MLPA 2017 Annual Investor Conference Presentation
Crestwood MLPA 2017 Annual Investor Conference Presentation
 
Citi crestwood investor presentation_august 2016
Citi crestwood investor presentation_august 2016Citi crestwood investor presentation_august 2016
Citi crestwood investor presentation_august 2016
 
2017 12 capital one conference final
2017 12 capital one conference final2017 12 capital one conference final
2017 12 capital one conference final
 
Celp investor presentation march 2017 final
Celp investor presentation march 2017 finalCelp investor presentation march 2017 final
Celp investor presentation march 2017 final
 
Am website presentation (a) december 2016
Am website presentation (a)   december 2016Am website presentation (a)   december 2016
Am website presentation (a) december 2016
 
Am website presentation march 2016
Am website presentation   march 2016Am website presentation   march 2016
Am website presentation march 2016
 
Hpt investor presentation 4_q16_final
Hpt investor presentation  4_q16_finalHpt investor presentation  4_q16_final
Hpt investor presentation 4_q16_final
 
Midwest ideas final
Midwest ideas finalMidwest ideas final
Midwest ideas final
 
Am website presentation (c) february 2017
Am website presentation (c)   february 2017Am website presentation (c)   february 2017
Am website presentation (c) february 2017
 
Am website presentation april 2016
Am website presentation   april 2016Am website presentation   april 2016
Am website presentation april 2016
 

Similar to Investor presentation march 2016

Mlpa crestwood investor presentation_june 2016
Mlpa crestwood investor presentation_june 2016Mlpa crestwood investor presentation_june 2016
Mlpa crestwood investor presentation_june 2016CrestwoodCorporate
 
Crestwood investor deck march 2018
Crestwood investor deck march 2018Crestwood investor deck march 2018
Crestwood investor deck march 2018CrestwoodCorporate
 
Crestwood investor deck march 2018
Crestwood investor deck march 2018Crestwood investor deck march 2018
Crestwood investor deck march 2018CrestwoodCorporate
 
Crestwood investor deck february 2018
Crestwood investor deck february 2018Crestwood investor deck february 2018
Crestwood investor deck february 2018CrestwoodCorporate
 
Investor presentation november 2015 v final
Investor presentation november 2015 v finalInvestor presentation november 2015 v final
Investor presentation november 2015 v finalCrestwoodCorporate
 
Crestwood investor deck may 2018 v mlpa final
Crestwood investor deck may 2018 v mlpa finalCrestwood investor deck may 2018 v mlpa final
Crestwood investor deck may 2018 v mlpa finalCrestwoodCorporate
 
Crestwood investor deck december 2017
Crestwood investor deck december 2017Crestwood investor deck december 2017
Crestwood investor deck december 2017CrestwoodCorporate
 
Crestwood investor presentation march 2017
Crestwood investor presentation march 2017Crestwood investor presentation march 2017
Crestwood investor presentation march 2017CrestwoodCorporate
 
Crestwood investor deck january 2018
Crestwood investor deck january 2018Crestwood investor deck january 2018
Crestwood investor deck january 2018CrestwoodCorporate
 
JP Morgan Energy Equity Conference
JP Morgan Energy Equity ConferenceJP Morgan Energy Equity Conference
JP Morgan Energy Equity ConferenceCrestwoodCorporate
 
Crestwood investor-deck november-2017-v-final
Crestwood investor-deck november-2017-v-finalCrestwood investor-deck november-2017-v-final
Crestwood investor-deck november-2017-v-finalCrestwoodCorporate
 
Crestwood investor deck november 2018 v final
Crestwood investor deck november 2018 v finalCrestwood investor deck november 2018 v final
Crestwood investor deck november 2018 v finalCrestwoodCorporate
 
Crestwood investor presentation dec 2016
Crestwood investor presentation dec 2016Crestwood investor presentation dec 2016
Crestwood investor presentation dec 2016CrestwoodCorporate
 
Crestwood investor deck august 2018 v final
Crestwood investor deck august 2018 v finalCrestwood investor deck august 2018 v final
Crestwood investor deck august 2018 v finalCrestwoodCorporate
 
Crestwood investor presentation jan 2017
Crestwood investor presentation jan 2017Crestwood investor presentation jan 2017
Crestwood investor presentation jan 2017CrestwoodCorporate
 
Crestwood investor deck november 2018 v final
Crestwood investor deck november 2018 v finalCrestwood investor deck november 2018 v final
Crestwood investor deck november 2018 v finalCrestwoodCorporate
 
Increasing Efficiency and Lowering Costs in a Reduced Oil Price Environment -...
Increasing Efficiency and Lowering Costs in a Reduced Oil Price Environment -...Increasing Efficiency and Lowering Costs in a Reduced Oil Price Environment -...
Increasing Efficiency and Lowering Costs in a Reduced Oil Price Environment -...Energy Network marcus evans
 
Investor presentation august 2015
Investor presentation august 2015Investor presentation august 2015
Investor presentation august 2015CrestwoodCorporate
 
Crestwood investor presentation nov 2016
Crestwood investor presentation nov 2016Crestwood investor presentation nov 2016
Crestwood investor presentation nov 2016CrestwoodCorporate
 
Crestwood Equity Partners Investor Presentation for 2016 RBC Capital Markets ...
Crestwood Equity Partners Investor Presentation for 2016 RBC Capital Markets ...Crestwood Equity Partners Investor Presentation for 2016 RBC Capital Markets ...
Crestwood Equity Partners Investor Presentation for 2016 RBC Capital Markets ...Marcellus Drilling News
 

Similar to Investor presentation march 2016 (20)

Mlpa crestwood investor presentation_june 2016
Mlpa crestwood investor presentation_june 2016Mlpa crestwood investor presentation_june 2016
Mlpa crestwood investor presentation_june 2016
 
Crestwood investor deck march 2018
Crestwood investor deck march 2018Crestwood investor deck march 2018
Crestwood investor deck march 2018
 
Crestwood investor deck march 2018
Crestwood investor deck march 2018Crestwood investor deck march 2018
Crestwood investor deck march 2018
 
Crestwood investor deck february 2018
Crestwood investor deck february 2018Crestwood investor deck february 2018
Crestwood investor deck february 2018
 
Investor presentation november 2015 v final
Investor presentation november 2015 v finalInvestor presentation november 2015 v final
Investor presentation november 2015 v final
 
Crestwood investor deck may 2018 v mlpa final
Crestwood investor deck may 2018 v mlpa finalCrestwood investor deck may 2018 v mlpa final
Crestwood investor deck may 2018 v mlpa final
 
Crestwood investor deck december 2017
Crestwood investor deck december 2017Crestwood investor deck december 2017
Crestwood investor deck december 2017
 
Crestwood investor presentation march 2017
Crestwood investor presentation march 2017Crestwood investor presentation march 2017
Crestwood investor presentation march 2017
 
Crestwood investor deck january 2018
Crestwood investor deck january 2018Crestwood investor deck january 2018
Crestwood investor deck january 2018
 
JP Morgan Energy Equity Conference
JP Morgan Energy Equity ConferenceJP Morgan Energy Equity Conference
JP Morgan Energy Equity Conference
 
Crestwood investor-deck november-2017-v-final
Crestwood investor-deck november-2017-v-finalCrestwood investor-deck november-2017-v-final
Crestwood investor-deck november-2017-v-final
 
Crestwood investor deck november 2018 v final
Crestwood investor deck november 2018 v finalCrestwood investor deck november 2018 v final
Crestwood investor deck november 2018 v final
 
Crestwood investor presentation dec 2016
Crestwood investor presentation dec 2016Crestwood investor presentation dec 2016
Crestwood investor presentation dec 2016
 
Crestwood investor deck august 2018 v final
Crestwood investor deck august 2018 v finalCrestwood investor deck august 2018 v final
Crestwood investor deck august 2018 v final
 
Crestwood investor presentation jan 2017
Crestwood investor presentation jan 2017Crestwood investor presentation jan 2017
Crestwood investor presentation jan 2017
 
Crestwood investor deck november 2018 v final
Crestwood investor deck november 2018 v finalCrestwood investor deck november 2018 v final
Crestwood investor deck november 2018 v final
 
Increasing Efficiency and Lowering Costs in a Reduced Oil Price Environment -...
Increasing Efficiency and Lowering Costs in a Reduced Oil Price Environment -...Increasing Efficiency and Lowering Costs in a Reduced Oil Price Environment -...
Increasing Efficiency and Lowering Costs in a Reduced Oil Price Environment -...
 
Investor presentation august 2015
Investor presentation august 2015Investor presentation august 2015
Investor presentation august 2015
 
Crestwood investor presentation nov 2016
Crestwood investor presentation nov 2016Crestwood investor presentation nov 2016
Crestwood investor presentation nov 2016
 
Crestwood Equity Partners Investor Presentation for 2016 RBC Capital Markets ...
Crestwood Equity Partners Investor Presentation for 2016 RBC Capital Markets ...Crestwood Equity Partners Investor Presentation for 2016 RBC Capital Markets ...
Crestwood Equity Partners Investor Presentation for 2016 RBC Capital Markets ...
 

Recently uploaded

Nicola Mining Inc. Corporate Presentation April 2024
Nicola Mining Inc. Corporate Presentation April 2024Nicola Mining Inc. Corporate Presentation April 2024
Nicola Mining Inc. Corporate Presentation April 2024nicola_mining
 
OKC Thunder Reveal Game 2 Playoff T Shirts
OKC Thunder Reveal Game 2 Playoff T ShirtsOKC Thunder Reveal Game 2 Playoff T Shirts
OKC Thunder Reveal Game 2 Playoff T Shirtsrahman018755
 
《加州大学圣克鲁兹分校学位证书复制》Q微信741003700美国学历疑难问题指南|挂科被加州大学圣克鲁兹分校劝退没有毕业证怎么办?《UCSC毕业证购买|加...
《加州大学圣克鲁兹分校学位证书复制》Q微信741003700美国学历疑难问题指南|挂科被加州大学圣克鲁兹分校劝退没有毕业证怎么办?《UCSC毕业证购买|加...《加州大学圣克鲁兹分校学位证书复制》Q微信741003700美国学历疑难问题指南|挂科被加州大学圣克鲁兹分校劝退没有毕业证怎么办?《UCSC毕业证购买|加...
《加州大学圣克鲁兹分校学位证书复制》Q微信741003700美国学历疑难问题指南|挂科被加州大学圣克鲁兹分校劝退没有毕业证怎么办?《UCSC毕业证购买|加...wyqazy
 
WheelTug PLC Pitch Deck | Investor Insights | April 2024
WheelTug PLC Pitch Deck | Investor Insights | April 2024WheelTug PLC Pitch Deck | Investor Insights | April 2024
WheelTug PLC Pitch Deck | Investor Insights | April 2024Hector Del Castillo, CPM, CPMM
 
Osisko Gold Royalties Ltd - Corporate Presentation, April 23, 2024
Osisko Gold Royalties Ltd - Corporate Presentation, April 23, 2024Osisko Gold Royalties Ltd - Corporate Presentation, April 23, 2024
Osisko Gold Royalties Ltd - Corporate Presentation, April 23, 2024Osisko Gold Royalties Ltd
 
定制(UWIC毕业证书)英国卡迪夫城市大学毕业证成绩单原版一比一
定制(UWIC毕业证书)英国卡迪夫城市大学毕业证成绩单原版一比一定制(UWIC毕业证书)英国卡迪夫城市大学毕业证成绩单原版一比一
定制(UWIC毕业证书)英国卡迪夫城市大学毕业证成绩单原版一比一Fir La
 
Cyberagent_For New Investors_EN_240424.pdf
Cyberagent_For New Investors_EN_240424.pdfCyberagent_For New Investors_EN_240424.pdf
Cyberagent_For New Investors_EN_240424.pdfCyberAgent, Inc.
 
No 1 AMil Baba In Islamabad No 1 Amil Baba In Lahore No 1 Amil Baba In Faisl...
No 1 AMil Baba In Islamabad  No 1 Amil Baba In Lahore No 1 Amil Baba In Faisl...No 1 AMil Baba In Islamabad  No 1 Amil Baba In Lahore No 1 Amil Baba In Faisl...
No 1 AMil Baba In Islamabad No 1 Amil Baba In Lahore No 1 Amil Baba In Faisl...First NO1 World Amil baba in Faisalabad
 
如何办理密苏里大学堪萨斯分校毕业证(文凭)UMKC学位证书
如何办理密苏里大学堪萨斯分校毕业证(文凭)UMKC学位证书如何办理密苏里大学堪萨斯分校毕业证(文凭)UMKC学位证书
如何办理密苏里大学堪萨斯分校毕业证(文凭)UMKC学位证书Fir La
 
VIP 7001035870 Find & Meet Hyderabad Call Girls Miyapur high-profile Call Girl
VIP 7001035870 Find & Meet Hyderabad Call Girls Miyapur high-profile Call GirlVIP 7001035870 Find & Meet Hyderabad Call Girls Miyapur high-profile Call Girl
VIP 7001035870 Find & Meet Hyderabad Call Girls Miyapur high-profile Call Girladitipandeya
 
The Concept of Humanity in Islam and its effects at future of humanity
The Concept of Humanity in Islam and its effects at future of humanityThe Concept of Humanity in Islam and its effects at future of humanity
The Concept of Humanity in Islam and its effects at future of humanityJohanAspro
 

Recently uploaded (20)

Nicola Mining Inc. Corporate Presentation April 2024
Nicola Mining Inc. Corporate Presentation April 2024Nicola Mining Inc. Corporate Presentation April 2024
Nicola Mining Inc. Corporate Presentation April 2024
 
OKC Thunder Reveal Game 2 Playoff T Shirts
OKC Thunder Reveal Game 2 Playoff T ShirtsOKC Thunder Reveal Game 2 Playoff T Shirts
OKC Thunder Reveal Game 2 Playoff T Shirts
 
《加州大学圣克鲁兹分校学位证书复制》Q微信741003700美国学历疑难问题指南|挂科被加州大学圣克鲁兹分校劝退没有毕业证怎么办?《UCSC毕业证购买|加...
《加州大学圣克鲁兹分校学位证书复制》Q微信741003700美国学历疑难问题指南|挂科被加州大学圣克鲁兹分校劝退没有毕业证怎么办?《UCSC毕业证购买|加...《加州大学圣克鲁兹分校学位证书复制》Q微信741003700美国学历疑难问题指南|挂科被加州大学圣克鲁兹分校劝退没有毕业证怎么办?《UCSC毕业证购买|加...
《加州大学圣克鲁兹分校学位证书复制》Q微信741003700美国学历疑难问题指南|挂科被加州大学圣克鲁兹分校劝退没有毕业证怎么办?《UCSC毕业证购买|加...
 
young call girls in Yamuna Vihar 🔝 9953056974 🔝 Delhi escort Service
young  call girls in   Yamuna Vihar 🔝 9953056974 🔝 Delhi escort Serviceyoung  call girls in   Yamuna Vihar 🔝 9953056974 🔝 Delhi escort Service
young call girls in Yamuna Vihar 🔝 9953056974 🔝 Delhi escort Service
 
young call girls in Govindpuri 🔝 9953056974 🔝 Delhi escort Service
young call girls in Govindpuri 🔝 9953056974 🔝 Delhi escort Serviceyoung call girls in Govindpuri 🔝 9953056974 🔝 Delhi escort Service
young call girls in Govindpuri 🔝 9953056974 🔝 Delhi escort Service
 
WheelTug PLC Pitch Deck | Investor Insights | April 2024
WheelTug PLC Pitch Deck | Investor Insights | April 2024WheelTug PLC Pitch Deck | Investor Insights | April 2024
WheelTug PLC Pitch Deck | Investor Insights | April 2024
 
Call Girls in South Ex⎝⎝9953056974⎝⎝ Escort Delhi NCR
Call Girls in South Ex⎝⎝9953056974⎝⎝ Escort Delhi NCRCall Girls in South Ex⎝⎝9953056974⎝⎝ Escort Delhi NCR
Call Girls in South Ex⎝⎝9953056974⎝⎝ Escort Delhi NCR
 
Osisko Gold Royalties Ltd - Corporate Presentation, April 23, 2024
Osisko Gold Royalties Ltd - Corporate Presentation, April 23, 2024Osisko Gold Royalties Ltd - Corporate Presentation, April 23, 2024
Osisko Gold Royalties Ltd - Corporate Presentation, April 23, 2024
 
定制(UWIC毕业证书)英国卡迪夫城市大学毕业证成绩单原版一比一
定制(UWIC毕业证书)英国卡迪夫城市大学毕业证成绩单原版一比一定制(UWIC毕业证书)英国卡迪夫城市大学毕业证成绩单原版一比一
定制(UWIC毕业证书)英国卡迪夫城市大学毕业证成绩单原版一比一
 
Cyberagent_For New Investors_EN_240424.pdf
Cyberagent_For New Investors_EN_240424.pdfCyberagent_For New Investors_EN_240424.pdf
Cyberagent_For New Investors_EN_240424.pdf
 
No 1 AMil Baba In Islamabad No 1 Amil Baba In Lahore No 1 Amil Baba In Faisl...
No 1 AMil Baba In Islamabad  No 1 Amil Baba In Lahore No 1 Amil Baba In Faisl...No 1 AMil Baba In Islamabad  No 1 Amil Baba In Lahore No 1 Amil Baba In Faisl...
No 1 AMil Baba In Islamabad No 1 Amil Baba In Lahore No 1 Amil Baba In Faisl...
 
young Call girls in Dwarka sector 1🔝 9953056974 🔝 Delhi escort Service
young Call girls in Dwarka sector 1🔝 9953056974 🔝 Delhi escort Serviceyoung Call girls in Dwarka sector 1🔝 9953056974 🔝 Delhi escort Service
young Call girls in Dwarka sector 1🔝 9953056974 🔝 Delhi escort Service
 
Escort Service Call Girls In Shalimar Bagh, 99530°56974 Delhi NCR
Escort Service Call Girls In Shalimar Bagh, 99530°56974 Delhi NCREscort Service Call Girls In Shalimar Bagh, 99530°56974 Delhi NCR
Escort Service Call Girls In Shalimar Bagh, 99530°56974 Delhi NCR
 
Model Call Girl in Uttam Nagar Delhi reach out to us at 🔝9953056974🔝
Model Call Girl in Uttam Nagar Delhi reach out to us at 🔝9953056974🔝Model Call Girl in Uttam Nagar Delhi reach out to us at 🔝9953056974🔝
Model Call Girl in Uttam Nagar Delhi reach out to us at 🔝9953056974🔝
 
如何办理密苏里大学堪萨斯分校毕业证(文凭)UMKC学位证书
如何办理密苏里大学堪萨斯分校毕业证(文凭)UMKC学位证书如何办理密苏里大学堪萨斯分校毕业证(文凭)UMKC学位证书
如何办理密苏里大学堪萨斯分校毕业证(文凭)UMKC学位证书
 
Preet Vihar (Delhi) 9953330565 Escorts, Call Girls Services
Preet Vihar (Delhi) 9953330565 Escorts, Call Girls ServicesPreet Vihar (Delhi) 9953330565 Escorts, Call Girls Services
Preet Vihar (Delhi) 9953330565 Escorts, Call Girls Services
 
young call girls in Hauz Khas,🔝 9953056974 🔝 escort Service
young call girls in Hauz Khas,🔝 9953056974 🔝 escort Serviceyoung call girls in Hauz Khas,🔝 9953056974 🔝 escort Service
young call girls in Hauz Khas,🔝 9953056974 🔝 escort Service
 
Model Call Girl in Udyog Vihar Delhi reach out to us at 🔝9953056974🔝
Model Call Girl in Udyog Vihar Delhi reach out to us at 🔝9953056974🔝Model Call Girl in Udyog Vihar Delhi reach out to us at 🔝9953056974🔝
Model Call Girl in Udyog Vihar Delhi reach out to us at 🔝9953056974🔝
 
VIP 7001035870 Find & Meet Hyderabad Call Girls Miyapur high-profile Call Girl
VIP 7001035870 Find & Meet Hyderabad Call Girls Miyapur high-profile Call GirlVIP 7001035870 Find & Meet Hyderabad Call Girls Miyapur high-profile Call Girl
VIP 7001035870 Find & Meet Hyderabad Call Girls Miyapur high-profile Call Girl
 
The Concept of Humanity in Islam and its effects at future of humanity
The Concept of Humanity in Islam and its effects at future of humanityThe Concept of Humanity in Islam and its effects at future of humanity
The Concept of Humanity in Islam and its effects at future of humanity
 

Investor presentation march 2016

  • 1. Presentation Title Presentation Subtitle Crestwood Midstream Partners LP Crestwood Equity Partners LP Connections for America’s Energy ™ ™ Presentation Title Presentation Subtitle Crestwood Midstream Partners LP Crestwood Equity Partners LP Connections for America’s Energy ™ ™ Presentation Title Presentation Subtitle Crestwood Midstream Partners LP Crestwood Equity Partners LP Connections for America’s Energy ™ ™ 2/29/2016 Presentation Title Presentation Subtitle Crestwood Midstream Partners LP Crestwood Equity Partners LP Connections for America’s Energy ™ ™ Presentation Title Presentation Subtitle Crestwood Midstream Partners LP Crestwood Equity Partners LP Connections for America’s Energy ™ ™ Connections for America’s Energy ™ ™ Investor Presentation March 2016
  • 2. Connections for America’s Energy ™ ™ ™ ™ ™ ™ The statements in this communication regarding future events, occurrences, circumstances, activities, performance, outcomes and results are forward-looking statements. Although these statements reflect the current views, assumptions and expectations of Crestwood’s management, the matters addressed herein are subject to numerous risks and uncertainties which could cause actual activities, performance, outcomes and results to differ materially from those indicated. Such forward-looking statements include, but are not limited to, statements about the benefits that may result from the merger and statements about the future financial and operating results, objectives, expectations and intentions and other statements that are not historical facts. Factors that could result in such differences or otherwise materially affect Crestwood’s financial condition, results of operations and cash flows include, without limitation, the possibility that expected cost reductions will not be realized, or will not be realized within the expected timeframe; fluctuations in crude oil, natural gas and NGL prices (including, without limitation, lower commodity prices for sustained periods of time); the extent and success of drilling efforts, as well as the extent and quality of natural gas and crude oil volumes produced within proximity of Crestwood assets; failure or delays by customers in achieving expected production in their oil and gas projects; competitive conditions in the industry and their impact on our ability to connect supplies to Crestwood gathering, processing and transportation assets or systems; actions or inactions taken or non-performance by third parties, including suppliers, contractors, operators, processors, transporters and customers; the ability of Crestwood to consummate acquisitions, successfully integrate the acquired businesses, realize any cost savings and other synergies from any acquisition; changes in the availability and cost of capital; operating hazards, natural disasters, weather-related delays, casualty losses and other matters beyond Crestwood’s control; timely receipt of necessary government approvals and permits, the ability of Crestwood to control the costs of construction, including costs of materials, labor and right-of-way and other factors that may impact Crestwood’s ability to complete projects within budget and on schedule; the effects of existing and future laws and governmental regulations, including environmental and climate change requirements; the effects of existing and future litigation; and risks related to the substantial indebtedness, of either company, as well as other factors disclosed in Crestwood’s filings with the U.S. Securities and Exchange Commission. You should read filings made by Crestwood with the U.S. Securities and Exchange Commission, including Annual Reports on Form 10-K and the most recent Quarterly Reports and Current Reports for a more extensive list of factors that could affect results. Readers are cautioned not to place undue reliance on forward-looking statements, which reflect management’s view only as of the date made. Crestwood does not assume any obligation to update these forward-looking statements. Company Information 2 Forward-Looking Statements Contact Information Corporate Headquarters 700 Louisiana Street Suite 2550 Houston, TX 77002 (1) Market price as of 2/24/2016. (2) Unit count and balance sheet data as of 12/31/2015. Crestwood Equity Partners LP NYSE Ticker CEQP Market Capitalization ($MM)(1,2) $617 Enterprise Value ($MM)(2) $3,724 Annualized Distribution $5.50 Investor Relations investorrelations@crestwoodlp.com (713) 380-3081
  • 3. Connections for America’s Energy ™ ™ ™ ™ ™ ™ Key Investor Highlights 3
  • 4. Connections for America’s Energy ™ ™ ™ ™ ™ ™ • Solid execution in 2015 drives results; Adj. EBITDA increased 6%; OPEX and G&A expenses reduced 9%; LTM coverage ratio ~1.0x • Stable cash flow generation in 2016; ~60% of asset base flat to up 5% • Strong liquidity position; No senior note maturities until 2020 • Diverse and balanced operations located in the most economic US shale plays • Strong take-or-pay and fixed-fee contract portfolio; 92% take-or-pay and fixed fee in 2016 • No Incentive Distribution Rights • Strong sponsorship from First Reserve; $90MM units purchased Q415/Q116; Currently owns 23% common units Key Investor Highlights 4
  • 5. Connections for America’s Energy ™ ™ ™ ™ ™ ™ 2016 Outlook 5 Marketing, Supply & Logistics • Adjusted EBITDA: $95MM - $100MM • Flat cash flows in 2016 • Marketing business supported by hard assets and long-term relationships 2016E Adjusted EBITDA of $490 million to $520 million; ~60% of the business flat to up in 2016 2016E Segment Cash Flow Reduced CAPEX Gathering & Processing 43% Storage & Transportation 40% Marketing Supply & Logistics 17% 2016E Adj. EBITDA Guidance $490MM - $520MM Segment Outlook Storage & Transportation • Adjusted EBITDA: $225MM - $235MM • Volumes trending flat to up 5% in 2016 • NE S&T and COLT Hub take-or- pay contracts drive stable cash flow Gathering & Processing • Adjusted EBITDA: $235MM - $250MM • Volumes trending 15%-20% lower in 2016 • 2016E cash flow forecasts include conservative forecasts for Barnett and PRB Niobrara assets (1) Excludes corporate G&A expenses of $65 million. Segment Contribution (1) (1) ($MM) ($MM)
  • 6. Connections for America’s Energy ™ ™ ™ ™ ™ ™ Repositioning Crestwood in 2015/16 6 Corporate Structure 69.1 MM common units 62.1 MM preferred units In a challenging market, Crestwood continues to take actionable steps to improve its positioning and broaden its investment appeal No IDRs Key Items • In 2015, reduced O&M and G&A expenses by $26MM year-over-year through Project Adapt initiatives • Limiting growth capital expenditures to previously committed contractual projects Simplification Merger Cost Cutting / Reduced Capex • In 1Q 2015, completed Project Adapt to cut costs and improve processes and efficiencies • In 2Q 2015, restructured operations to Pipeline Services and Marketing, Supply & Logistics divisions • On September 30, 2015, closed merger between Crestwood Equity and Crestwood Midstream • Improved cost of capital by eliminating IDRs Deleverage Strategy • In 2016, Crestwood is pursuing strategic steps to strengthen the balance sheet in lower-for-longer environment • Evaluating full range of options, including further CAPEX and cost reductions, divesting of assets, and evaluating appropriate distribution level Streamlined Business
  • 7. Connections for America’s Energy ™ ™ ™ ™ ™ ™ Existing Scale and New Investment Opportunities in the Right Places 7 Bakken • Over 75% of cash flow is sourced from two premier basins: Marcellus and Bakken • Marcellus and Bakken cash flow trading multiples illustrate valuation disconnect • Delaware-Permian expansion projects provide opportunity to build third franchise position • Scale and diversity of remaining cash flows are competitively positioned across multiple resource plays Crestwood’s crude oil and natural gas operations are situated in the highest returning shale plays Marcellus
  • 8. Connections for America’s Energy ™ ™ ™ ™ ™ ™ Fixed-Fee Contracts Provide Safety Net 8 Contract Portfolio 2016E EBITDA Variable Rate Contracts 8% Take-or-Pay and Fixed-Fee Contracts 92%  92% of 2016E EBITDA from take-or-pay and fixed-fee contracts  Significant cash flow contribution protected from commodity change and volume reduction 55% of EBITDA is guaranteed through take- or-pay contracts YoY Margin Growth Despite Commodity Prices Adjusted EBITDA Crude Oil and Natural Gas Prices Crude Oil Natural Gas Y-o-Y Adj. EBITDA Growth: 6.4% Crude Oil decline: (61%) Natural Gas decline: (45%)
  • 9. Connections for America’s Energy ™ ™ ™ ™ ™ ™ $299 $253 $100 $150 $200 $250 $300 $350 4Q14 Annualized FY 2015 Expense / Fixed Charge Reduction Strategy 9 ($MM) Total Expenses Total Expenses by Segment Crestwood exceeded stated cost reduction goals in 2015; On-track to remove an additional $10MM in 2016 • In 2015, Crestwood materially reduced expenses and fixed charges to improve margins and coverage: – Reduced O&M and Adj. G&A(1) costs by $26.4 million in 2015 over 2014 – Additional 2016 cost savings of >$10MM; 2016+ run-rate savings of >$35MM • Results drive greater profitability in the current industry environment • Increased efficiency without sacrificing customer service, safety or compliance • Simplification adds to coverage improvement through fixed charge elimination (1) Adjusted G&A is defined as general and administrative expenses less unit-based compensation charges and significant transaction and environmental related costs and other items. (1) 4Q14 Annualized FY 2015 ($MM) Total Expenses Total Expenses Variance Gathering & Processing $109 $89 ($20) Storage & Transportation $27 $32 $5 Marketing, Supply & Logistics $79 $70 ($9) Adjusted G&A $84 $63 ($21) Total Expenses $299 $253 ($46) %-Change (15.4%)
  • 10. Connections for America’s Energy ™ ™ ™ ™ ™ ™ Consistent Operating and Financial Results 10 (1) See accompanying tables of non-GAAP reconciliations. (2) Cash flow margin is calculated by dividing Adj. EBITDA into Net Revenue. (3) Cash flow margin adjusted for Q4 2015 shut-in and weather impacts. Adjusted EBITDA and Margins(1) Natural Gas Volumes Improving financial performance demonstrates strong baseline cash flow; Q4 2015 strongly impacted by warm weather (2) Crude Oil Volumes $18.0 Q415 miss of $18mm attributable to unseasonably warm weather; depressed NE regional pricing (3) $118.5
  • 11. Connections for America’s Energy ™ ™ ™ ™ ™ ™ Capital Structure 11 Capitalization • Strong liquidity position – 1.5 billion revolving credit facility – ~50% drawn RCF balance • No near-term maturities; attractive long-term capital – $1.8 billion senior notes; 6.00%-6.25% coupon – Nearest maturity 2020 • Ample covenant cushion • Strong fixed charge coverage • No need to access capital markets in 2016 Crestwood has ample liquidity to execute business plan in challenging market Debt Maturities No near-term debt maturities RCF 6% Notes 6.125% Notes 6.25% Notes ($ millions) 12/31/2015 Cash $0.5 Total Debt $2,540.3 Total Partners' Capital $2,946.9 Total Capitalization $5,487.2 Credit & Liquidity Stats Total Leverage Ratio 4.75x Senior Secured Leverage Ratio 1.37x Total Leverage Covenant 5.50x Senior Secured Leverage Covenant 3.75x Summary ($MM)
  • 12. Connections for America’s Energy ™ ™ ™ ™ ™ ™ • Diverse customer base is comprised of integrated producers, refiners, utilities, and petrochemical companies • The majority of customers well-positioned to navigate a lower-for-longer environment • Crestwood is actively monitoring at-risk counterparties to mitigate cash flow risk in 2016 • Highly confident in contractual positioning to mitigate cash flow loss from potential bankruptcies Quicksilver Resources • Filed for bankruptcy March 2015; Began sales process in Q4 2015 • BlueStone Natural Resources emerged as winning bidder; Must close by March 2016 • Binding agreement in place with the back up bidder • Long-term resolution likely by Q2 2016 Manageable Counterparty Risk 12 Crestwood has a diverse customer portfolio; producer counterparty risk manageable in the event of continued market deterioration 2016E Cash Flow ExposureCounterparty Risk Overview Manageable counterparty risk in 2016 (1) (1) Represents total annual cash flow contributions from higher risk counterparties.
  • 13. Connections for America’s Energy ™ ™ ™ ™ ™ ™ Core Operations Update 13
  • 14. Connections for America’s Energy ™ ™ ™ ™ ™ ™ • Bakken has continued to produce sufficient producer wellhead returns – 94% of rigs operating in four counties (McKenzie, Williams, Mountrail, Dunn) – ~340 permits have been filed in those four counties in last 120 days – Estimated breakeven WTI pricing of $24- $41/bbl in these four core counties – Producers improved IP rates, realized cost reductions, and minimized cost to market – Reducing days to drill to 10-12 days • Crestwood producers continue to achieve strong results: – In the last 120 days, Arrow producers have filed approximately 100 permits in the Bakken – Halcon expects 2016 wells put online to have an EUR of ~900 Mboe; average D&C of $6.2MM – Whiting reported 24-hr IP rate of 4,300 Boe/d on Crestwood’s system Bakken Producers Remain Active Around Crestwood’s Assets 14 Permits Filed in Last 120 Days Permits Heat Map By Arrow Producers 9 2 38 48 Source: North Dakota Industrial Commission As of February 24, 2016.
  • 15. Connections for America’s Energy ™ ™ ™ ™ ™ ™ 0 25 50 75 100 125 Q1:14 Q2:14 Q3:14 Q4:14 Q1:15 Q2:15 Q3:15 Q4:15 GatheringVolumes(Mboe/d) Crude Oil Natural Gas Water $0 $5 $10 $15 $20 $25 Q1:14 Q2:14 Q3:14 Q4:14 Q1:15 Q2:15 Q3:15 Q4:15 AdjustedEBITDA($MM) Bakken Arrow Gathering System 15 Tier 1 acreage dedication with substantial long-term growth through system build out Summary • ~150,000 acre dedication under LT contracts • Crude, natural gas and water gathering • Producers continuing active development through aid- in-construction lateral requests • Lower operating cost in 2015 improves margin • Arrow volumes have increased 14% year-over-year and 76% since Q1 2014 • Arrow system connected to COLT Hub through Tesoro and Hiland crude oil pipelines Long-Term Outlook • >1,200 estimated future drilling locations • 45-55 new well connects expected in 2016 – XTO, WPX and QEP approximately 90% of 2016 development activity • Achieved record crude volume of 80 MBbls/d in October 2015 (1) Natural gas converted to barrels at 6:1. Arrow Adjusted EBITDA Increasing Gathering Volumes from Continued Drilling Activity (1)
  • 16. Connections for America’s Energy ™ ™ ™ ™ ™ ™ Bakken COLT Hub and Connector 16 COLT Hub is the leading Bakken CBR facility linking Bakken crude supply to prime refinery markets Source: Genscape February 2016; EIA. Summary • Premier crude oil pipeline, storage and CBR facility in the Bakken • 160 MBbls/d crude-by-rail facility; 1.2 MMBbls storage capacity; 70 MBbls/d COLT connector pipeline • ~300 MBbls/d supply aggregation capacity at COLT Hub (gathering, truck rack, pipelines) • Strong refiner customers dependent on the Bakken barrel and crude-by-rail transportation Top 5 Bakken CBR Facilities COLT Hub Customers Maintaining Market Share Going into 2016 BakkenPipeline/Crude-by-Rail(Bbls/d) • Pipeline and CBR remain >1,000 Bbls/d − 67% Pipeline / 33% CBR • Crestwood’s COLT Hub currently ~25% CBR market share
  • 17. Connections for America’s Energy ™ ™ ™ ™ ™ ™ $10 $15 $20 $25 $30 $35 $40 $45 Q1:14 Q2:14 Q3:14 Q4:14 Q1:15 Q2:15 Q3:15 Q4:15 AdjustedEBITDA($MM) 17 NE Marcellus Storage and Transportation Summary 200 MMcf/d North-South Expansion Wilmot Receipt Point MARC I Transco Meter Long-Term Outlook • ~3.5 Bcf/d Marcellus dry gas supply access through upstream gathering and producer connections • 530 MMcf/d receipt point at Wilmot in-service • MARC I – In Q4 2015, secured two anchor shippers for 120 MMcf/d on expansion to Transco • MARC II – Non-binding indications of interest >700 MMcf/d support connecting MARC I with PennEast Critical infrastructure for NE demand markets (NYC) provide significant level of contracted cash flows and growth opportunities Storage • Irreplaceable storage position with top East Coast utility customers: Con Ed, NJNG, NYSEG, PSEG • ~41 Bcf of natural gas storage; 99% subscribed Transportation • MARC I / North-South pipeline capacity of ~2.0 Bcf/d connecting to premium north east markets (Millennium, TGP, Transco) • North-South Pipeline – 200 MMcf/d expansion completed in 2014; expansion fully contracted Consistent Cash Flow from Take-or-Pay Contracts
  • 18. Connections for America’s Energy ™ ™ ™ ™ ™ ™ • 20-year, fixed-fee contracts for gathering and compression services with Antero Resources − ~140,000 acre dedication (235 wells connected) − ~1,850 Antero drilling locations on Crestwood dedication − Average IP rate for 2015 well connects of 18 MMcf/d on Crestwood’s acreage − Current system capacity of 875 MMcf/d − 450 MMcf/d MVC on gathering system; compression MVC at ~50% of design capacity • Current YTD average volumes of 480 MMcf/d SW Marcellus Gathering & Compression 18 Long-term fee-based contracts in southwest Marcellus core production window Summary Markwest Sherwood Processing Greenbrier Rich Gas Area Crestwood Dedication Area Antero Midstream Dedication Area Key Drivers for Future Drilling • Antero has 22 DUCs connected to Crestwood’s system; Antero expects to bring all of these wells online in 2017 • Q4 2015: Regional gathering pipeline provides access to premium priced markets • New Southwest Marcellus / Utica pipeline takeaway projects: − Antero: 4.0 Bcf/d of firm takeaway by YE2017 will increase favorable price index exposure to 94% of sales1 − SW Marcellus / Utica region: >20 Bcf/d of new firm takeaway by YE2018 will dramatically increase SW Marcellus netbacks • Dry gas economics improving with challenged northeast liquids prices (1) See November Antero Resources company presentation.
  • 19. Connections for America’s Energy ™ ™ ™ ™ ™ ™ Delaware-Permian: Reservoir Overview 19 • The Delaware-Permian offers stacked pay potential and low break-even economics • Substantial drilling activity in the past five years has focused on the Wolfcamp and Bone Spring formations Wolfcamp Western Frontier Bone Spring Western Fairway Wolfcamp Reeves Core NorthernDelawareSouthernDelaware Source: Wood Mackenzie May playbook. Willow Lake 3-Stream Gathering Project Summary Delaware-Permian Map Crestwood’s developing position is located in the core of the Wolfcamp and Bone Spring formations Wolfcamp Bone Spring • Crestwood’s developing projects are located in the Western Frontier and Reeves Core • Western Frontier – Largest expected recoveries, primarily condensate, highest avg. API gravity in the Wolfcamp – Avg. well profile: 820 Mboe EUR, 723 Boe/d IP-30, and 24% oil • Reeves Core – Lowest breakeven sub-play in the Delaware Basin, substantial de-risking since 2013 – Avg. well profile: 600 Mboe EUR, 720 Boe/d IP-30, and 59% oil • Crestwood’s current asset footprint is located in the Western Fairway • Western Fairway – Top producing Bone Spring sub-play in 2015 – Avg. well profile: 589 Mboe EUR, 687 Boe/d IP-30, and 30% oil
  • 20. Connections for America’s Energy ™ ™ ™ ™ ™ ™ Delaware-Permian: Expansion Projects 20 Crestwood is actively expanding its footprint in the heart of the Delaware Permian Basin, the most active shale play in the US Other Long-Term Opportunities • Integrated gas, condensate, and water gathering system • 600 miles of pipelines spanning over 400,000 acres • Full development to include 109,200 of horsepower from 65 compression units at 8 centralized compressor stations 3-Stream Gathering System Proposed Expansion Map • Orla Terminal: − Capacity of 200 MBbls of crude oil tankage − 8 truck loading and unloading bays; up to 64 MBbls/d − Additional services include blending, condensate stabilization and 3rd party trucking services • Delta Pipeline − Condensate pipeline header from Orla to multiple outlets providing access to Cushing, Houston, & Corpus Christi − ~180 mile, 20” pipeline, 200 MBbls/d of capacity 2 3 3 2 1 Willow Lake Expansion • Expanded processing capacity to 50 MMcf/d • 41 new wells dedicated to be completed in 2016/2017 • Projects: Dublin Ranch to Willow Lake connector, RJT skid, upsized interconnects for increased residue take-away options • Placed into service January 2016; on schedule 1 3 Willow Lake Delta Pipeline Orla Terminal 3-Stream Gathering System
  • 21. Connections for America’s Energy ™ ™ ™ ™ ™ ™ • Leading marketer of Marcellus/Utica NGLs • 2.8 MMBbls of Northeast US NGL storage capacity; >500 NGL trucking units; >1,600 NGL railcars • Sources, transports, stores and delivers NGLs to domestic and export markets; >350 customers • Commenced LPG exports through Marcus Hook, PA • New LPG terminals in WY, RI and NC underway • Strong NGL supply continues to push prices lower creating a buying opportunity to build seasonal storage • Marketing opportunities to diversify in the West Coast and Rocky Mountain regions 21 Crestwood NGL Assets and Services Servicing Blue Chip Customers Crestwood is well-positioned to benefit from continued Marcellus/Utica NGL supply growth through its integrated logistics platform including Bath and Seymour storage, ME2 pipeline capacity and Marcus Hook export capability Summary Leading Marcellus/Utica NGL Logistics Platform Marcus Hook NGL Exports Bath NGL Storage Seymour NGL Storage 60 15 34 88 75 218 2015E = 490 MBPD UEO-CHK Dominion Blue Racer Crestwood BP Markwest
  • 22. Connections for America’s Energy ™ ™ ™ ™ ™ ™ The Crestwood Investment Opportunity No Incentive Distribution Rights 22 1 Substantial Expense / Fixed Charge Reduction 2 Solid Financial Results year-over-year 3 Diversified / Balanced Portfolio 4 Fixed Fee / Firm Contract Profile 5 Current Valuation Not Indicative of Business Fundamentals Leveraged to Volume Growth with Commodity Price Upside 1 Cost of Capital Improvement 2 Expansion Opportunities in Delaware Permian Basin and NE S&T 3 Strengthened Balance Sheet in 2016 4 Attractive Valuation Entry Point 5 Execution Drives Significant Upside Return Opportunity Strong Liquidity / No near-term maturities 6
  • 23. Connections for America’s Energy ™ ™ ™ ™ ™ ™ Non-GAAP Reconciliations 23
  • 24. Connections for America’s Energy ™ ™ ™ ™ ™ ™ CEQP Non-GAAP Reconciliations 24 (in millions, unaudited) 4th Qtr 3rd Qtr 2nd Qtr 1st Qtr 4th Qtr 3rd Qtr 2nd Qtr 1st Qtr EBITDA Net income (loss) (1,402.4)$ (623.4)$ (296.0)$ 18.1$ (30.7)$ 11.9$ (4.8)$ 13.2$ Interest and debt expense, net 35.4 35.7 35.4 33.6 31.3 31.5 32.6 31.7 Loss on modification/extinguishment of debt 0.2 2.7 17.1 — — — — — Provision (benefit) for income taxes (1.2) (0.3) (0.3) 0.4 — 0.1 0.2 0.8 Depreciation, amortization and accretion 75.6 75.5 74.8 74.2 76.1 71.7 71.2 66.3 EBITDA (a) (1,292.4)$ (509.8)$ (169.0)$ 126.3$ 76.7$ 115.2$ 99.2$ 112.0$ Significant items impacting EBITDA: Unit-based compensation charges 4.1 3.9 5.9 5.8 4.9 4.8 6.2 5.4 (Gain) loss on long-lived assets, net 817.3 2.3 0.6 1.0 2.7 0.9 (1.2) (0.5) Goodwill impairment 515.4 609.9 281.0 — 48.8 — — — Loss on contingent consideration — — — — — — 6.5 2.1 (Earnings) loss from unconsolidated affiliates, net 72.0 (2.8) (5.0) (3.4) (0.6) (0.3) 1.5 0.1 Adjusted EBITDA from unconsolidated affiliates, net 6.9 6.2 5.7 6.5 2.9 1.9 0.4 1.7 Change in fair value of commodity inventory-related derivative contracts (5.3) 8.1 1.5 1.1 (3.5) 1.0 2.9 (10.7) Significant transaction and environmental related costs and other items 0.9 15.7 12.4 4.6 0.8 5.4 2.2 6.5 Adjusted EBITDA (a) 118.9$ 133.5$ 133.1$ 141.9$ 132.7$ 128.9$ 117.7$ 116.6$ Distributable Cash Flow Adjusted EBITDA (a) 118.9 133.5 133.1 141.9 132.7 128.9 117.7 116.6 Cash interest expense (b) (33.5) (33.7) (33.3) (31.8) (29.4) (30.3) (31.2) (30.4) Maintenance capital expenditures (c) (10.0) (4.1) (3.9) (5.4) (9.4) (4.8) (5.7) (7.0) (Provision) benefit for income taxes 1.2 0.3 0.3 (0.4) — (0.1) (0.2) (0.8) Deficiency payments (0.9) (0.6) 5.7 (0.6) 3.5 2.3 3.8 1.1 Distributable cash flow attributable to CEQP 75.7$ 95.4$ 101.9$ 103.7$ 97.4$ 96.0$ 84.4$ 79.5$ Distirbutions to Niobrara Preferred (3.8) (3.8) (3.8) (3.8) — — — — Distributable cash flow attributable to CEQP common (d) 71.9$ 91.6$ 98.1$ 99.9$ 97.4$ 96.0$ 84.4$ 79.5$ (b) Cash interest expense less amortization of deferred financing costs plus bond premium amortization plus or minus fair value adjustment of interest rate swaps. (c) M aintenance capital expenditures are defined as those capital expenditures which do not increase operating capacity or revenues from existing levels. (d) Distributable cash flow is defined as Adjusted EBITDA, less cash interest expense, maintenance capital expenditures, income taxes, and deficiency payments (primarily related to deferred revenue). Distributable cash flow should not be considered an alternative to cash flows from operating activities or any other measure of financial performance calculated in accordance with generally accepted accounting principles as those items are used to measure operating performance, liquidity, or the ability to service debt obligations. We believe that distributable cash flow provides additional information for evaluating our ability to declare and pay distributions to unitholders. Distributable cash flow, as we define it, may not be comparable to distributable cash flow or similarly titled measures used by other corporations and partnerships. 20142015 CRESTWOOD EQUITY PARTNERS LP Reconciliation of Non-GAAP Financial Measures (a) EBITDA is defined as income before income taxes, plus debt-related costs (net interest and debt expense and loss on modification/extinguishment of debt) and depreciation, amortization and accretion expense. In addition, Adjusted EBITDA considers the adjusted earnings impact of our unconsolidated affiliates by adjusting our equity earnings or losses from our unconsolidated affiliates for our proportionate share of their depreciation and interest. Adjusted EBITA also considers the impact of certain significant items, such as unit-based compensation charges, gains and impairments of long-lived assets and goodwill, gains and losses on acquisition-related contingencies, third party costs incurred related to potential and completed acquisitions, certain environmental remediation costs, certain costs related to our 2015 cost savings initiatives, the change in fair value of commodity inventory-related derivative contracts, and other transactions identified in a specific reporting period. The change in fair value of commodity inventory-related derivative contracts is considered in determining Adjusted EBITDA given that the timing of recognizing gains and losses on these derivative contracts differs from the recognition of revenue for the related underlying sale of inventory that these derivatives relate to. Changes in the fair value of other derivative contracts is not considered in determining Adjusted EBITDA given the relatively short-term nature of those derivative contracts. EBITDA and Adjusted EBITDA are not measures calculated in accordance with GAAP, as they do not include deductions for items such as depreciation, amortization and accretion, interest and income taxes, which are necessary to maintain our business. EBITDA and Adjusted EBITDA should not be considered an alternative to net income, operating cash flow or any other measure of financial performance presented in accordance with GAAP. EBITDA and Adjusted EBITDA calculations may vary among entities, so our computation may not be comparable to measures used by other companies.