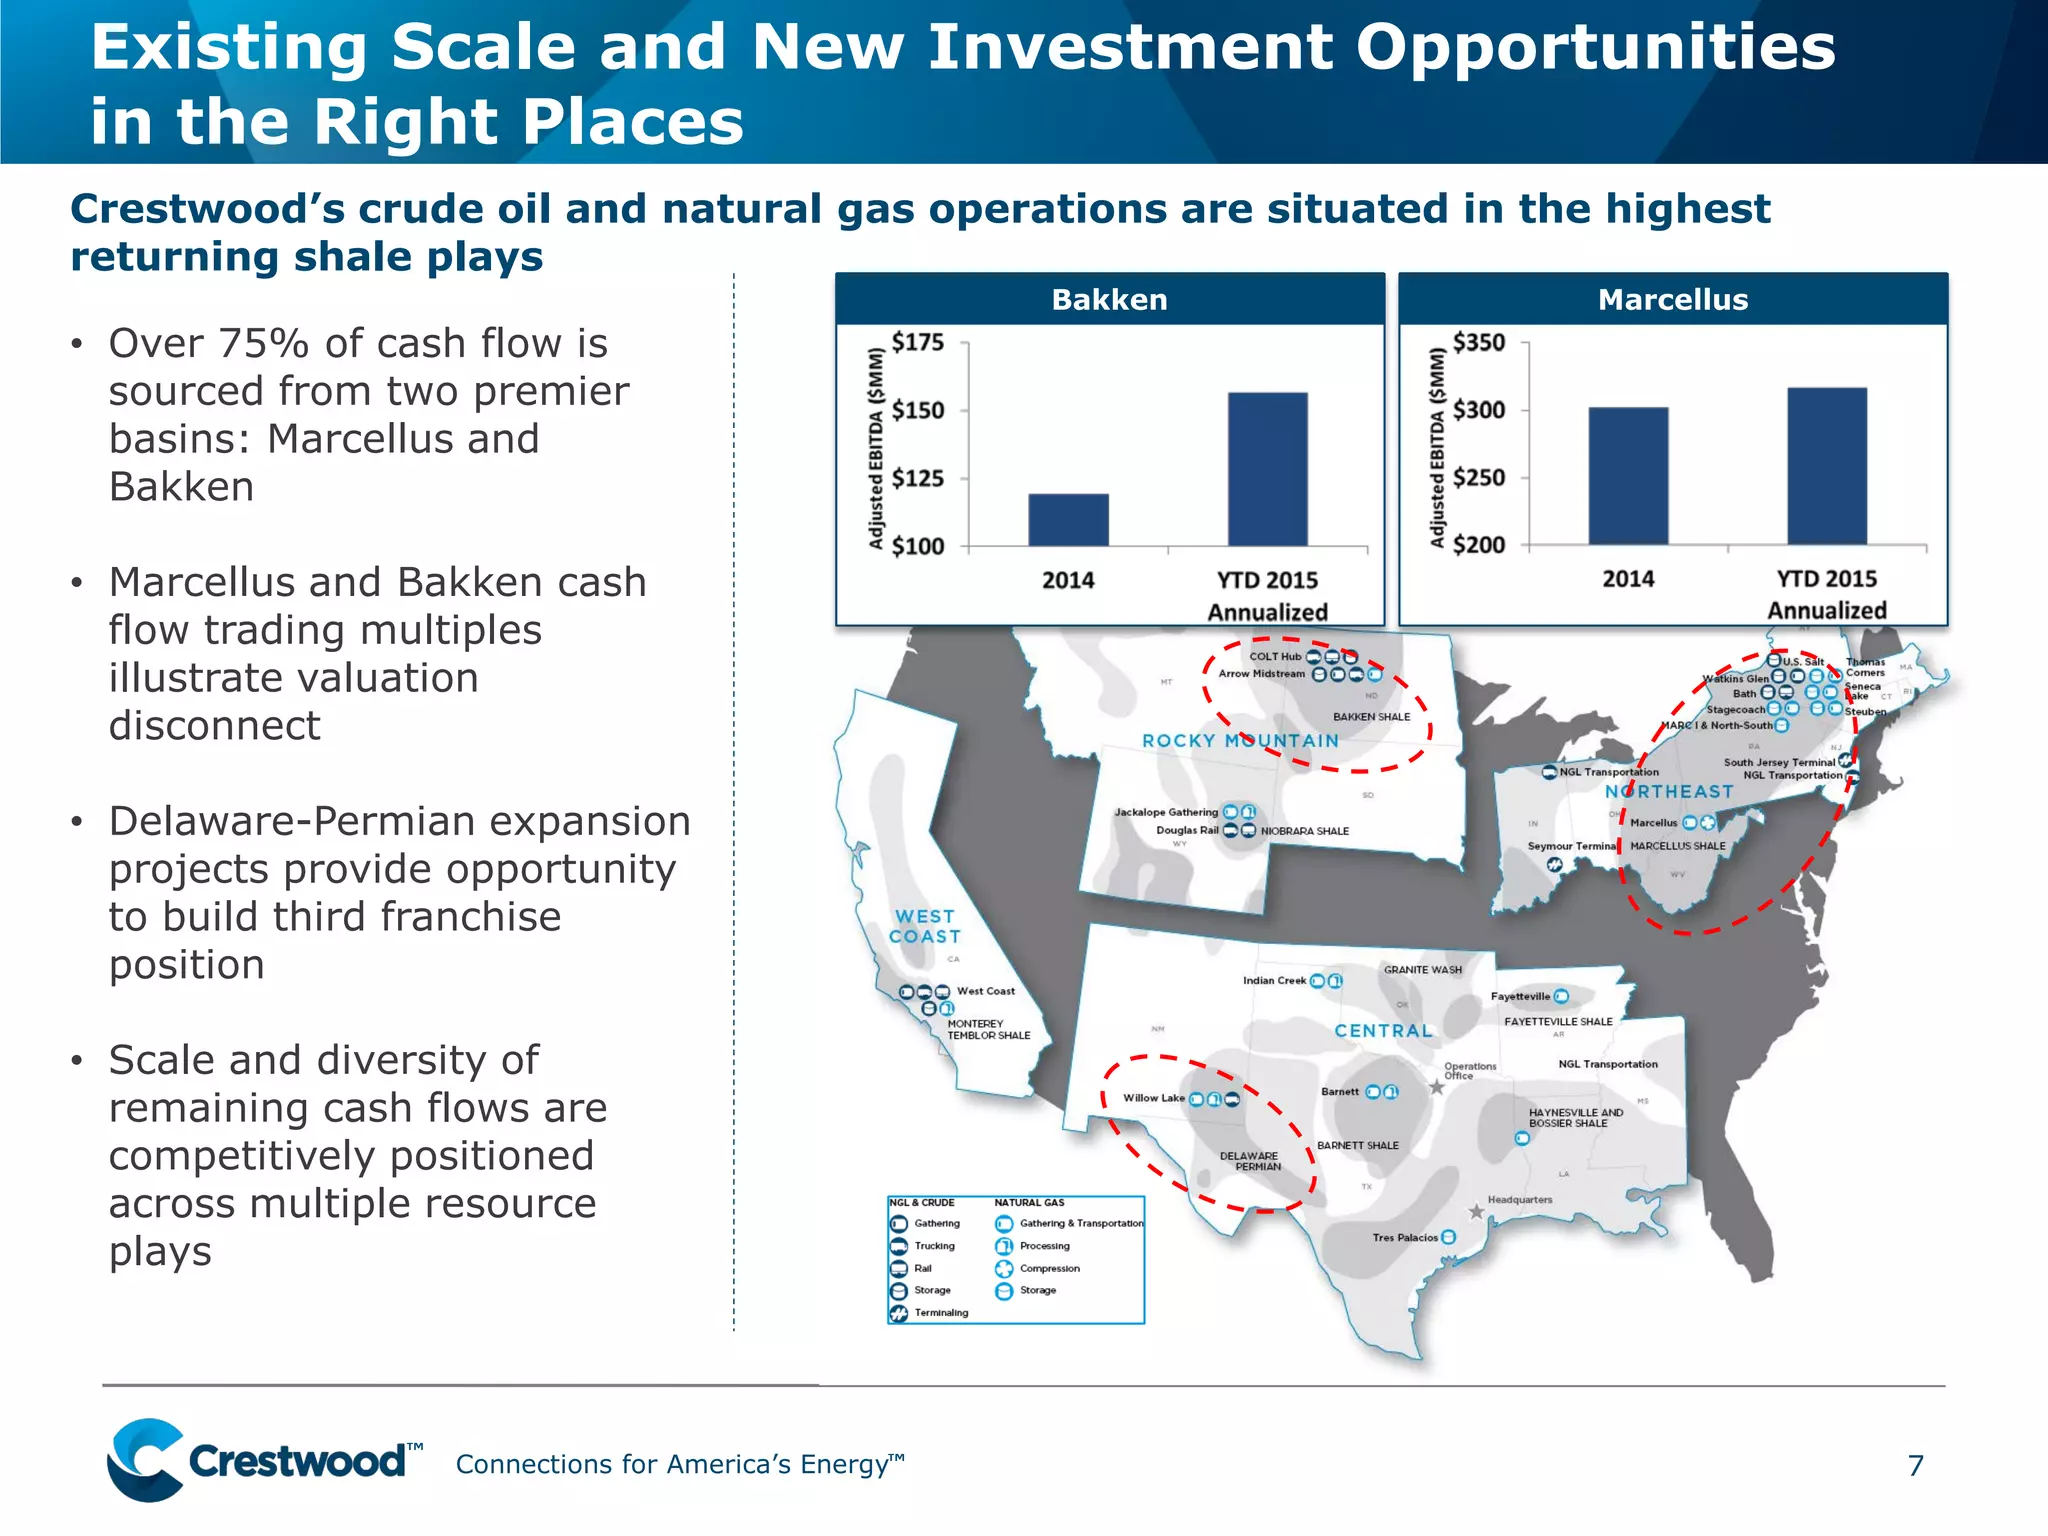
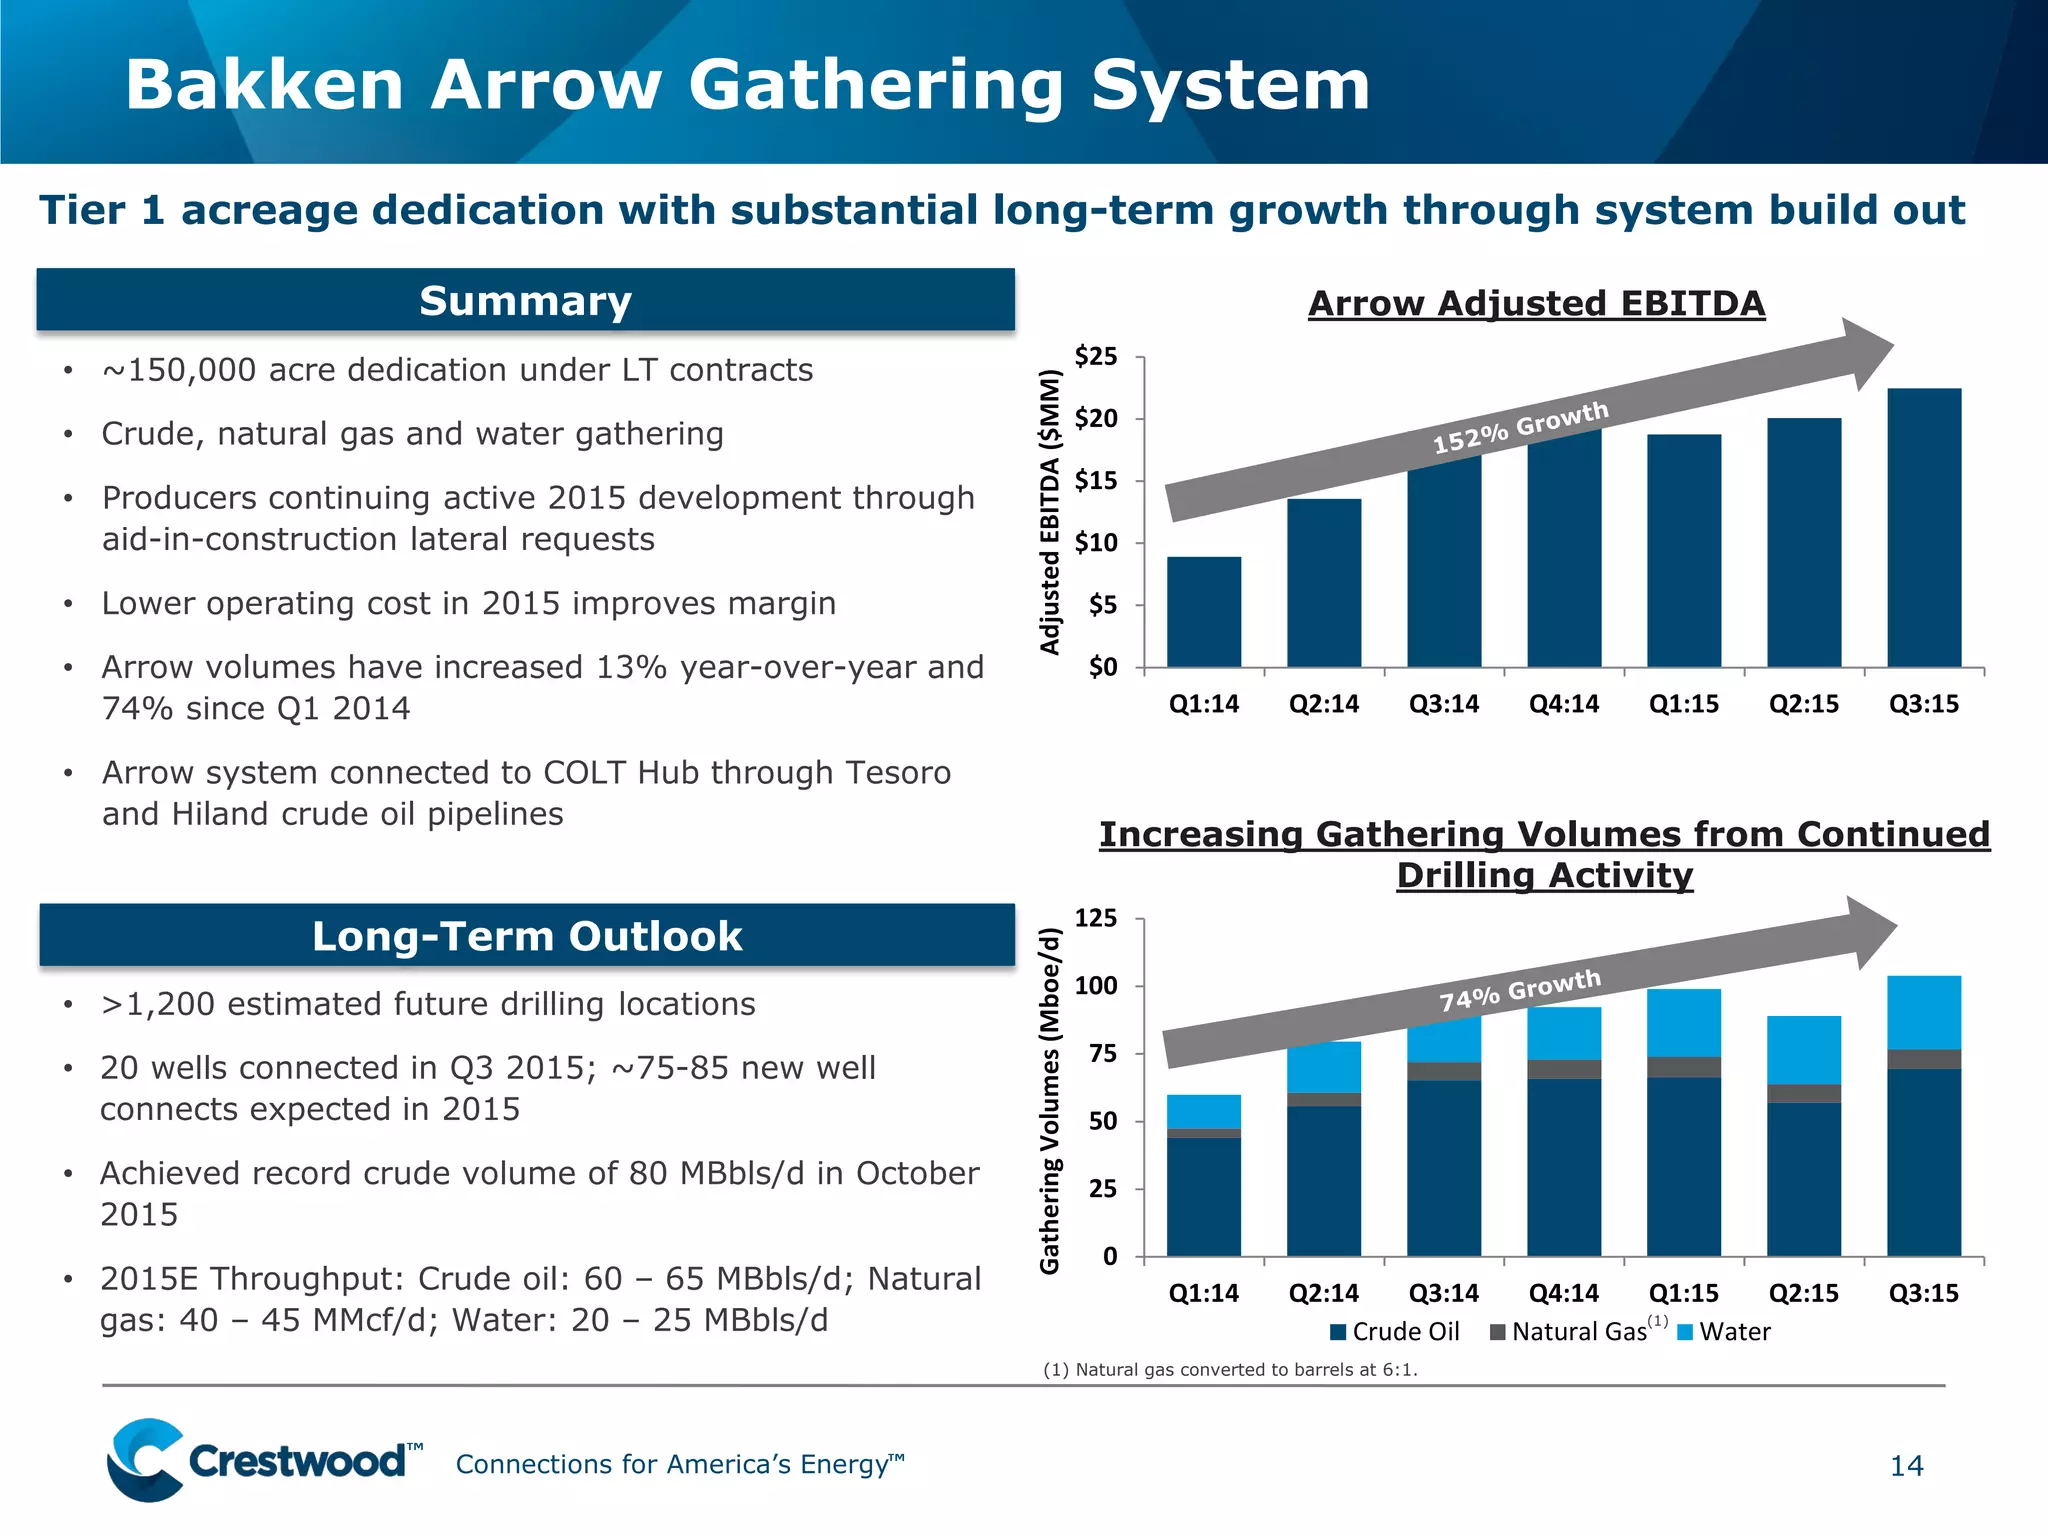
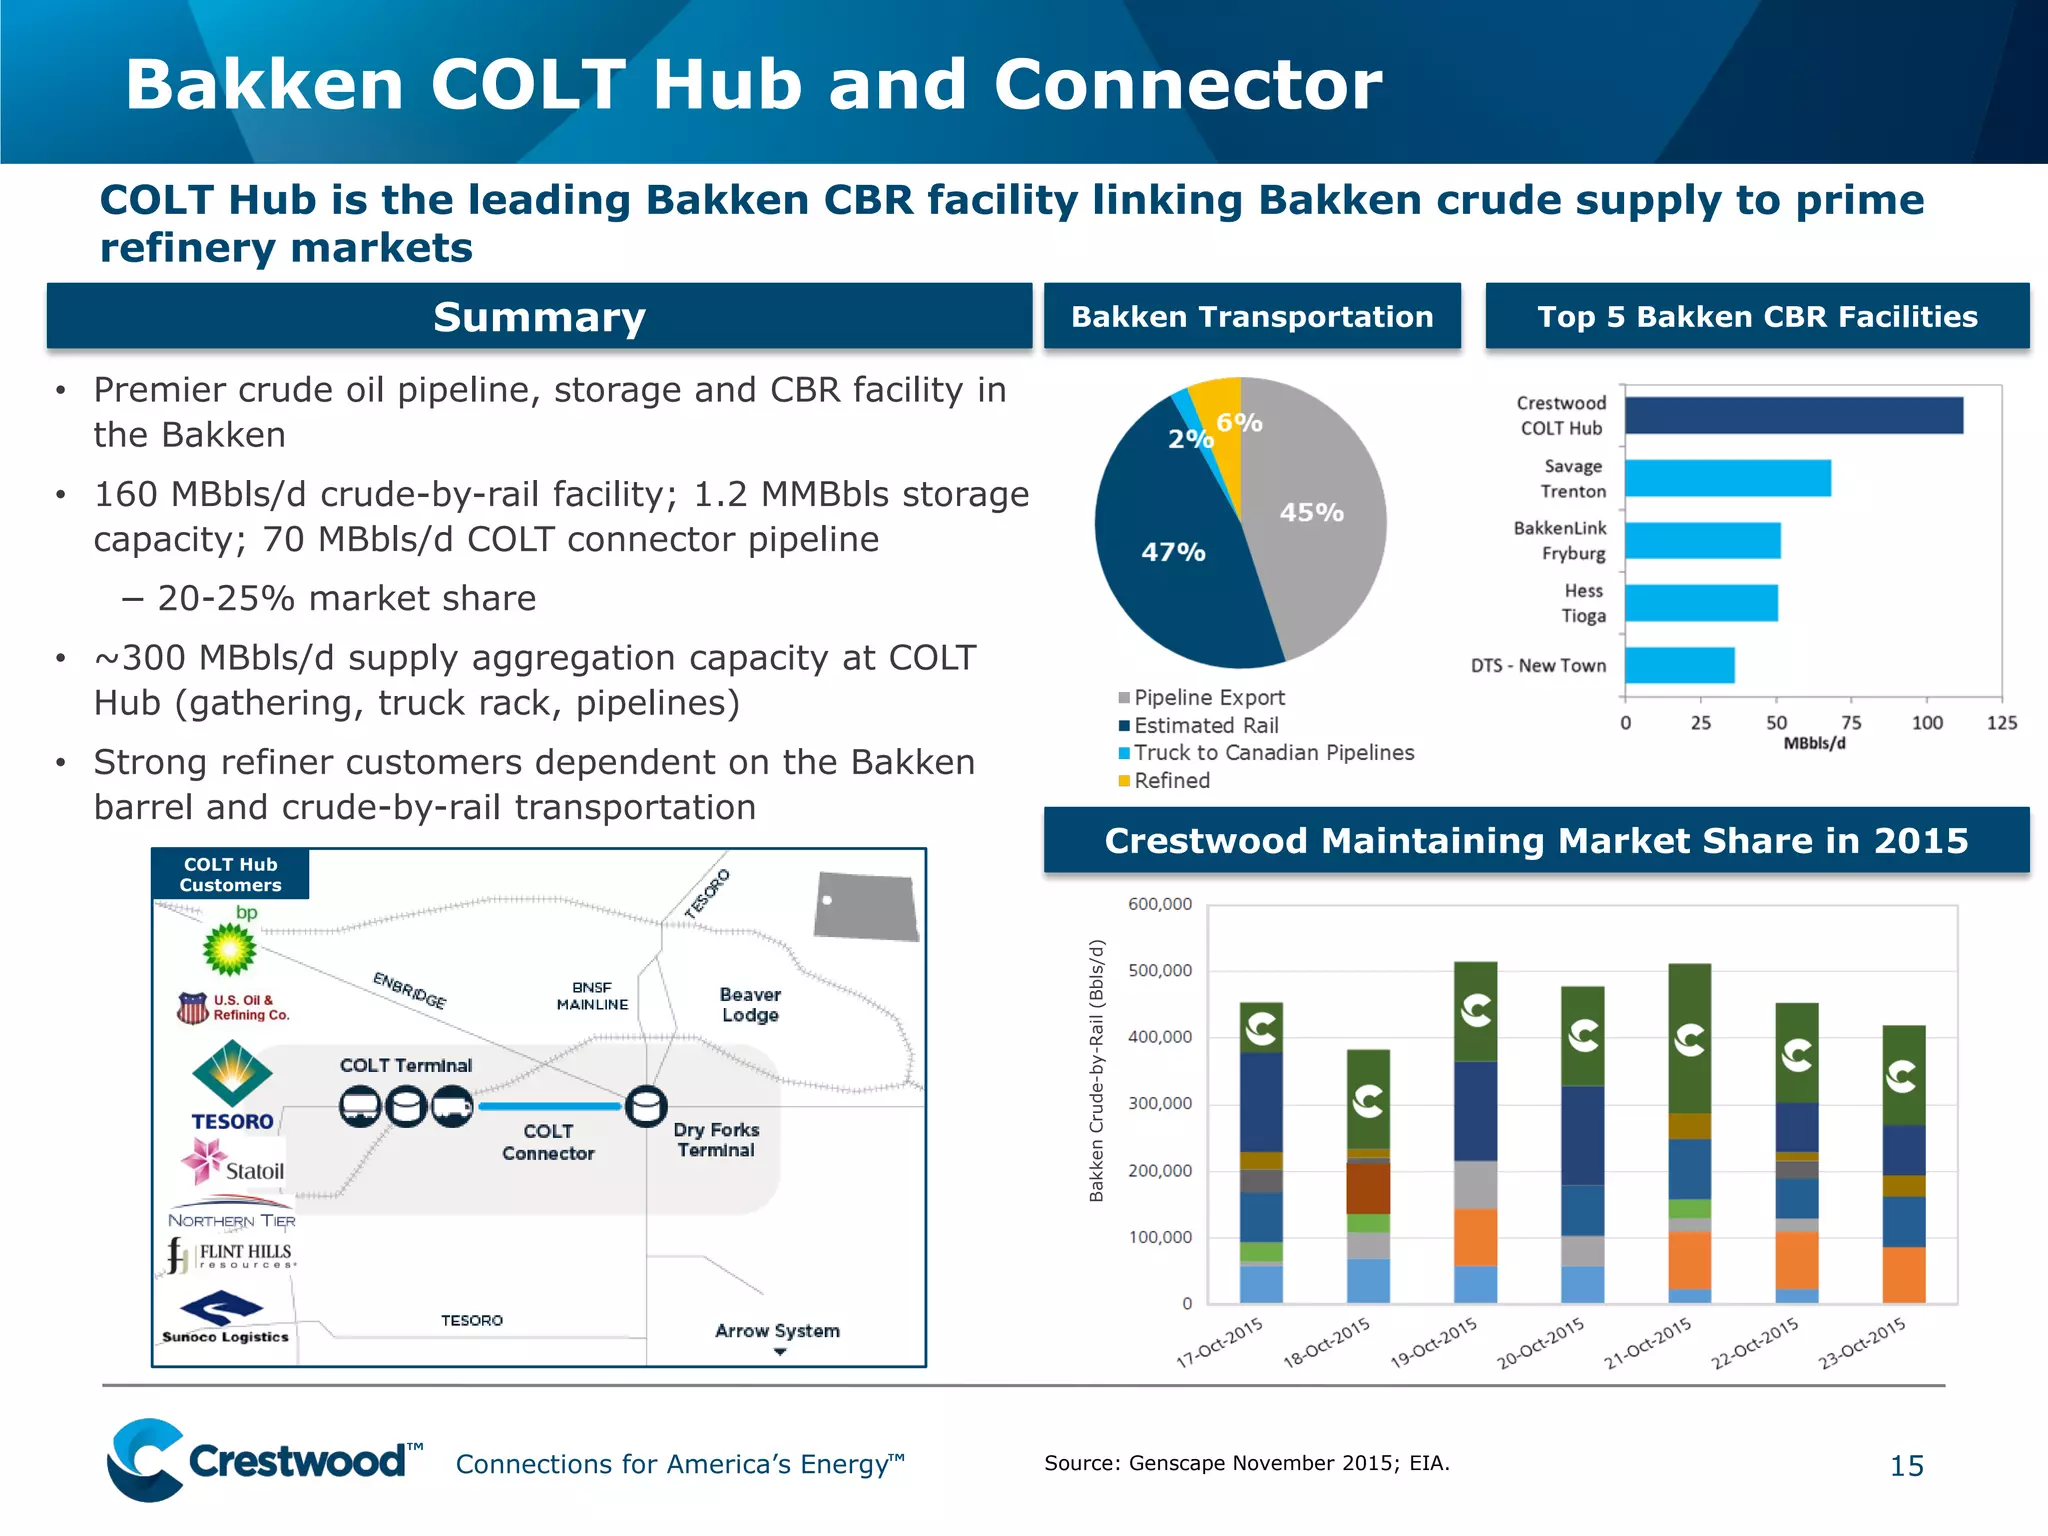
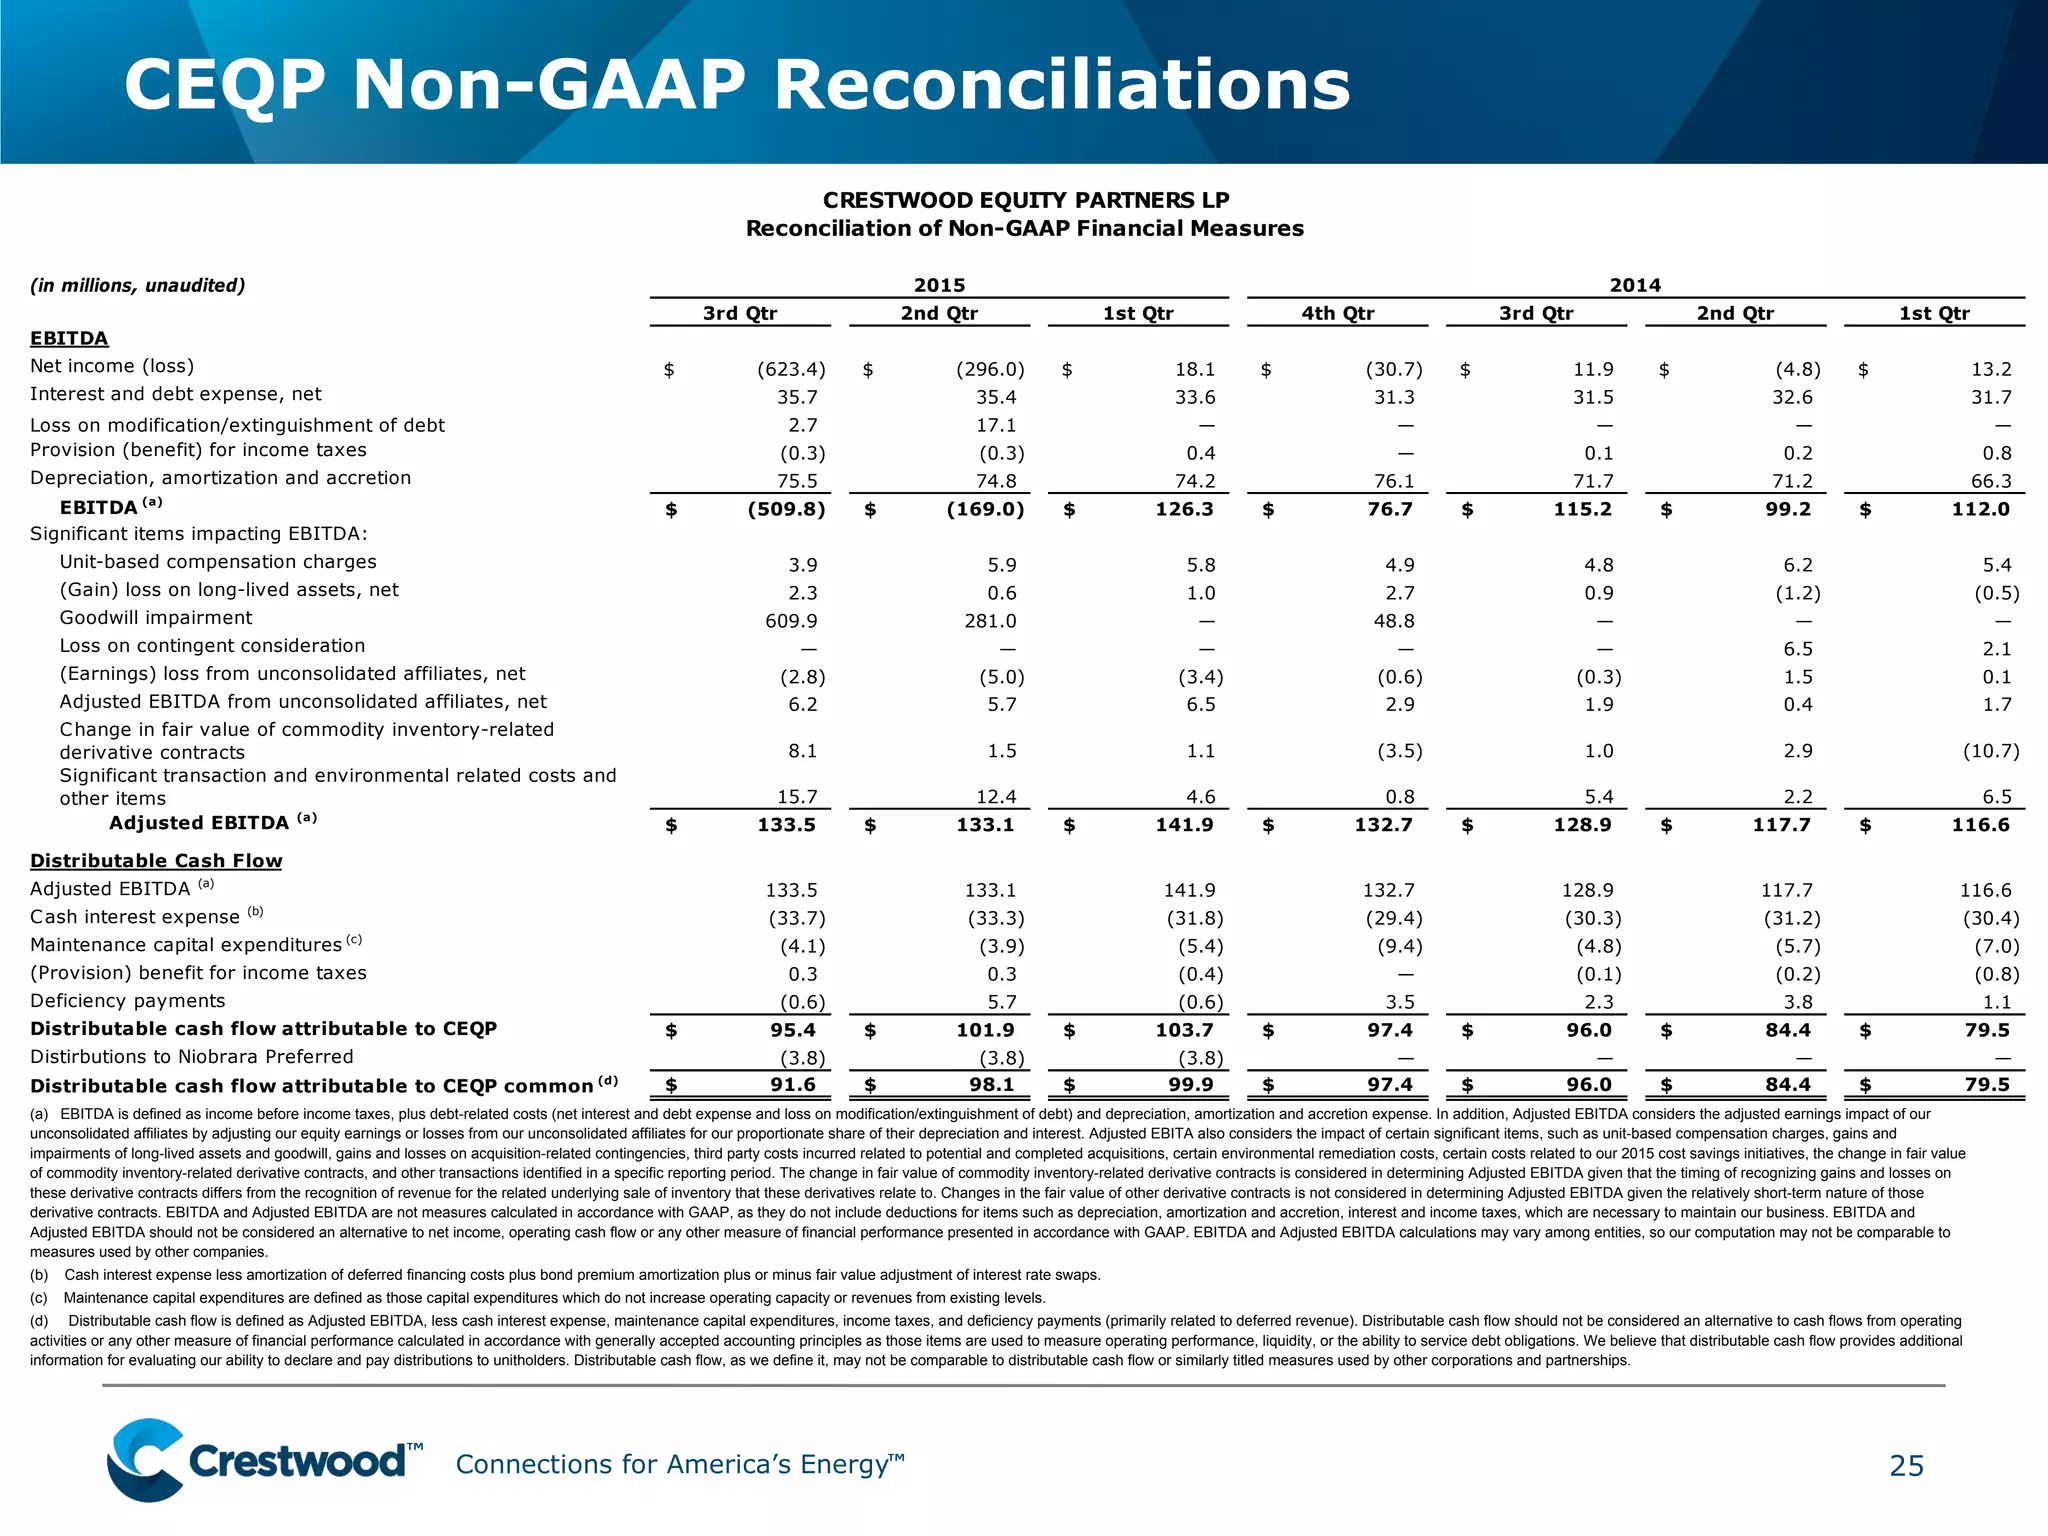
This document provides an overview of Crestwood Midstream Partners LP and Crestwood Equity Partners LP. It highlights their simplified structure following a merger, fixed-fee contract portfolio that provides revenue stability, cost reduction efforts, and core operations in strategic basins like the Marcellus and Bakken shale plays. The presentation outlines financial results, liquidity position, and growth opportunities while noting the companies' valuation disconnect compared to peers.