Download as PDF, PPTX


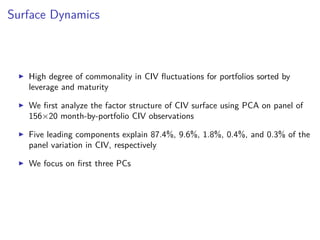
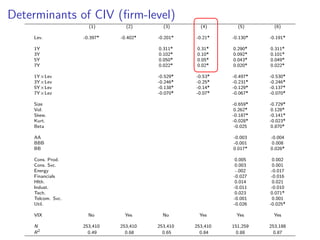
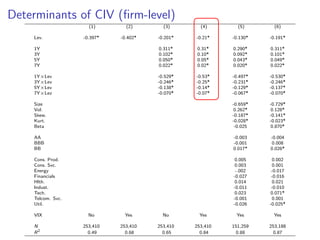
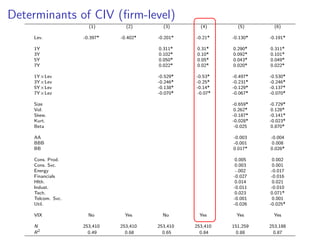
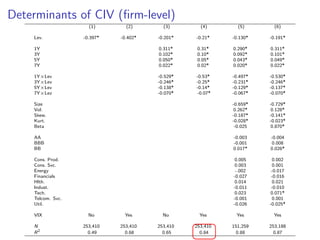
![Credit-Implied Volatility Smirk (Heterogeneity-Adjusted)
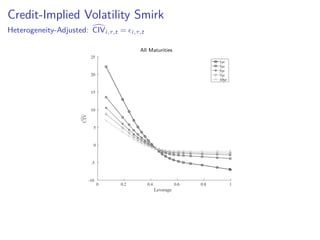
CIVi,τ,t = δ0,τ +δ1,τ [Size,Beta,Vol,Skew,Kurt]i,t
+ Rating FE+Sector FE+Month FE+ i,τ,t,
Regression run separately for each maturity, τ
Soak up all heterogeneity excluding leverage
Noting of course other measures correlated
Plot the residual—“Heterogeneity-adjusted” CIV
CIVi,τ,t = i,τ,t](https://image.slidesharecdn.com/manzo-civ-sofie-slides1-180503181539/85/Credit-Implied-Volatility-17-320.jpg)
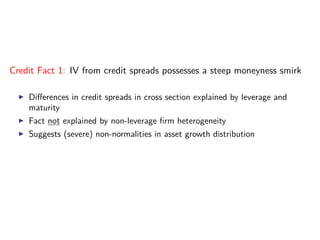
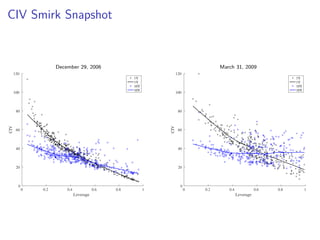
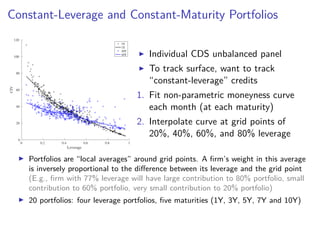


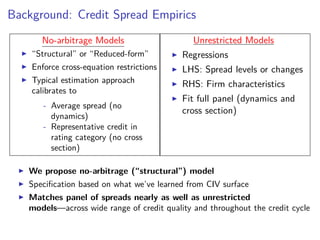
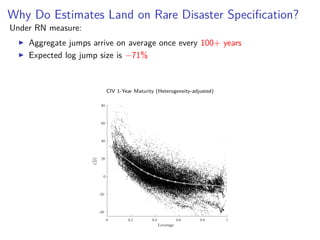
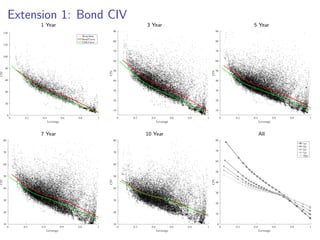

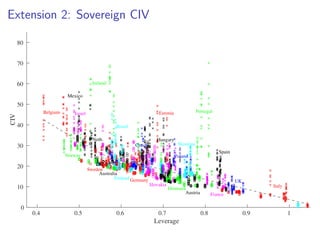
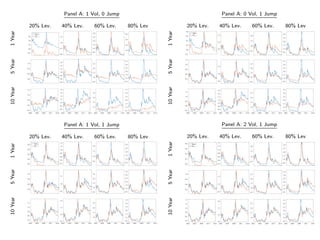

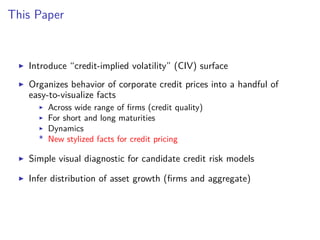
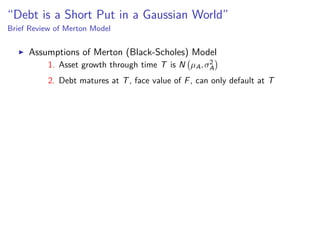
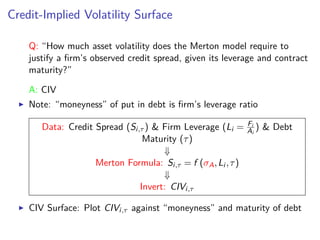
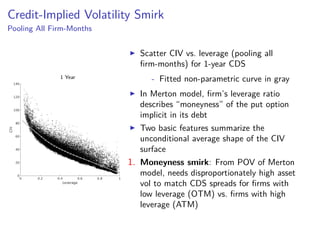
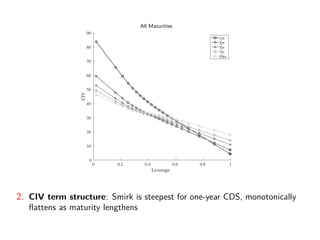
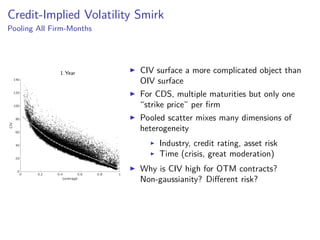
The paper introduces the concept of 'credit-implied volatility' (CIV) surface, which organizes corporate credit price behaviors into visual representations across different firms and maturities. It examines how CIV can be used to infer asset growth distributions and diagnose credit risk models, building on the Merton model framework. Key findings indicate that variations in credit spreads are largely explained by firm leverage, contract maturity, and common state variables.