Download to read offline
![International Research Journal of Engineering and Technology (IRJET) e-ISSN: 2395-0056
Volume: 09 Issue: 02 | Feb 2022 www.irjet.net p-ISSN: 2395-0072
© 2022, IRJET | Impact Factor value: 7.529 | ISO 9001:2008 Certified Journal | Page 583
2. Project Resource Requirements
2.1 So†ware Requirements
R software, and various R packages and libraries relating to ML
2.2 Hardware Requirements
Computer with 8GB+ RA
3. Literature Survey
3.1 Background
In this section, we have conducted a literature survey on various research papers dealing with prediction of fraudlent credit
card transactions. Accordingly, research papers [1-15] are reviewed and analyzed based on various approaches and
methodologies used.
3.2 Literature review
Authors Method Purpose Advantages Disadvantages
Patil, S., Nemade, V.,
& Soni, P. K. [1]
Proposed
interfacin g of
SAS with Hadoop
framewor
k. Used
Descision trees,
ROC
curves
To detect
credit card
fraudulent
transactions
Tuned analytical
server with
most optimal
model for fraud
detection
Limited to only
machine learning
approaches
Awoyemi, J. O.,
Adetunmbi, A. O., &
Oluwadare, S. A [2]
Used f naïve
bayes,
k-nearest
neighbor and
logistic
regression on
highly skewed
credit card
fraud data
Credit card
fraud detection
using machine
learning
techniques
naïve bayes, k-
nearest
neighbor get
accuracy as
high as 97.92%
and 97.69%
Logistic regression
has anaccuracy of
54.86%
Roy, A., Sun, J.,
Mahoney, R., Alonzi, L.,
Adams, S., & Beling, P [3]
Used ANN
powered
by cloud
computing and
fine tunes
various
parameters for
better
results
Deep learning
detecting fraud in
credit card
transactions
utilized a high
performance,
distributed cloud
computing
environment to
navigate
past common
fraud
detection
problems such as
class
imbalance and
scalability
Comparable results
to
machine learning
approaches
Xuan, S., Liu, G.,
Li, Z., Zheng, L., Wang, S.,
& Jiang, C. [4]
Random
forest for
credit card
fraud
To detect
credit card
fraudulent
Used two kinds of
random
forests are used
Only tested on
datasets
pertaining to](https://image.slidesharecdn.com/irjet-v9i298-220913094208-792f8403/75/CREDIT-CARD-FRAUD-DETECTION-IN-R-2-2048.jpg)
![International Research Journal of Engineering and Technology (IRJET) e-ISSN: 2395-0056
Volume: 09 Issue: 02 | Feb 2022 www.irjet.net p-ISSN: 2395-0072
© 2022, IRJET | Impact Factor value: 7.529 | ISO 9001:2008 Certified Journal | Page 584
detection transactions
using Random
Forest
to train the
behavior features
of
normal and
abnormal
transactions
china
Jurgovsky, J., Granitzer,
M., Ziegler, K., Calabretto,
S., Portier, P. E., He-
Guelton, L., &
Caelen, O. [5]
Authors have
made a
comparison
between Random
Forest (RF)
and Long
Short-Term
Memory (LSTM)
To study and
compare LSTM
and
Random Forest
on
CCFD
problem
Concludes to
use a
combination of two
Concluded their
study with a
discussion on both
practical
and scientific
challenges that
remain unsolved
Elgendy, N., &
Elragal, A. [6]
Used Big Data
Analytics for
CCFD
To detect
credit card
fraud using
Big Data
Analytics
Addressed the
variousBig Data
Methods, tools and
technologies that
can be
applied,
Complex prediction
model
Gamon, M. [7] Used SVM with
large
feature vectors
in
combination
with feature
reduction
To study
Sentiment
classification on
customer
feedback data
and deal with
noisy data
Achieved high
accuracy n data
that present
classification
challenges even for
a human
annotator i.e.
Supervised
Learning.
Complex prediction
model
Leppäaho, E.,
Ammad-ud-din, M., &
Kaski, S.[8]
Using GFA
package in R for
CCFD
GFA:
explorato ry
analysis of
multiple data
In-depth analysis
of GFA Package
which provides a
full pipeline for
factor analysis
Does not explain
GFAs applications to
real life scenarios
sources with
group factor
analysis
of multiple data
sources that are
represented as
matrices with
cooccurring
samples
Andrienko, G.,
Andrienko, N., Drucker,
S., Fekete, J.
D., Fisher, D., Idreos,
S., ... & Stonebraker, M
[9]
Studies various
related concept s
-
nformat ion
Visualiz ation,
Human- Comput
er Interacti on,
Machin e Learnin
g, Data manage
ment & Mining,
and Comput er
Graphic
To study Future
Research
Challenges and
Emerging
Applications in
Big Data
Visualization and
Analytics
The report has
been drafted by
the contributions
of fourteen
distinguished
scientists from
academia and
industry, and
diverse related
communities
Complex to
understand](https://image.slidesharecdn.com/irjet-v9i298-220913094208-792f8403/75/CREDIT-CARD-FRAUD-DETECTION-IN-R-3-2048.jpg)
![International Research Journal of Engineering and Technology (IRJET) e-ISSN: 2395-0056
Volume: 09 Issue: 02 | Feb 2022 www.irjet.net p-ISSN: 2395-0072
© 2022, IRJET | Impact Factor value: 7.529 | ISO 9001:2008 Certified Journal | Page 585
Kamaruddin, S.,
& Ravi, V [10]
Used
hybrid
architecture of
Particle
Swarm
Optimizati on
and
Auto- Associative
Neural Network
for one-
class
To study
Credit card fraud
detection using
big data
analytic
Introduced
parallelization of
the auto-
associative neural
network in the
hybrid
architecture to
achieve speed
up
Complex prediction
model
classificati on in
Spark
computatio nal
framework
Maniraj, S & Saini, Aditya
& Ahmed, Shadab &
Sarkar, Swarna [11]
Used deployment
of multiple
anomaly
detection
algorithms such
as
Local Outlier
Factor and
Isolation Forest
algorithm
To study
Credit card fraud
detection using
Machine
Learning and
Data
Science
Minimized
incorrect fraud
detection or false
positives
Accuracy
comaprable to
exsiting models
Varmedja, Dejan &
Karanovic, Mirjana &
Sladojevic, Srdjan &
Arsenovic, Marko &
Anderla, Andras [12]
Used SMOTE
technique was
used for
oversampli ng.
Used
Logistic
Regression,
Random Forest,
Naive Bayes
and
Multilayer
Perceptron
Applies various -
Machine
Learning
methods for
Credit Card
Fraud Detection
Results show
that each
algorithm
can be used for
credit
card fraud
detection with
high
accuracy
Proposed
model can be used
for
detection of
other irregularities.
Maniraj, S & Saini, Aditya
& Ahmed, Shadab &
Sarkar, Swarna. [13]
Used deployment
of multiple
anomaly
detection
algorithms such
as
Local
Outlier Factor
and
To study
Credit card fraud
detection using
Machine
Learning
techniques
Minimized
incorrect fraud
detection or false
positives
Accuracy
comaprable to
exsiting models](https://image.slidesharecdn.com/irjet-v9i298-220913094208-792f8403/75/CREDIT-CARD-FRAUD-DETECTION-IN-R-4-2048.jpg)
![International Research Journal of Engineering and Technology (IRJET) e-ISSN: 2395-0056
Volume: 09 Issue: 02 | Feb 2022 www.irjet.net p-ISSN: 2395-0072
© 2022, IRJET | Impact Factor value: 7.529 | ISO 9001:2008 Certified Journal | Page 586
Isolation Forest
algorithm
Andrea Dal
Pozzolo; Giacomo
Boracchi; Olivier Caelen;
Cesare Alippi; Gianluca
Bontempi. [14]
Designed and
assessed a
novel learning
strategy that
effectively
addresses class
imbalance,
concept drift,
and
verification
latency
Proposed, a
formalization of
the fraud-
detection
problem that
realistically
describes the
operating
conditions of
Fraud
tested their
research on more
than 75 million
transactions and
demonstrated the
impact of class
unbalance
and concept
Used complicated
for prediction and
dealing with class
imbalance
Detections drift in a real-
world data
stream
F. Carcillo, Y.A. Le
Borgne, O.Caelen, Y.
Kessaci, F. Oblé,
G. Bontempi[15]
Used combinatio
n of
various
supervised and
unsupervis ed
methods for
credit card
fraud
detection
To propose a
hybrid technique
that combines
supervised and
unsupervised
techniques to
improve the
Experimental
results show
that the
combination is
efficient and does
indeed improve the
accuracy of the
detection.
Complex prediction
model
fraud
detection
accuracy
3.3 Summary
Through our extensive study we found that credit card fraud detection data are highly imbalanced. Before conducting any
kind of prediction on it the imbalanceneed to be dealt with. A lot of machine learning as well as deep learning models gives
similar results if not better.
4. Proposed Methodology
4.1 Proposed Architecture
We propose to make a Credit Card Fraud Detection System in R language by making use of Machine Learning and advanced
R concepts. We would be incorporating various algorithms like Decision Tress, Artificial Neural Networks, Logistic
Regression and Gradient Boosting Classifier. In order to carry out the task of credit card fraud detection, we will be making
use of a Credit Card Transactions dataset consisting of a mix of fraud as well as non-fraudulent transactions.
4.2 Method Used
We have referred various research papers to identify the various components that might be required in our project. We also
referred few websites to understand the various packages and libraries in R that are to be used.](https://image.slidesharecdn.com/irjet-v9i298-220913094208-792f8403/75/CREDIT-CARD-FRAUD-DETECTION-IN-R-5-2048.jpg)
![International Research Journal of Engineering and Technology (IRJET) e-ISSN: 2395-0056
Volume: 09 Issue: 02 | Feb 2022 www.irjet.net p-ISSN: 2395-0072
© 2022, IRJET | Impact Factor value: 7.529 | ISO 9001:2008 Certified Journal | Page 588
23 18 1.166616382 5.021201e-01 -0.067300314 2.2615692395 4.288042e-01 8.947352e-02
24 18 0.247491128 2.776656e-01 1.185470842 -0.0926025499 -1.314394e+00 -1.501160e-01
25 22 -1.946525131 -4.490051e-02 -0.405570068 -1.0130573370 2.941968e+00 2.955053e+00
26 22 -2.074294672 -1.214818e-01 1.322020630 0.4100075142 2.951975e-01 -9.595372e-01
27 23 1.173284610 3.534979e-01 0.283905065 1.1335633179 -1.725772e-01 -9.160537e01
28 23 1.322707269 -1.740408e-01 0.434555031 0.5760376524 -8.367580e-01 -8.310834e-01
29 23 -0.414288810 9.054373e-01 1.727452944 1.4734712666 7.442741e-03 -2.003307e-01
30 23 1.059387115 -1.753192e-01 1.266129643 1.1861099547 -7.860018e-01 5.784353e-01
31 24 1.237429030 6.104258e-02 0.380525880 0.7615641114 -3.597707e-01 -4.940841e-01
32 25 1.114008595 8.554609e-02 0.493702487 1.3357599851 -3.001886e-01 -1.075378e-02
33 26 -0.529912284 8.738916e-01 1.347247329 0.1454566766 4.142089e-011.002231e-01
34 26 -0.529912284 8.738916e-01 1.347247329 0.1454566766 4.142089e-011.002231e-01
35 26 -0.535387763 8.652678e-01 1.351076288 0.1475754745 4.336802e-018.698294e-02
36 26 -0.535387763 8.652678e-01 1.351076288 0.1475754745 4.336802e-018.698294e-02
37 27 -0.246045949 4.732669e-01 1.695737554 0.2624114880 -1.086641e-02-6.108359e-01
38 27 -1.452187279 1.765124e+00 0.611668541 1.1768249842 -4.459799e-012.468265e-01
……………..and so on
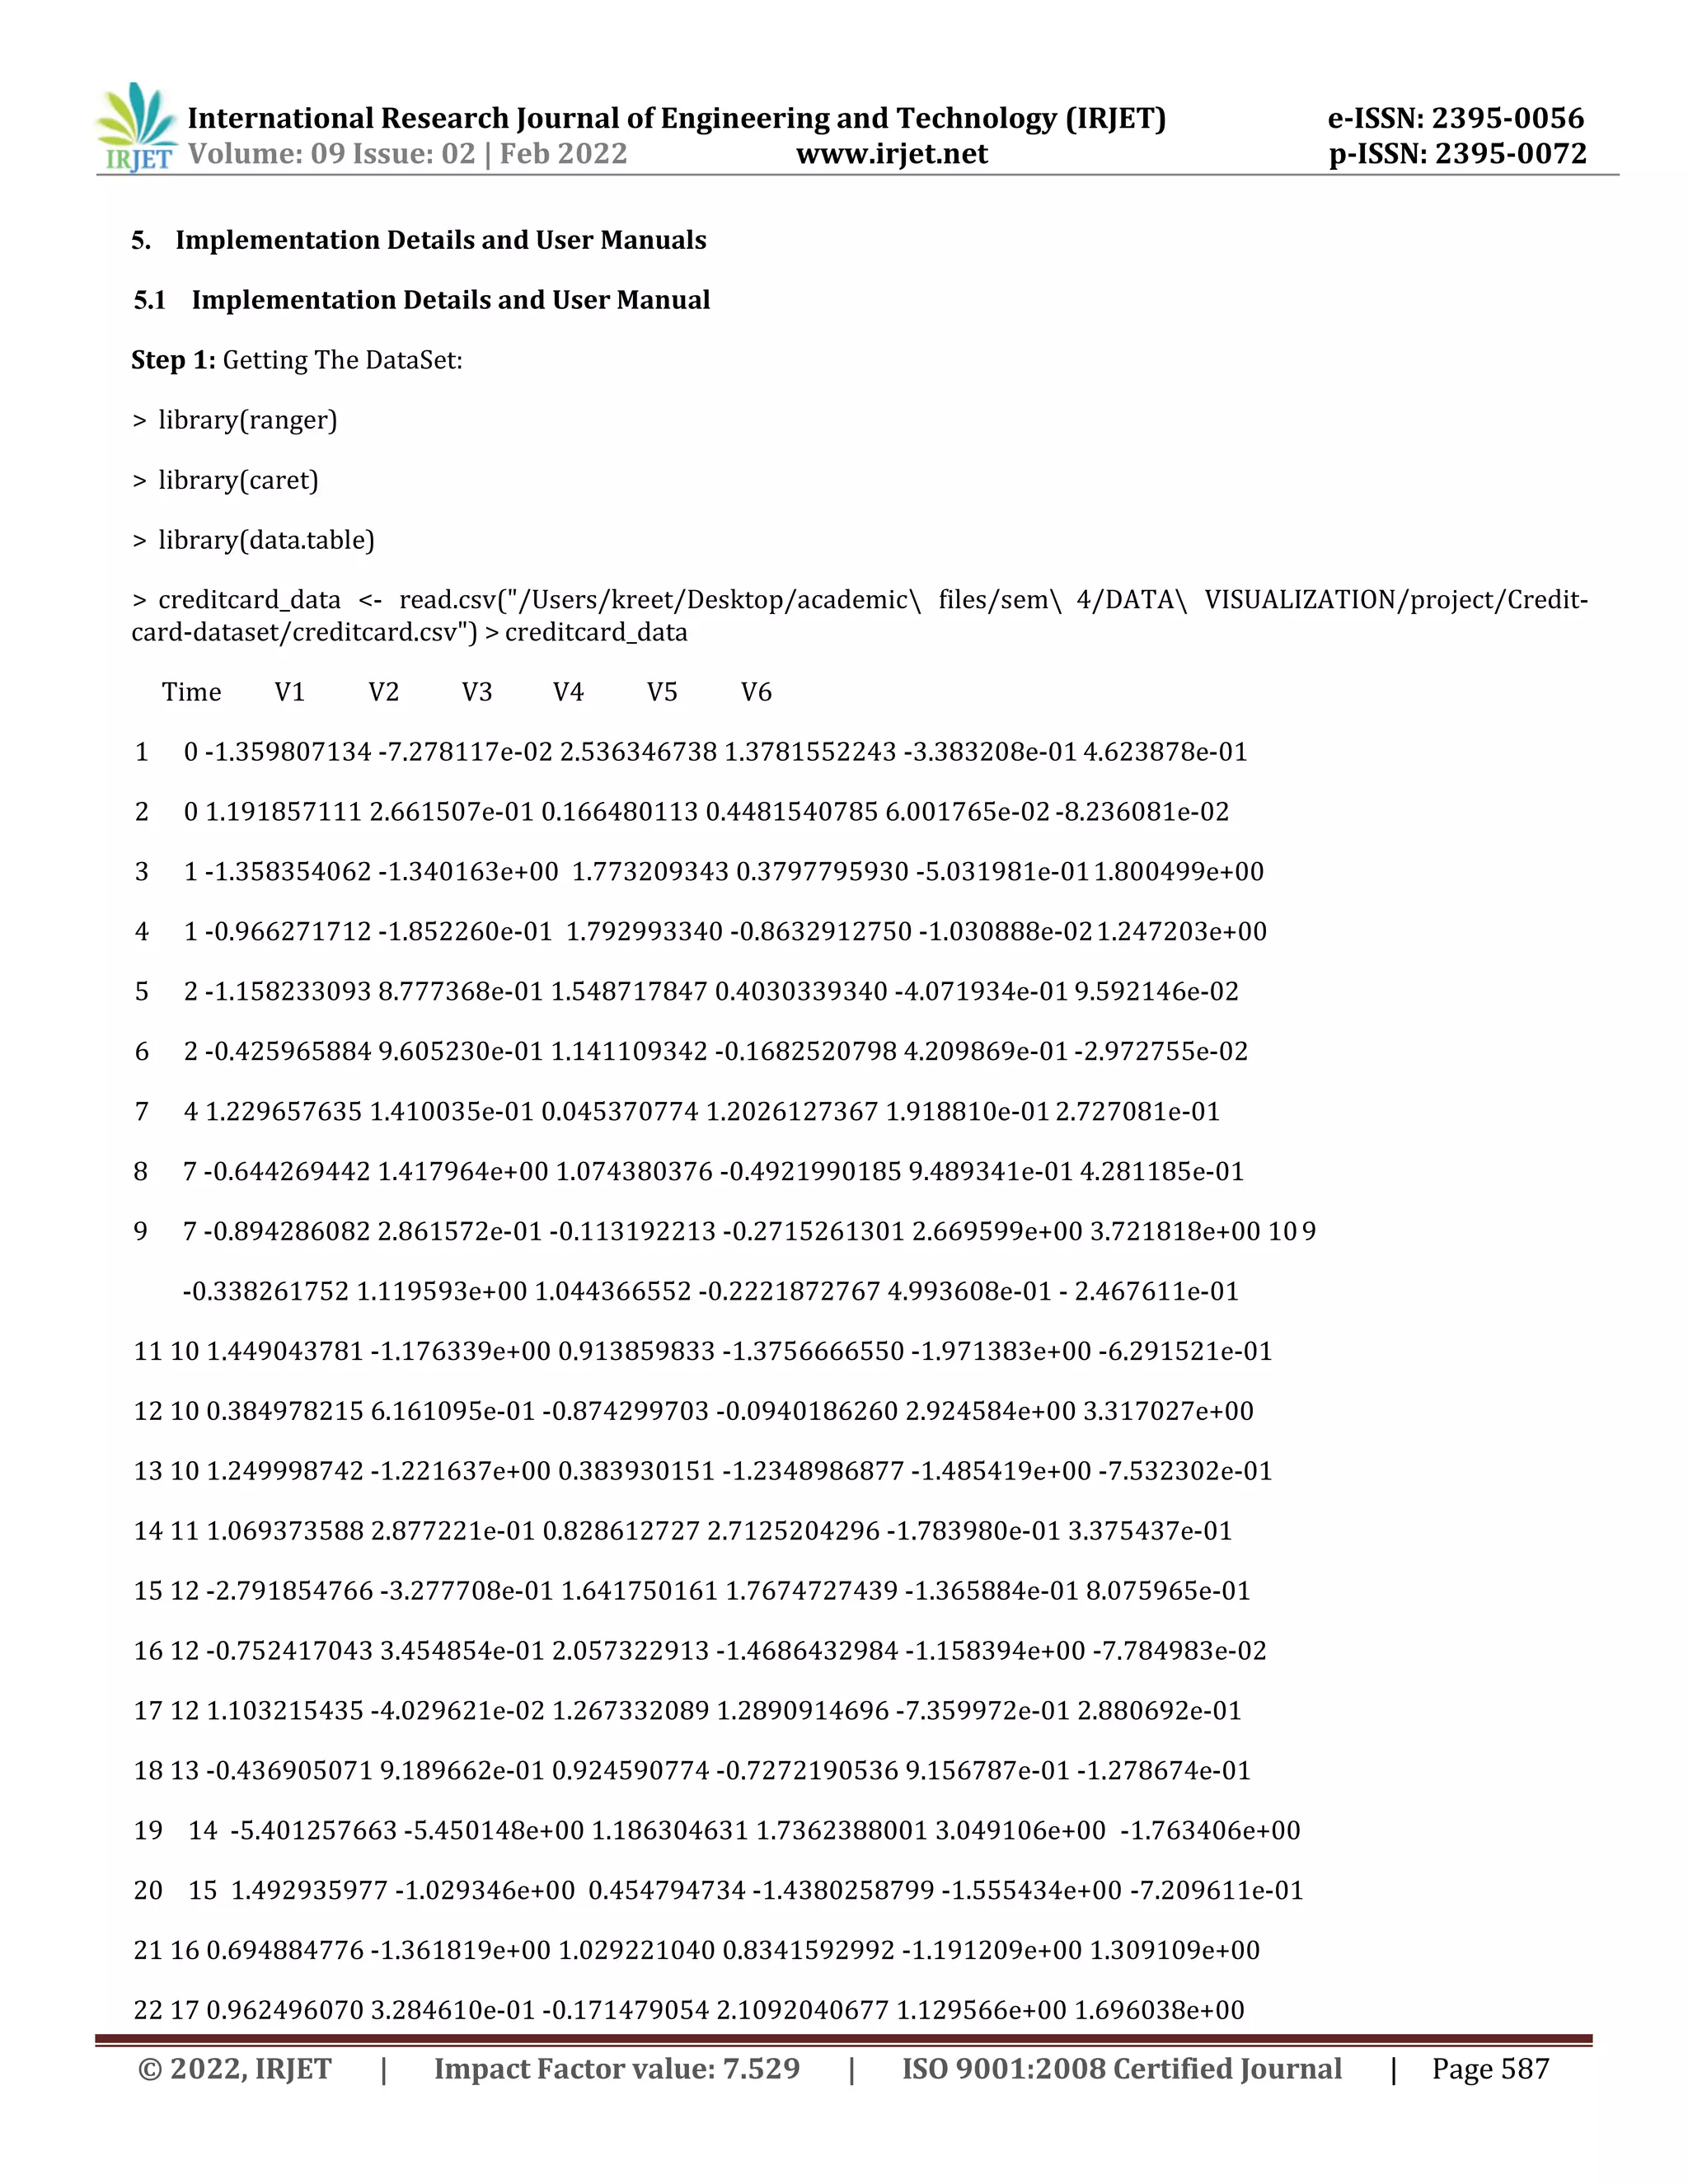
Step 2: understanding the structure of the Dataset
> dim(creditcard_data) Gives us the dimension of the dataset [1] 284807 31
> head(creditcard_data,6) Gives the first 6 data entries in the dataset > tail(creditcard_data,6) Gives the last 6 entries in the
dataset.
> summary(creditcard_data$Amount) This gives us the summary of the dataset Statistically. > names(creditcard_data) This
command will tell us about the names of the columns in the dataset
> var(creditcard_data$Amount) It gives the variance of the amount column
> sd(creditcard_data$Amount) It gives us the standard deviation in the amount column Step 3: We will be
scaling our data by using the scale() function in R, in order to remove any extreme values which might hinder in the
functioning of our model. The scaling function helps standardize the data, by structuring them according to a specific range.
> creditcard_data$Amount=scale(creditcard_data$Amount) This will scale our dataset. > NewData=creditcard_data[,-c(1)]
> head(NewData) This is used in order to recheck our model after scaling](https://image.slidesharecdn.com/irjet-v9i298-220913094208-792f8403/75/CREDIT-CARD-FRAUD-DETECTION-IN-R-7-2048.jpg)
![International Research Journal of Engineering and Technology (IRJET) e-ISSN: 2395-0056
Volume: 09 Issue: 02 | Feb 2022 www.irjet.net p-ISSN: 2395-0072
© 2022, IRJET | Impact Factor value: 7.529 | ISO 9001:2008 Certified Journal | Page 589
Step 4: Now, after we have scaled our data, it is ready for training. So, now we will be extracting two sets of data from the
existing data, one will be train_data, and the other will be test_data. > library(caTools)
> set.seed(123) It generates random numbers
> data_sample = sample.split(NewData$Class,SplitRatio=0.80) This function is used in order to split the dataset into two
datasets in the ratio 0.8: 0.2
> train_data = subset(NewData,data_sample==TRUE) This is used to transfer all the elements in data_sample which have a
value of data_sample = true.
> test_data = subset(NewData,data_sample==FALSE) This is used to transfer all the elements in data_sample which have a
value of data_sample = false.
> dim(train_data) It is used to check the dimensions of the trainingdata. [1] 227846 30
> dim(test_data) It is used to heck the dimensions of the test dataset[1] 56961 30
Step 5: In this step, we will be performing Logical regression. The Logistic Regression determines the extent to which there
is a linear relationship between a dependent variable and one or more independent variables. In terms of output, linear
regression will give us a trend line plotted amongst a set of data points. So, in our project, we have used it determine the
relationship between fraud or not fraud.
> Logistic_Model=glm(Class~.,test_data,family=binomial()) It is used to generate aBinomial Linear Regression Model.
> summary(Logistic_Model)
> plot(Logistic_Model) To plot the Logistic_model values
(a)Predicted Values v/s Residuals (b)Theoretical Quantities v/s Std. Deviation Residuals](https://image.slidesharecdn.com/irjet-v9i298-220913094208-792f8403/75/CREDIT-CARD-FRAUD-DETECTION-IN-R-8-2048.jpg)


![International Research Journal of Engineering and Technology (IRJET) e-ISSN: 2395-0056
Volume: 09 Issue: 02 | Feb 2022 www.irjet.net p-ISSN: 2395-0072
© 2022, IRJET | Impact Factor value: 7.529 | ISO 9001:2008 Certified Journal | Page 595
6.3 References
[1] Patil, S., Nemade, V., & Soni, P. K. (2018). Predictive modelling for credit card fraud detection using data analytics.
Procedia computer science, 132, 385-395.
[2] Awoyemi, J. O., Adetunmbi, A. O., & Oluwadare, S. A. (2017, October). Credit card fraud detection using machine
learning techniques: A comparative analysis. In 2017 International Conference on Computing Networking and Informatics
(ICCNI) (pp. 1-9). IEEE.
[3] Roy, A., Sun, J., Mahoney, R., Alonzi, L., Adams, S., & Beling, P. (2018, April).Deep learning detecting fraud in credit
card transactions. In 2018 Systems and Information Engineering Design Symposium (SIEDS) (pp. 129-134). IEEE.
[4] Xuan, S., Liu, G., Li, Z., Zheng, L., Wang, S., & Jiang, C. (2018, March).Random forest for credit card fraud detection. In
2018 IEEE 15th International Conference on Networking, Sensing and Control (ICNSC) (pp. 1-6). IEEE.
[5] Jurgovsky, J., Granitzer, M., Ziegler, K., Calabretto, S., Portier, P. E., He-Guelton, L., & Caelen, O. (2018). Sequence
classification for credit-card fraud detection. Expert Systems with Applications, 100, 234-245.
[6] Elgendy, N., & Elragal, A. (2014, July). Big data analytics: a literature review paper. In Industrial Conference on Data
Mining (pp. 214-227). Springer, Cham.
[7] Gamon, M. (2004, August). Sentiment classification on customer feedback data: noisy data, large feature vectors,
and the role of linguistic analysis. In Proceedings of the 20th international conference on Computational Linguistics (p.
841). Association forComputational Linguistics.
[8] Leppäaho, E., Ammad-ud-din, M., & Kaski, S. (2017). GFA: exploratory analysis of multiple data sources with group
factor analysis. The Journal of Machine Learning Research, 18(1), 12941298.
[9] Andrienko, G., Andrienko, N., Drucker, S., Fekete, J. D., Fisher, D., Idreos, S., ... & Stonebraker, M. Big Data
Visualization and Analytics: Future Research Challenges and Emerging Applications.
[10] Kamaruddin, S., & Ravi, V. (2016, August). Credit card fraud detection using big data analytics: use of PSOAANN
based one-class classification. In Proceedings of theInternational Conference on Informatics and Analytics (pp. 1-8).
[11] Maniraj, S & Saini, Aditya & Ahmed, Shadab & Sarkar, Swarna. (2019). CreditCard Fraud Detection using Machine
Learning and Data Science. International Journal of Engineering Research and. 08. 10.17577/IJERTV8IS090031.
[12] Varmedja, Dejan & Karanovic, Mirjana & Sladojevic, Srdjan & Arsenovic, Marko & Anderla, Andras. (2019). Credit
Card Fraud Detection - Machine Learning methods. 1-5. 10.1109/INFOTEH.2019.8717766.
[13] Maniraj, S & Saini, Aditya & Ahmed, Shadab & Sarkar, Swarna. (2019). Credit Card Fraud Detection using Machine
Learning and Data Science. International Journal of Engineering Research and. 08. 10.17577/IJERTV8IS090031
[14] Varmedja, Dejan & Karanovic, Mirjana & Sladojevic, Srdjan & Arsenovic, Marko & Anderla, Andras. (2019). Credit
Card Fraud Detection - Machine Learning methods. 1-5. 10.1109/INFOTEH.2019.8717766.
[15] F. Carcillo, Y.A. Le Borgne, O. Caelen, Y. Kessaci, F. Oblé, G. Bontempi Combining unsupervised and supervised
learning in credit card fraud detection Inf. Sci. (Ny). (2019), 10.1016/j.ins.2019.05.042](https://image.slidesharecdn.com/irjet-v9i298-220913094208-792f8403/75/CREDIT-CARD-FRAUD-DETECTION-IN-R-14-2048.jpg)

The document summarizes a proposed methodology for credit card fraud detection in R. Key points: 1. The methodology aims to use machine learning algorithms like decision trees, artificial neural networks, logistic regression, and gradient boosting classifier on a credit card transactions dataset to detect fraudulent transactions. 2. Implementation details include getting the dataset, preprocessing it, and applying various models to classify transactions as fraudulent or not. 3. A user manual is proposed to explain how to implement the methodology step-by-step in R.