Downloaded 48 times

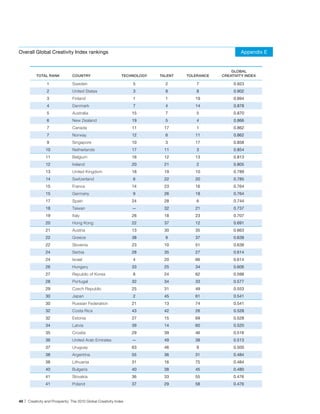
![InTroduCTIon to social inclusion, public health, and sustainable transporta-
tion—providing a more robust gauge of economic and social
progress. As our economy begins its slow recovery from its
gravest crisis in generations, it’s essential that we seek not just
to hasten the return of short term growth but to lay the founda-
tions for sustainable, long-term prosperity.
Our research takes up this effort to broaden both our under-
standing and our measures of economic and social well-being.
The first part of this report presents our rankings of 82 nations
on the GCI, which takes three main classes of economic inputs
The economic crisis has challenged popular
into account: Technology, Talent and Tolerance (described in
conceptions of economic growth. Fueled by
greater detail below). We also examine the relationship of these
overly risky financial speculation and outright
three classes of factors and the overall index to a series of mea-
chicanery at times, the pursuit of short-term
sures of economic and social progress, ranging from conven-
profits led some of the world’s most advanced
tional measures of economic growth and competitiveness to
and affluent economies to the brink of collapse
broader measures of economic equality, human development,
and to the prospect of years, possibly decades,
and subjective well-being. Our methodology, data sources, and
of intractable unemployment and stagnation.
variables are laid out in detail in the appendix to this report.
We learned the proverbial hard way that the
unbridled pursuit of economic growth does
not always go hand in hand with rising living
standards. While engendering growth and bol-
stering competitiveness remain on the agenda,
attention has shifted to creating jobs, lifting
wages, addressing inequality and fostering
long-run, sustainable prosperity.
This latest edition of the Global Creativity
Index (GCI) addresses these challenges head-
on, helping to shift the dialogue from a nar-
row focus on competitiveness and growth to
a broader focus on creativity, prosperity and
well-being. Our research is part of a broader
challenge to the way we understand economic
growth and development. Over the past decade
or so, a growing number of students of econo-
mic progress have concluded that we need to
improve the frameworks, language and metrics
that we use to gauge society’s overall wealth,
and that we need better measurements of hu-
man development, well-being, and happiness.
One notable high-level effort was under-
taken by French President Nicolas Sarkozy’s
blue-ribbon Commission on the Measurement
of Economic Performance and Social Progress.
Chaired by the Nobel Prize winning econo-
mists Joseph E. Stiglitz and Amartya Sen, the
commission’s report challenged conventional
measures of economic growth and develop-
ment [1]. “What you measure affects what you
do,” noted Stiglitz at the release of the commis-
sion’s report. ”If we have the wrong metrics,
we will strive for the wrong things.” [1] The
commission proposed a range of additional
measures of social and economic well-being—
from socioeconomic development, sustainable
consumption, production, and development,
www.martinprosperity.org | 1](https://image.slidesharecdn.com/creativityglobalindexreportmartininst-sep2011-111005030700-phpapp01/85/Creativity-global-index-report-martin-inst-sep-2011-9-320.jpg)
![CreATIvITy And The Technology
3 Ts oF eConoMIC Long recognized as a key driver of wealth and progress,
technology is the first essential factor. Karl Marx and later
develoPMenT Joseph Schumpeter recognized that advances in technology
are what enable capitalism to constantly revolutionize itself [4,
9]. “Capitalism not only never is but never can be stationary,”
Schumpeter wrote in 1942, as the Great Depression transi-
tioned into a full-blown war economy [9]. In the late 1950s,
Robert Solow devised a mathematical formula to capture
technology’s role as a driving force in economic growth,
for which he received the Nobel Prize in economics [10].
Following Adam Smith, classical economists Talent
identified three key factors of production as
Talent is the second key factor. Starting in the 1960s, Peter
the foundations of economic development:
Drucker and Fritz Malchup detailed the economic importance
land, labor, and capital [2–4]. But physical
of knowledge [11, 12]. Knowledge workers not only invent new
factors alone no longer determine progress in
machines that turn out old products more efficiently—they
today’s modern, advanced economies, where
come up with completely new products that create whole new
factors like technology, innovation, knowl-
markets. Paul Romer’s theory of endogenous growth, with its
edge, and human capital play much greater
corollary that investment in R&D and education yield tangible
roles. Underpinning all of them is the role of
returns over the long term, formalized this phenomenon [13].
creativity. Economic growth and development
The generation of new knowledge thus becomes the key driver
turns on harnessing human creativity across
of economic growth. While knowledge is something that can be
the entire spectrum of innovation through
codified, creativity and the creation of new ideas, knowledge,
production—from the creation of new tech-
and technologies comes from people. Economists agree that
nologies and new firms to new and improved
skilled, ambitious, and entrepreneurial people—who they refer
processes, more efficient manufacturing and
to as “human capital”—are a central force in economic progress
production systems, and increasing effective-
today [14–16].
ness in the delivery of services.
Creativity differs in a fundamental way
from more traditional, tangible factors of
Tolerance
production like land or raw materials: it is Tolerance is the third factor in the ranking of economic prog-
not a stock of things that can be depleted or ress. While most economists tend to see technology and talent
worn out, but an infinitely renewable resource as stocks of endowments, the reality is that they are flows. The
that can be constantly improved. Everyone is ability to identify the economic and non-economic factors that
potentially creative. Our future progress and account for these flows is essential to an understanding of eco-
prosperity depends not just on the efforts of a nomic progress. People are not forever-wedded to one place;
privileged knowledge elite but on how well we they can and do move around. The technology and talent that
can unleash the creativity of each and every they bring with them are mobile factors, and accordingly flow
human being. into and out of cities and regions and nations.
Creativity is mobile and portable—people
can and do move. But, it is almost always as- New ideas are generated most efficiently in places where dif-
sociated with specific places, as Jane Jacobs ferent cognitive styles are tolerated—and different cognitive
has shown [5, 6]. Places—countries, cities, styles are linked to demographic diversity, as economist Scott
regions—bring together the key inputs from Page has shown [17]. Openness to diversity is also in line with
diverse groups of people to the firms and the broad cultural shift from materialist values about money
institutions that shape economic and social and things to newer “post-materialist” values, which favor self-
progress. For these reasons, place has come expression and a wider quest for happiness and well-being,
to replace the corporation as the key economic as identified by Ronald Inglehart [18–20]. Tolerance—open-
and social organizing unit of our time. ness to diversity—provides an additional source of economic
The GCI offers a new, more unified way advantage which works alongside technology and talent. The
to assess the key inputs that drive long-term places that are most open to new ideas and that attract talented
economic prosperity based on what we have and creative people from across the globe broaden both their
elsewhere dubbed the “3 Ts of economic devel- technology and talent capabilities, thereby gaining a substantial
opment,” Technology, Talent and Tolerance economic edge.
[7, 8].
www.martinprosperity.org | 3](https://image.slidesharecdn.com/creativityglobalindexreportmartininst-sep2011-111005030700-phpapp01/85/Creativity-global-index-report-martin-inst-sep-2011-11-320.jpg)
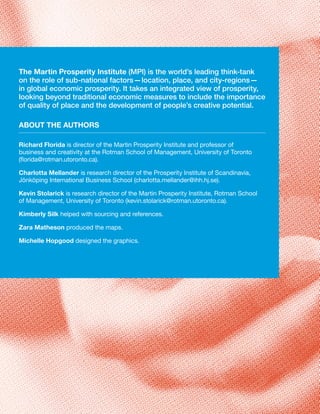
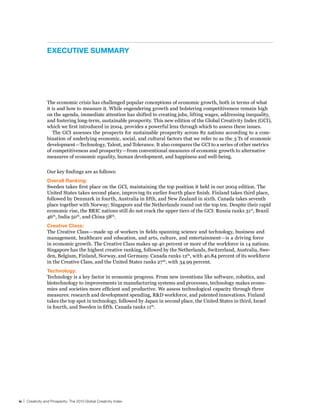
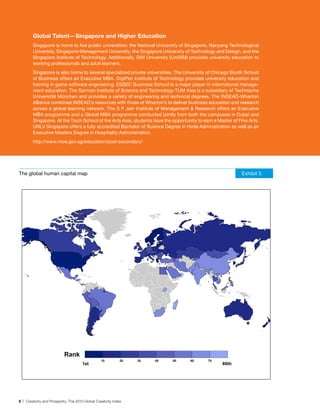
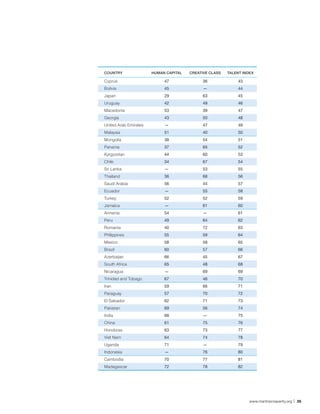
![Start-up Nation: The Story of Israel’s Eco- The GlobAl TAlenT MAPs
nomic Miracle shows how Israel has pursued
a technology strategy based on launching new We turn now to the second T, talent. There is a broad consensus
innovative firms [21]. that a country’s ability to generate, attract, and retain skilled
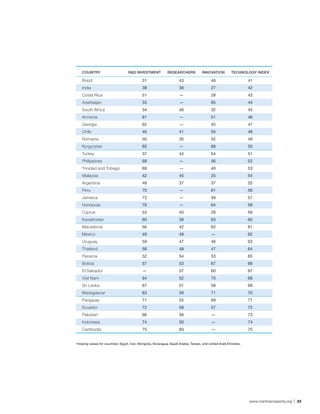
Sweden takes fifth place and Switzerland, people will be a key factor in its future economic success.
Denmark, Korea, Germany and Singapore We measure talent as a combination of two factors. The
round out the top ten. Canada ranks 11th. first is the conventional measure of human capital based on
While much has been made of the ascen- educational attainment. The second is a measure of the Creative
dance of the BRIC countries—Brazil, Russia, Class, which includes workers in fields such as technology,
and especially India and China—generally, science, and engineering; business, management, and finance;
they do not rank highly on our technology design and architecture; arts, culture, entertainment, and
measure. The highest ranking BRIC nation media; law, healthcare, and education.
is Russia, in the 28th spot. China ranks 37 th, We begin by looking at how nations stack up on the first of
about the same as Latvia and Bulgaria. Brazil our talent measures, global human capital (exhibit 5), which
takes 48th place and India 49th, just behind charts the level of educational attainment. Human capital is
Serbia and Croatia. measured as the share of the population in the proper age group
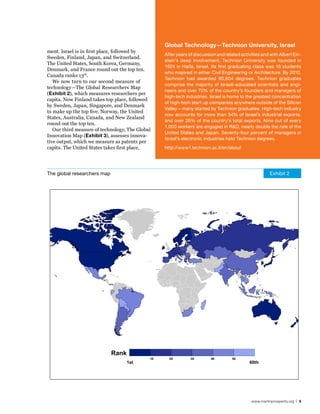
The global technology map Exhibit 4
Rank
10 20 30 40 50 60 70
1st 80th
www.martinprosperity.org | 7](https://image.slidesharecdn.com/creativityglobalindexreportmartininst-sep2011-111005030700-phpapp01/85/Creativity-global-index-report-martin-inst-sep-2011-15-320.jpg)
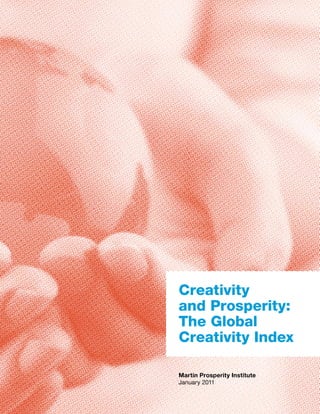
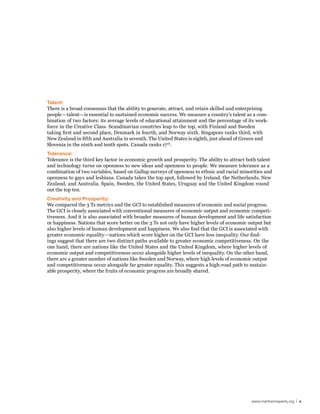
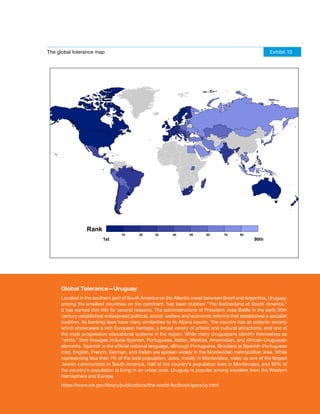
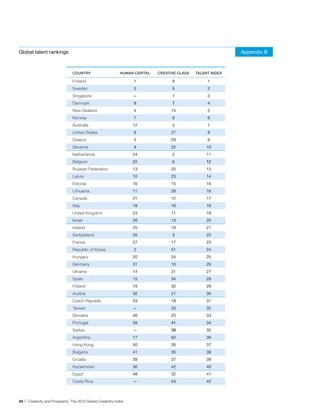
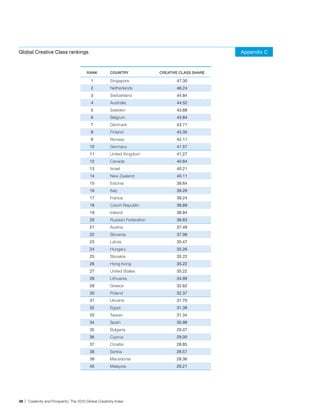
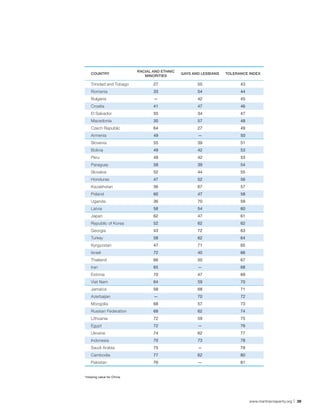
![percentage that answers that the city or area Sweden, South Africa, and Singapore (81 percent), United King-
where they live is a good place for gay and dom (79 percent), and Uruguay and Hong Kong (77 percent).
lesbian people to live. Previous research has We now turn to the global openness to gays and lesbians map
shown that openness to gays and lesbians is (exhibit 9). The Netherlands takes the top spot, with 83 percent
associated with higher levels of both regional of residents surveyed reporting their location is a good place for
and national economic performance [22, 23]. gay and lesbian people. Canada is second (77 percent), followed
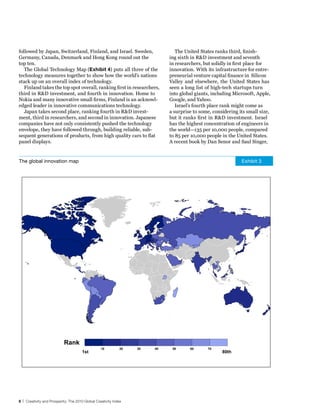
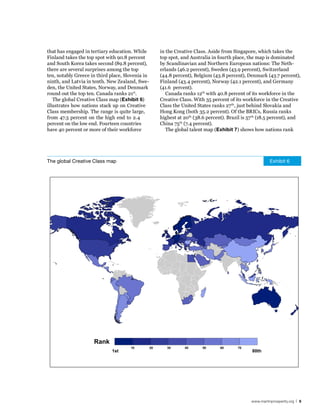
We begin with the global racial and by Spain (75 percent). Ireland and Uruguay are next (both with
ethnic openness map (exhibit 8), which 70 percent). Belgium (67 percent), Australia and Sweden (66
charts national rankings on openness to percent), Denmark (65 percent), and the United Kingdom (63
racial and ethnic minorities. Canada takes percent) round out the top ten. The United States
first place, with 91 percent of its residents is found in 12th place.
surveyed reporting that their location is The global tolerance map (exhibit 10) plots how nations
open to racial and ethnic minorities. New stack up on our overall Tolerance Index. Canada takes the top
Zealand takes second spot with 87 percent, spot. Ireland ranks second. The Netherlands ranks third: it is
followed by Ireland (85 percent), Australia the only country among the top five that is more open to gay
(84 percent), the United States (83 percent), and lesbian people (83%) than to racial and ethnic minorities
The global racial and ethnic openness map Exhibit 8
Rank
10 20 30 40 50 60 70
1st 80th
www.martinprosperity.org | 11](https://image.slidesharecdn.com/creativityglobalindexreportmartininst-sep2011-111005030700-phpapp01/85/Creativity-global-index-report-martin-inst-sep-2011-19-320.jpg)
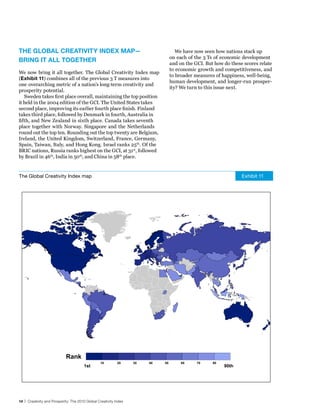
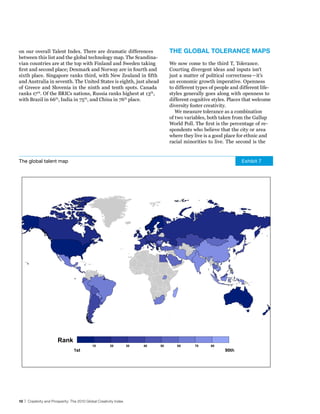
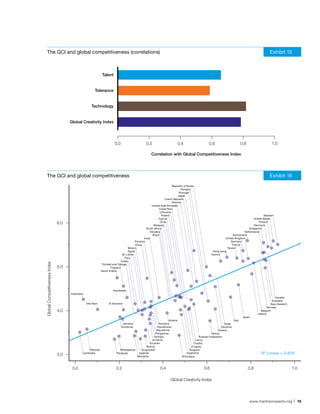
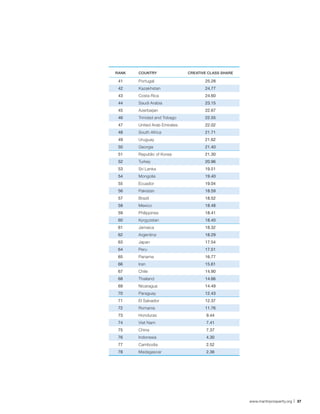
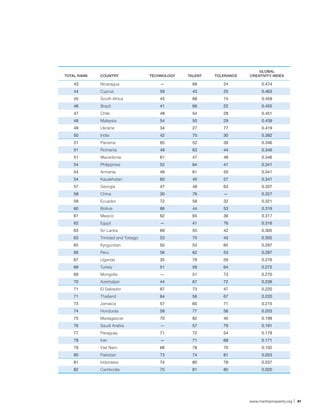
![New Zealand have levels of gross domestic product per capita exhibit 15 shows the correlation between
which are slightly lower than their GCI scores would seem the Global Competitiveness Index and the
to warrant. Perhaps more significantly, very low GCI scores GCI, as well as each of our 3 T indices. The
appear to be associated with even lower levels of economic out- GCI is closely associated with the Global Com-
put per capita, as the cases of Nicaragua, Mongolia, Kyrgyzstan, petitiveness Index (with a correlation of 0.79).
Uganda, and Madagascar indicate. The correlations are also substantial for each
of the 3 Ts—led by Technology (0.82), then
Talent (0.66), and Tolerance (0.59).
The GCI And eConoMIC CoMPeTITIveness exhibit 16 shows the broad relationship
between the GCI and the Global Competitive-
We now turn to the relationship between the GCI and a well- ness Index. Though still fairly strong, the
established measure of global competitiveness—the Global relationship between the GCI and the Global
Competitiveness Index developed by Harvard professor Competiveness Index is not as pronounced as
Michael Porter for the World Economic Forum. The Global it is with gross domestic product per capita—
Competitiveness Index is a comprehensive measure of overall there is more “scatter” about the line. On the
competitiveness and included factors associated with economic one hand, the United States, Singapore, Swit-
output, innovation, efficiency, and business climate among zerland, the United Kingdom, Japan, Hong
others [24]. Kong, Germany, and Denmark all perform
The GCI and economic output Exhibit 14
Estonia
Lithuania Hong Kong
Uruguay Austria Denmark
Argentina Greece Norway
Cyprus Israel Singapore
11.0 Chile
Poland Portugal
Japan
Netherlands
Ireland
Slovakia Switzerland
Malaysia Germany
Brazil
South Africa
Macedonia
10.0 Kazakhstan
Panama
Romania
Trinidad and Tobago
Saudi Arabia
Mexico
9.0 Egypt
Peru
Turkey
Economic Output
Azerbaijan
Jamaica
Thailand
El Salvador
8.0 Iran
Sweden
United States
Finland
Canada
Paraguay Australia
New Zealand
Indonesia Belgium
7.0 United Kingdom
China France
Honduras Armenia Spain
Italy
Ukraine Slovenia
India Republic of Korea
Philippines Hungary
6.0 Viet Nam Georgia Serbia
Pakistan Ecuador Czech Republic
Cambodia Bolivia Latvia
Sri Lanka Russian Federation
Kyrgyzstan Croatia
Uganda Bulgaria
5.0 Mongolia Nicaragua R 2 Linear = 0.701
Madagascar
0.0 0.2 0.4 0.6 0.8 1.0
Global Creativity Index
Note: Economic Output measured as log of grossas log of gross domestic product per capita
Note: Economic Output measured domestic product per capita.
18 | Creativity and Prosperity: The 2010 Global Creativity Index](https://image.slidesharecdn.com/creativityglobalindexreportmartininst-sep2011-111005030700-phpapp01/85/Creativity-global-index-report-martin-inst-sep-2011-26-320.jpg)
![The GCI and entrepreneurship (correlations) Exhibit 17
Talent
Tolerance
Technology
Global Creativity Index
0.0 0.2 0.4 0.6 0.8 1.0
Correlation with Entrepreneurship
better in terms of competitiveness than their GCI scores would
lead one to expect. Canada performs just slightly better than its
GCI scores predict. China and India both perform significantly The Global
better on competitiveness than their GCI scores suggest they
entrepreneurship Monitor
should. On the other hand, New Zealand, Ireland and Spain
perform lower on competitiveness than their GCI scores would The Global Entrepreneurship Monitor (GEM) is
seem to predict. a not-for-profit academic research consortium
whose goal is making high quality information
on global entrepreneurial activity available to
The GCI And enTrePreneurshIP as wide an audience as possible. GEM is the
largest single study of entrepreneurial activity
Joseph Schumpeter long ago showed how innovation and in the world. Started as a partnership between
entrepreneurship come together to set in motion the “creative London Business School and Babson Col-
destruction” that drives economies forward. Some 20 per- lege, it was initiated in 1999 with 10 countries.
cent of the Fortune 500 companies were founded in the last GEM 2010 is currently conducting research in
thirty years, including Google, Microsoft, Apple, and Amazon. 59 countries. The research program, based
Entrepreneurship is an integral component and a key driver on a harmonized assessment of the level of
of economic growth and prosperity. national entrepreneurial activity for all partici-
To get at this, we employ a new measure: the Global Entre- pating countries, involves exploring the role of
preneurship Index, which covers 54 nations worldwide [25]. entrepreneurship in national economic growth.
The index shows the wide disparity in entrepreneurial activity Systematic differences continue, with few
across the nations of the world. Canada, Israel, and the United highly entrepreneurial countries reflecting low
States have the highest levels of entrepreneurial activity, while economic growth. There is, further, a wealth of
Denmark, Finland, France, Germany, and Japan have the low- national features and characteristics associ-
est. One in every twelve workers in the United States is involved ated with entrepreneurial activity. The program
in a start-up company, as compared to fewer than one in 67 creates both individual national papers and
persons in Finland, according to the study. an annual global report. Over 120 scholars and
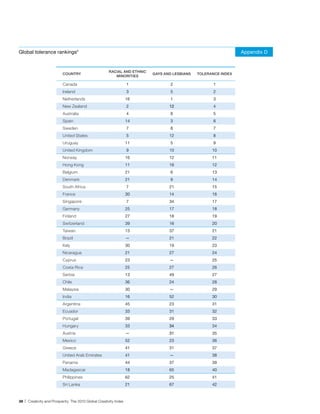
exhibit 17 shows the correlation between the Global Entre- researchers are actively participating in the
preneurship Index and the GCI as well as each of our 3 T indices. GEM project.
Of the 3 Ts, Talent has the strongest relationship to the Global
http://www.gemconsortium.org
Entrepreneurship Index (0.74), followed by Tolerance (0.71), and
Technology (with a weaker correlation of 0.55). The correlation
20 | Creativity and Prosperity: The 2010 Global Creativity Index](https://image.slidesharecdn.com/creativityglobalindexreportmartininst-sep2011-111005030700-phpapp01/85/Creativity-global-index-report-martin-inst-sep-2011-28-320.jpg)
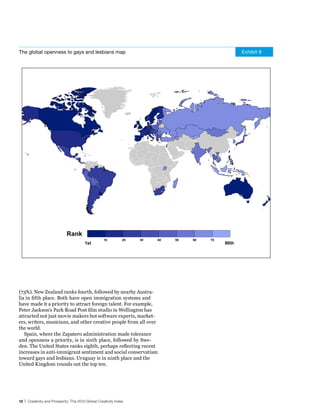
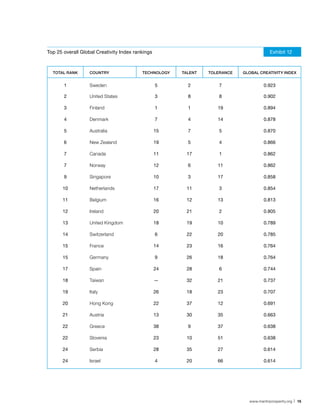
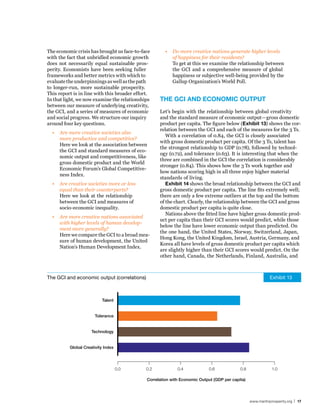
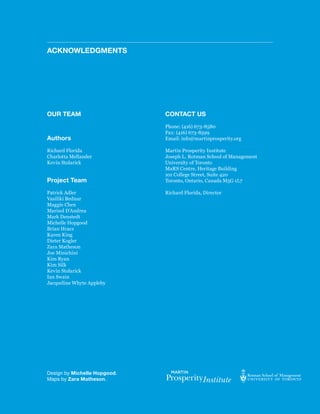
![for the overall GCI (0.81) is the strongest, The GCI And InequAlITy
again showing the combined strength of the
3 Ts working together. We now turn to the relationship between global creativity and
exhibit 18 shows the broad relationship inequality. Some would argue that the shift to a creative knowl-
between the GCI and the Global Entrepre- edge-based economy exacerbates levels of inequality. High-
neurship Index. The fit is good but there are a paying, family supporting manufacturing jobs have declined
large number of countries above and below the and the labor market has split into higher-pay, higher-skill
line. On the one hand, New Zealand, Australia, knowledge and professional jobs on the one hand, and lower-
Sweden, Denmark, the United Kingdom, and pay, lower-skill service jobs on the other. A series of studies
Hong Kong all perform better on the Global documents the growth in income inequality in the United
Entrepreneurship Index than their GCI scores States. According to data from the Congressional Budget Office
would predict. Canada is just slightly above released in June, 2010, average after-tax incomes for the top one
the fitted line, while the United States, perhaps percent of American households rose by 281 percent between
surprisingly, is just below it. On the other hand 1979 and 2007. This compares to increases of 25 percent for the
Germany, France, Belgium, and Singapore have middle fifth of households and 16 percent for the bottom fifth
lower levels of entrepreneurial activity than (all figures are adjusted for inflation) [26].
the GCI would predict.
The GCI and entrepreneurship Exhibit 18
Sweden
New Zealand
Australia
0.8 Finland
Denmark
Canada
Netherlands
Norway
0.7 Italy
Hong Kong
Austria
Slovenia
0.6 Portugal
United Arab Emirates United States
Latvia
Chile
Kazakhstan Poland
Romania Malaysia
Philippines
0.5 China
Mexico
Peru
Entrepreneurship
Ireland
United Kingdom
0.4 Switzerland
Belgium
Turkey
Jamaica
0.3 France
Germany Singapore
Thailand Spain
Iran Hungary
Greece
Indonesia Israel
Serbia
0.2 Croatia
Czech Republic
Macedonia Japan
Bolivia Uruguay
Ecuador Argentina
Egypt South Africa
0.1 Uganda Brazil R 2 Linear = 0.658
0.0 0.2 0.4 0.6 0.8 1.0
Global Creativity Index
www.martinprosperity.org | 21](https://image.slidesharecdn.com/creativityglobalindexreportmartininst-sep2011-111005030700-phpapp01/85/Creativity-global-index-report-martin-inst-sep-2011-29-320.jpg)
![But is this the case across nations? Does increasing creativ- European countries, including Sweden, Den-
ity necessarily lead to increased economic inequality? To get mark, Finland, Norway, the Netherlands, and
at this, we examine the relationship between the GCI and a Germany. Japan is represented as well. Among
standard measure of income inequality—the Gini Index. the less developed nations, we find high levels
exhibit 19 shows the relationships between income inequal- of inequality in South American nations like
ity and the GCI overall as well as each of the 3 T indices that Paraguay, Bolivia, Panama, Brazil, Honduras,
comprise it. While this may come as a surprise for those familiar Ecuador, and Argentina. Of the BRIC nations,
with the case of the United States, we find that the GCI is in fact China, Russia and particularily Brazil all ex-
systematically associated with lower levels of socio-economic hibit much higher levels of inequality than
inequality—and hence greater equality—across the nations of their GCI scores would predict.
the world. There appears to be two distinct paths avail-
Each and every one of the correlations between the GCI and able to high creative development: for every
the Gini is negative. The correlation between inequality and high-creativity, high-inequality nation there is
the overall GCI is −0.43. The Gini is also quite negatively asso- a high-creativity, low-inequality counterpart.
ciated with Technology (−0.47) and Talent (−0.52) but much This is a likely reflection of these countries’
less so with Tolerance (−0.06 and not statistically significant). differing levels of social welfare. Though more
This last is a bit surprising as one might expect more tolerant systematic study is needed before we can draw
societies to be more equal on balance. That said, we believe the any firm conclusions, this finding gives us rea-
overall finding of a negative association between creativity and son for optimism; at the same time, it suggests
inequality to be an important one, for it implies that the general that sustainable, long-term prosperity requires
trajectory of economic development is associated with lower a significant investment in education and skill
levels of inequality. development. This is the topic to which we
exhibit 20 is a scatter-graph which plots the association now turn.
between the Gini measure of income inequality and the GCI
for the nations of the world. The fit is not especially good and
there are lots of countries above and below the line. This sug- The GCI And huMAn
gests that there are two distinctive paths for high creativity
countries. On the one hand, there are countries like the United
develoPMenT
States, the United Kingdom, Singapore, and to a lesser extent,
What is the connection between creativity
Australia and New Zealand, where high levels of creativity,
and human development? To get at this,
productivity and economic competitiveness go hand in hand
we explore the association between the GCI
with higher levels of inequality. But there are also a substantial
and the United Nations’ Human Development
number of countries where high levels of creativity, competi-
Index [27]. “People often value achievements
tiveness and productivity combine with much lower low levels
that do not show up at all, or not immediately,
of inequality. These are largely Scandinavian and Northern
The GCI and inequality (correlations) Exhibit 19
Talent
Tolerance
Technology
Global Creativity Index
−0.6 −0.4 −0.2 0.0
Correlation with Income Inequality
22 | Creativity and Prosperity: The 2010 Global Creativity Index](https://image.slidesharecdn.com/creativityglobalindexreportmartininst-sep2011-111005030700-phpapp01/85/Creativity-global-index-report-martin-inst-sep-2011-30-320.jpg)
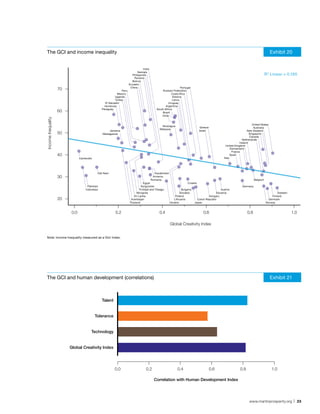
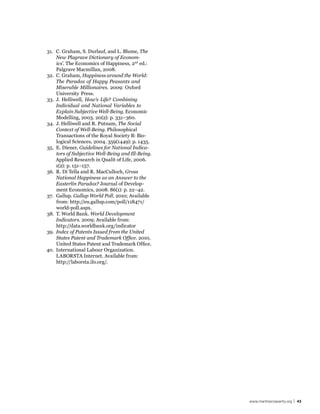
![in income or growth figures,” wrote Mahub ul Haq, founder significantly worse on Human Development
of the UN Human Development Report [27]. The UN Human Index than its GCI score would seem to war-
Development Index takes a wide variety of human development rant. Four less-developed nations—Cambodia,
factors into account, from health conditions and life expectancy Pakistan, Madagascar, and Uganda—lag signif-
to education levels and standards of living. icantly on Human Development when their
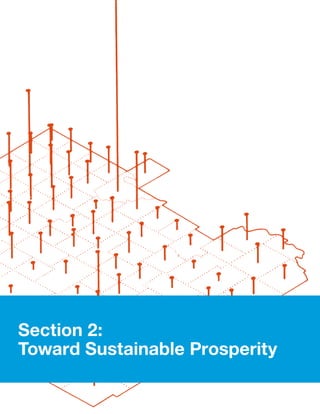
exhibit 21 shows the associations between the Human GCI score is taken into account.
Development Index and the GCI, as well as each of the 3 T
indices that comprise it. The overall GCI is closely associated
with the Human Development Index (the correlation is 0.82). The GCI And hAPPIness
Since the Human Development Index includes a measure of
education, we would expect it to be strongly associated with This leads us to a final question: What is the
our talent index (and it is, with a correlation of 0.83). But it relationship between global creativity and
is also correlated with technology (0.63) and tolerance (0.57). overall happiness? There is considerable
exhibit 22 plots the GCI against the Human Development ongoing debate concerning the relation-
Index for the nations of the world. The fit is good, with outliers ship between economic development and
mainly at the lower left hand quadrant of the graph—among subjective well-being. Much of this debate
the least developed nations of the world. has revolved around the effects of money
The United States performs considerably less well on the or material well-being on happiness. It was
Human Development Index than its GCI score would predict; initially found that the relationship between
Canada performs slightly better. Of the BRICs, India performs income and happiness only holds within, and
The GCI and human development Exhibit 22
Greece Australia
Japan Norway
Israel Canada
Republic of Korea Netherlands
Czech Republic Ireland
Estonia Switzerland
1.0 Macedonia United Arab Emirates France
Romania Lithuania Spain
Panama Poland
Kazakhstan Cyprus
Mexico Slovakia
Trinidad and Tobago Chile Sweden
Ecuador Malaysia Italy United States
0.9 Thailand Peru Hong Kong Finland
Jamaica Turkey Austria Denmark
Saudi Arabia Slovenia New Zealand
Iran Hungary Singapore
Belgium
United Kingdom
Human Development Index
0.8 Serbia
Germany
Viet Nam Portugal
Indonesia Brazil Latvia
Ukraine Russian Federation
Armenia Costa Rica
Georgia Croatia
0.7 Philippines Uruguay
China Argentina
Bolivia Bulgaria
Egypt Nicaragua
Sri Lanka South Africa
Kyrgyzstan
Mongolia
0.6 Azerbaijan
El Salvador India
Honduras
Paraguay
Pakistan
Cambodia
0.5
Uganda
Madagascar
0.4 R 2 Linear = 0.666
0.0 0.2 0.4 0.6 0.8 1.0
Global Creativity Index
24 | Creativity and Prosperity: The 2010 Global Creativity Index](https://image.slidesharecdn.com/creativityglobalindexreportmartininst-sep2011-111005030700-phpapp01/85/Creativity-global-index-report-martin-inst-sep-2011-32-320.jpg)
![not across countries, the so-called “Easterlin effect” [28]. More
recent econometric studies by Angus Deaton [29] and Betsey
Stevenson and Justin Wolfers [30], based on new data collect-
ed worldwide by the Gallup Organization, have challenged this
view, finding that income exerts strong effects on happiness
across the board. Carol Graham seeks to square this analyti-
cal circle, calling attention to the paradox of the “happy peasant
and the miserable millionaire,” suggesting that while people
can adapt to be happy at low levels of income, they are far less
happy when there is uncertainty over their future wealth [31,
32]. Some have gone so far as to suggest that life satisfaction
and well-being be utilized to supplement more conventional
measures of economic output like Gross Domestic Product.
John Helliwell [33, 34], Joseph Stiglitz [1], Ed Diener [35], and
Rafael Di Tella and Robert MacCulloch [36], among others, have
made the case for a measure of Gross National Happiness.
We examine the relationship between the GCI and a compre-
hensive measure of happiness and life-satisfaction collected by
the Gallup Organization’s World Poll [37]. The World Poll covers
roughly 150 nations and measures life satisfaction using a stan-
dard set of core questions which ask individuals to rank their
satisfaction with aspects of their life in real time.
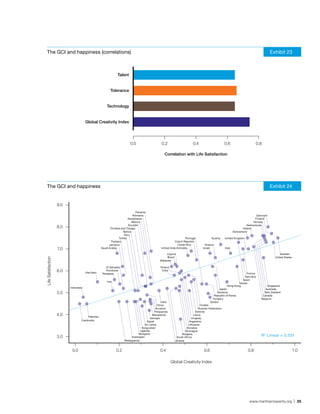
exhibit 23 shows the associations between well-being or life
satisfaction and the overall GCI as well as the 3 T indices that
comprise it. Life satisfaction is approximately equally related to
all 3 Ts, with only a slightly stronger relation to Tolerance
(0.66), followed by Talent (0.65) and Technology (0.65). The
overall GCI is closely associated with life satisfaction (a correla-
tion of 0.74). Once again, we note that the association is consid-
erably stronger when the 3 Ts are combined into the overall GCI
measure. This again illustrates the power of the 3 Ts working
together to condition higher levels of life satisfaction and well-
being.
exhibit 24 plots the GCI against life satisfaction. The fit is
reasonably good, with outliers mainly at the bottom quadrants
of the graph—that is, among the less developed nations. The
relationship between the GCI and life satisfaction is strongest
among the more advanced nations. Denmark, Finland, the
Netherlands, Ireland, Switzerland, New Zealand, and Canada
have higher levels of life satisfaction than their GCI scores
would predict. The United States has a level of life satisfac-
tion that is roughly in line with its GCI score. Singapore, the
United Kingdom, Taiwan, Hong Kong, and Korea have lower
levels of life satisfaction than their GCI scores would predict.
Among the BRICs, Brazil has a significantly higher level of life
satisfaction than its GCI score would predict, while Russia’s is
considerably lower. Both India and China have lower levels of
life satisfaction than the GCI would predict.
26 | Creativity and Prosperity: The 2010 Global Creativity Index](https://image.slidesharecdn.com/creativityglobalindexreportmartininst-sep2011-111005030700-phpapp01/85/Creativity-global-index-report-martin-inst-sep-2011-34-320.jpg)
![APPendIx
MeThodoloGy, vArIAbles, And dATA
The data in this report cover 82 nations for the period 2000 to 2009. Note that we use different years
for different variables, and sometimes utilize running averages, depending on data availability. The
following describes the main variables and data sources used in this report.
TeChnoloGy
We use three variables for technology: R&D investment, research, and innovation.
Global r&d investment
This measures R&D spending as a share of GDP. It is adapted from World Development Indicators
of the World Bank. It is defined as “current and capital expenditures on creative work undertaken
systematically to increase the stock of knowledge, including knowledge of humanity, culture, and
society, and the use of knowledge to devise new applications. R&D covers basic research, applied
research, and experimental development.”
Global researchers
This variable measures professional researchers engaged in R&D per million capita. It is adapted
from World Development Indicators and covers the years 2000 to 2005. Professional researchers
are defined as “professionals engaged in conceiving of or creating new knowledge, products, processes,
methods, and systems and in managing projects concerned. Postgraduate students at the doctoral
level (ISCED97 level 6) engaged in R&D are considered researchers.”
The World Development Indicators are published by The World Bank on a yearly basis. The data
is reported for 127–146 different countries depending on the year. However, since countries do not
always report on an annual basis, we use averages for several years. This results in higher numbers
of observations and also smoothes out extreme values. [38].
Global innovation
This variable measures patents granted per capita. It is adapted from the United States Patent and
Trademark Office (USPTO) and covers the years 2001–2008. US patents are a reasonable proxy for
global innovation as inventors from around the world file for patent protection in the United States
and the USPTO tracks inventors’ national origins. We count the number of granted US patents for
each nation in the world. [39].
28 | Creativity and Prosperity: The 2010 Global Creativity Index](https://image.slidesharecdn.com/creativityglobalindexreportmartininst-sep2011-111005030700-phpapp01/85/Creativity-global-index-report-martin-inst-sep-2011-36-320.jpg)
![The technology index
The Technology Index combines all three of these variables in a single measure. The overall Technol-
ogy Index is based on a principal component analysis, where the correlations between the overall
index and the three constituent measures are as follows: Global R&D Investment (0.878), Global
Researchers (0.894), and Global Innovation (0.943) with patents per capita. In other words, the over-
all technology score is based on the value for each sub-variable, and not its ranking. We estimate the
index for countries with missing values by running regressions based on the variables for which we do
have values. The R2s for these regressions are as follows: 0.535 for Global R&D Investment, 0.588 for
Global Researchers, and 0.702 for Global Innovation.
TAlenT
We employ two measures of talent: human capital and Creative Class population.
human capital
The human capital variable is based on the standard measure of educational attainment. Specifically
we use data on the rate of enrollment in tertiary or post-high school education from the World Devel-
opment Indicators. The data is reported to the UNESCO Institute by national education agencies.
Tertiary education is defined as “a wide range of post-secondary education institutions, including
technical and vocational education, colleges, and universities, whether or not leading to an advanced
research qualification, that normally require as a minimum condition of admission the successful
completion of education at the secondary level.” The data cover the years 2004 and 2006 and are
based on annual school surveys, normally conducted in the beginning of the year, and do not therefore
reflect dropouts or actual attendance.
Creative Class
The creative class variable is based on data from the International Labour Organization [40] and covers
the years 2004–2007. It is calculated as the share of a country’s labor force that is engaged in a higher
degree of problem solving in their everyday work. It includes occupations such as computer science and
mathematics; architecture, engineering; life, physical, and the social sciences; education, training, and
library science; arts and design work, entertainment, sports, and media; and professional and knowl-
edge work occupations in management, business and finance, law, sales management, and healthcare.
The talent index
The Talent Index combines these two variables in a single index which is based on a principal component
analysis, where the correlations are 0.872 for the Creative Class variable and the Human Capital vari-
able respectively. In other words, the overall talent score is based on the value for each sub-variable and
not its ranking. We estimate missing values through a regression analysis, which generates an R2 value
of 0.501.
www.martinprosperity.org | 29](https://image.slidesharecdn.com/creativityglobalindexreportmartininst-sep2011-111005030700-phpapp01/85/Creativity-global-index-report-martin-inst-sep-2011-37-320.jpg)
![TolerAnCe
We employ two measures of tolerance; both are from the Gallup Organization’s World Poll. [37]
Tolerance toward ethnic and racial minorities
The survey asks “Is your city or area a good or bad place to be in for ethnic and racial minorities?”
Our variable scores the share of the respondents who said their place is a good place. The value is
for the year 2009.
Tolerance toward gays and lesbians
The survey asks “Is your city or area a good or bad place to be in for gay and lesbian people?” Our
variable scores the share of the respondents who said their place is a good place. Again, the value
is for the year 2009.
The Gallup World Poll survey is based on approximately 1,000 interviews per country (adjusted
depending on population size) which are conducted in approximately 150 countries. The sample
represents roughly 95 percent of the world’s adult population and is stratified proportionally, with the
distribution of the population across cities and rural areas of different sizes. (For more information
about the sampling procedure, see: http://www.gallup.com/consulting/worldpoll/108082/Sampling.
aspx). The target population is all civilian, non-institutionalized, and ages 15 years or older. For more
information about the methodology, see: http://www.gallup.com/consulting/worldpoll/108079/
Methodological-Design.aspx).
These tolerance measures differ from those used in the earlier version of the Global Creativity
Index that was presented in Richard Florida’s The Flight of the Creative Class [8], which were based
on variables from the World Values Survey. The new measures represent an improvement across two
dimensions. First and foremost, the newly available Gallup World Poll data provides a better, more
direct measure of tolerance. And second, the World Poll data covers a larger number of countries.
That said, these two sets of variables are closely correlated. Our Gallup World Poll measure of Racial
and Ethnic Tolerance is correlated at .501 with our earlier tolerance measure, while the Gallup Gay
and Lesbian Tolerance measure is correlated at 0.822 with our earlier measure.
The tolerance index
The Tolerance Index is based on the two measures above. The two are equally weighted into a factor
where both correlate at 0.92. We estimate missing values based on a regression analysis, which gener-
ates an R2 value of 0.432.
The GlobAl CreATIvITy Index
To create the final Global Creativity Index, we constructed the talent, technology and tolerance
variable based on principle component analysis. In other words, each of the scores are based on
the actual performance and not the rank of each individual variable. We thereafter ranked each of
the 3 T variables, with the highest number to the best performer. We added the ranks together and
divided by three. In the case where we had a value for just two of the three variables, these two were
added and divided by two. To get the Global Creativity Index score, the average score of the 3 Ts were
divided by the number of observations overall.
30 | Creativity and Prosperity: The 2010 Global Creativity Index](https://image.slidesharecdn.com/creativityglobalindexreportmartininst-sep2011-111005030700-phpapp01/85/Creativity-global-index-report-martin-inst-sep-2011-38-320.jpg)
![eConoMIC And soCIAl ProGress MeAsures
We employ the following measures of economic and social progress in our analysis.
economic output /GdP per capita
We employ the conventional measure of economic output: GDP per capita. The data are from World
Development Indicators for the year 2005. [38].
Global competitiveness index
We use the Global Competitiveness Index developed by Michael Porter for the World Economic Forum.
It is based on the following categories: basic requirements (including institutions, infrastructure, mac-
roeconomic stability, and health and primary education), efficiency enhancers (including higher edu-
cation and training, goods market efficiency, labor market efficiency, financial market sophistication,
technological readiness, and market size), and innovation factors (including business sophistication
and innovation). [24].
Global entrepreneurship index
This variable is based on the Global Entrepreneurship Index developed by Zoltan Acs and Laszlo
Szerb. The index consists of several measures of entrepreneurial attitudes, activity, and aspiration,
and covers the years 2004–2008. [25].
Income inequality
This variable is based on the standard measure of an Income Inequality—a Gini Index. The Gini
Index measures the distribution of incomes in a nation, ranging from 0 to 100 where 0 represents
absolute equality and 100 absolute inequality. This variable is from the World Bank’s World Develop-
ment Indicators for the year 2007 [38].
human development index
This variable is based on the United Nations Human Development Index, a composite measure which
aims to capture three dimensions of human development: health and measured life expectancy, edu-
cation level, and standard of living. We employ the 2009 index, which is based on data from 2007 [27].
happiness/ life satifaction
This variable is from the Gallup Organization’s 2009 Gallup World Poll. It is representative of 95
percent of the world population, and is based on telephone surveys and face-to-face interviews which
pose this question: “Please imagine a ladder with steps numbered from 0 at the bottom to ten at the
top. Suppose we say that the top of the ladder represents the best possible life for you, and the bottom
represents the worst possible life for you. On which step of the ladder would you say you personally
feel you stand at this time, assuming that the higher the step the better you feel about your life, and
the lower the step the worse you feel about it? Which step comes closest to the way you feel?” Our
variable is the national average rank of life satisfaction [37].
www.martinprosperity.org | 31](https://image.slidesharecdn.com/creativityglobalindexreportmartininst-sep2011-111005030700-phpapp01/85/Creativity-global-index-report-martin-inst-sep-2011-39-320.jpg)
![reFerenCes 18. R. Inglehart, The Silent Revolution:
Changing Values and Political Styles
Among Western Publics. 1977, Princeton,
N.J.: Princeton University Press. xii, 482 p.
19. R. Inglehart and P. Norris, Rising Tide:
Gender Equality and Cultural Change
Around the World. 2003, Cambridge;
New York: Cambridge University Press.
xiv, 226 p.
1. J.E. Stiglitz, A. Sen, and J.P. Fitoussi, Report by the Com-
20. R. Inglehart and C. Welzel, Moderniza-
mission on the Measurement of Economic Performance
tion, Cultural Change, and Democracy:
and Social Progress. 2009, Commission on the Measure-
The Human Development Sequence. 2005,
ment of Economic Performance and Social Progress: Paris.
New York, NY: Cambridge University Press.
2. A. Smith, An Inquiry into the Nature and Causes of the
x, 333 p.
Wealth of Nations. 2nd ed. Great Books of the Western
21. D. Senor and S. Singer, Start-up Nation:
World. 1990, Chicago; London: Encyclopaedia Britannica.
The Story of Israel’s Economic Miracle.
viii, 515 p.
2009: McClelland & Stewart Ltd.
3. D. Ricardo, Principles of Political Economy and Taxation.
22. R. Florida and G. Gates, Technology and
2005, New York: Barnes & Noble Books. xvii, 350 p.
Tolerance. The Brookings Review, 2002.
4. K. Marx, et al., Capital: A Critical Analysis of Capitalist
20(1): p. 32–36.
Production. 1887, London: Swan Sonnenschein, Lowrey
23. M. Noland, Popular Attitudes, Global-
& Co. 2 v.
ization and Risk. International Finance,
5. J. Jacobs, The Economy of Cities. 1969, New York: Random
2005. 8(2): p. 199–229.
House. 268 p.
24. M. Porter, J. Sachs, and J. Warner. The
6. J. Jacobs, Cities and the Wealth of Nations: Principles of
Global Competitiveness Index. 2008.
Economic Life. 1st ed. 1984, New York: Random House. ix,
25. Z.J. Acs and P. Stenholm, A Global Entre-
257 p.
preneurship Index Using Gem Data. 2008.
7. R.L. Florida, The Rise of the Creative Class: And How It’s
26. A Sherman and C. Stone. Income Gaps be-
Transforming Work, Leisure, Community and Everyday
tween Very Rich and Everyone Else More
Life. 2002, New York, NY: Basic Books. xxx, 434 p.
Than Tripled in Last Three Decades, New
8. R.L. Florida, The Flight of the Creative Class: The New
Data Show. Poverty and Income 2010;
Global Competition for Talent. 2004, New York: Harper-
Available from: http://www.cbpp.org/cms/
Business. 326 p.
index.cfm?fa=view&id=3220.
9. J.A. Schumpeter, Capitalism, Socialism, and Democracy.
27. Human Development Report 2010, in
2nd ed. 1947, New York: Harper. xiv, 411 p.
The Real Wealth of Nations: Pathways
10. R.M. Solow, Growth Theory and Exposition. 1970, Oxford:
to Human Development. 2010, United
Clarendon Press. vi, 109 p.
Nations Development Program: New York.
11. P.F. Drucker, The Age of Discontinuity; Guidelines to Our
28. R. Easterlin, Will Raising the Incomes of
Changing Society. [1st ed. 1969, New York: Harper & Row.
All Increase the Happiness of All? Journal
xiii, 394 p.]
of Economic Behavior & Organization,
12. F. Machlup, The Production and Distribution of Knowl-
1995. 27(1): p. 35–47.
edge in the United States. 1962: Princeton University Press.
29. A. Deaton, Income, Health and Wellbeing
13. P. Romer, Endogenous Technological Change. Journal of
Around the World: Evidence from Gal-
Political Economy, 1990. 98(5): p. 71–102.
lup World Poll. The Journal of Economic
14. E.L. Glaeser, Are Cities Dying? Journal of Economic Per-
Perspectives: A Journal of the American
spectives, 1998. 12(1): p. 39–160.
Economic Association, 2008. 22(2): p. 53.
15. R.E. Lucas, On the Mechanics of Economic Development.
30. B. Stevenson and J. Wolfers, Economic
Journal of Monetary Economics. [Offprint]. p. 3–42.
Growth and Subjective Well-Being: Reas-
16. C.R. Berry and E.L. Glaeser, The Divergence of Human
sessing the Easterlin Paradox. Brook-
Capital Levels Across Cities. Papers in Regional Science,
ings Papers on Economic Activity, 2008.
2005. 84(3): p. 407–444.
2008(1): p. 1–87.
17. S.E. Page, The Difference: How the Power of Diversity
Creates Better Groups, Firms, Schools, and Societies. 2007,
Princeton, N.J.: Princeton University Press. xxiv, 424 p.
42 | Creativity and Prosperity: The 2010 Global Creativity Index](https://image.slidesharecdn.com/creativityglobalindexreportmartininst-sep2011-111005030700-phpapp01/85/Creativity-global-index-report-martin-inst-sep-2011-50-320.jpg)


The Global Creativity Index (GCI) report by the Martin Prosperity Institute evaluates the relationship between creativity and economic prosperity across 82 nations, emphasizing the importance of technology, talent, and tolerance as key factors. Sweden ranks first overall, with the United States second and Finland third, while the report highlights the significance of the creative class in driving economic growth. The findings suggest that nations optimizing these factors can achieve sustainable prosperity that incorporates economic output, equality, and well-being.


