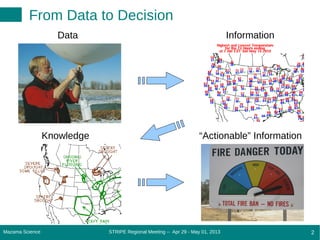
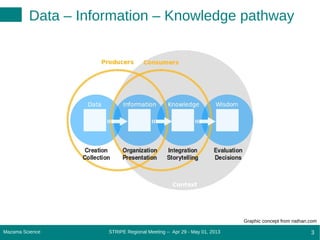
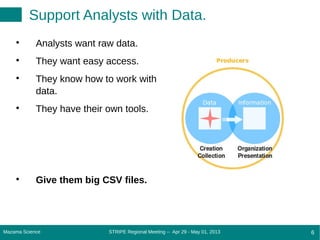
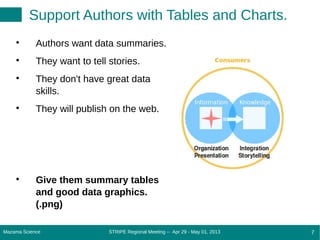
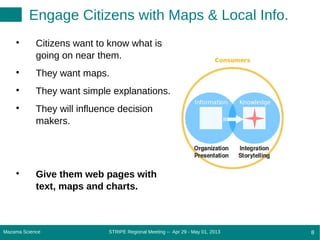
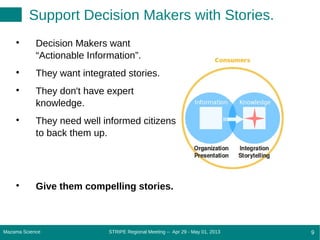
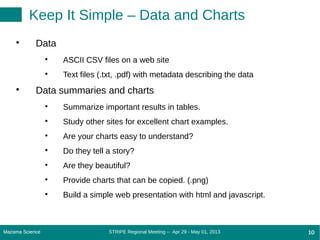
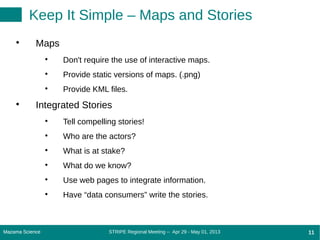
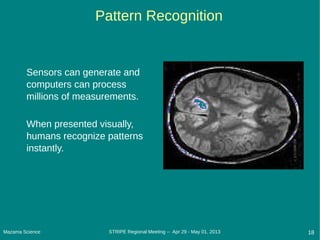
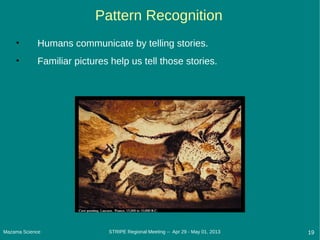
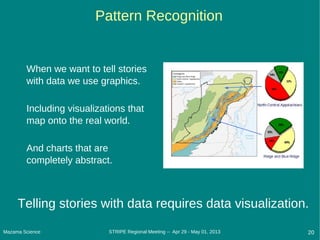
1. Creating Usable Data
Usable Data and “Actionable” Information
Jonathan Callahan
Mazama Science
MAZAMA SCIENCE
Data – Information – Knowledge
2. STRIPE Regional Meeting -- Apr 29 - May 01, 2013Mazama Science 2
From Data to Decision
Data
“Actionable” InformationKnowledge
Information
3. STRIPE Regional Meeting -- Apr 29 - May 01, 2013Mazama Science 3
Data – Information – Knowledge pathway
Graphic concept from nathan.com
4. STRIPE Regional Meeting -- Apr 29 - May 01, 2013Mazama Science 4Mazama Science 4
From Theory to Practice.
“Data – Information – Knowledge” is the theory.
Data files and software is the practice.
How do data managers start creating “Usable Data”?
How does this lead to “Actionable Information”?
5. STRIPE Regional Meeting -- Apr 29 - May 01, 2013Mazama Science 5Mazama Science 5
For Usable Data – Identify Your Users!
Do you want to support analysts?
(data only)
Do you want to support authors?
(data summaries and charts)
Do you want to engage local citizens?
(maps and local information)
Do you want to support decision makers?
(integrated stories)
6. STRIPE Regional Meeting -- Apr 29 - May 01, 2013Mazama Science 6
Support Analysts with Data.
Analysts want raw data.
They want easy access.
They know how to work with
data.
They have their own tools.
Give them big CSV files.
7. STRIPE Regional Meeting -- Apr 29 - May 01, 2013Mazama Science 7
Support Authors with Tables and Charts.
Authors want data summaries.
They want to tell stories.
They don't have great data
skills.
They will publish on the web.
Give them summary tables
and good data graphics.
(.png)
8. STRIPE Regional Meeting -- Apr 29 - May 01, 2013Mazama Science 8
Engage Citizens with Maps & Local Info.
Citizens want to know what is
going on near them.
They want maps.
They want simple explanations.
They will influence decision
makers.
Give them web pages with
text, maps and charts.
9. STRIPE Regional Meeting -- Apr 29 - May 01, 2013Mazama Science 9
Support Decision Makers with Stories.
Decision Makers want
“Actionable Information”.
They want integrated stories.
They don't have expert
knowledge.
They need well informed citizens
to back them up.
Give them compelling stories.
10. STRIPE Regional Meeting -- Apr 29 - May 01, 2013Mazama Science 10Mazama Science 10
Keep It Simple – Data and Charts
Data
ASCII CSV files on a web site
Text files (.txt, .pdf) with metadata describing the data
Data summaries and charts
Summarize important results in tables.
Study other sites for excellent chart examples.
Are your charts easy to understand?
Do they tell a story?
Are they beautiful?
Provide charts that can be copied. (.png)
Build a simple web presentation with html and javascript.
11. STRIPE Regional Meeting -- Apr 29 - May 01, 2013Mazama Science 11Mazama Science 11
Keep It Simple – Maps and Stories
Maps
Don't require the use of interactive maps.
Provide static versions of maps. (.png)
Provide KML files.
Integrated Stories
Tell compelling stories!
Who are the actors?
What is at stake?
What do we know?
Use web pages to integrate information.
Have “data consumers” write the stories.
12. STRIPE Regional Meeting -- Apr 29 - May 01, 2013Mazama Science 12
Examples of an 'engaged public'.
14. STRIPE Regional Meeting -- Apr 29 - May 01, 2013Mazama Science 14
Number Crunchers
Pattern Recognizers
& Story Tellers
The story behind this presentation.
15. Mazama Science 15STRIPE Regional Meeting -- Apr 29 - May 01, 2013
Number Crunchers
Fast
Accurate
Consistent
> 50 years of evolution
Very good at what they do!
16. Mazama Science 16STRIPE Regional Meeting -- Apr 29 - May 01, 2013
Pattern Recognizers
Fast!
Accurate ~
Creative!!
> 50K years of evolution
Awesome at what we do!
17. Mazama Science 17STRIPE Regional Meeting -- Apr 29 - May 01, 2013
Pattern Recognition
Humans are better than
computers are recognizing
patterns.
18. Mazama Science 18STRIPE Regional Meeting -- Apr 29 - May 01, 2013
Pattern Recognition
Sensors can generate and
computers can process
millions of measurements.
When presented visually,
humans recognize patterns
instantly.
19. Mazama Science 19STRIPE Regional Meeting -- Apr 29 - May 01, 2013
Pattern Recognition
• Humans communicate by telling stories.
• Familiar pictures help us tell those stories.
20. Mazama Science 20STRIPE Regional Meeting -- Apr 29 - May 01, 2013
Pattern Recognition
When we want to tell stories
with data we use graphics.
Including visualizations that
map onto the real world.
And charts that are
completely abstract.
Telling stories with data requires data visualization.