Download to read offline


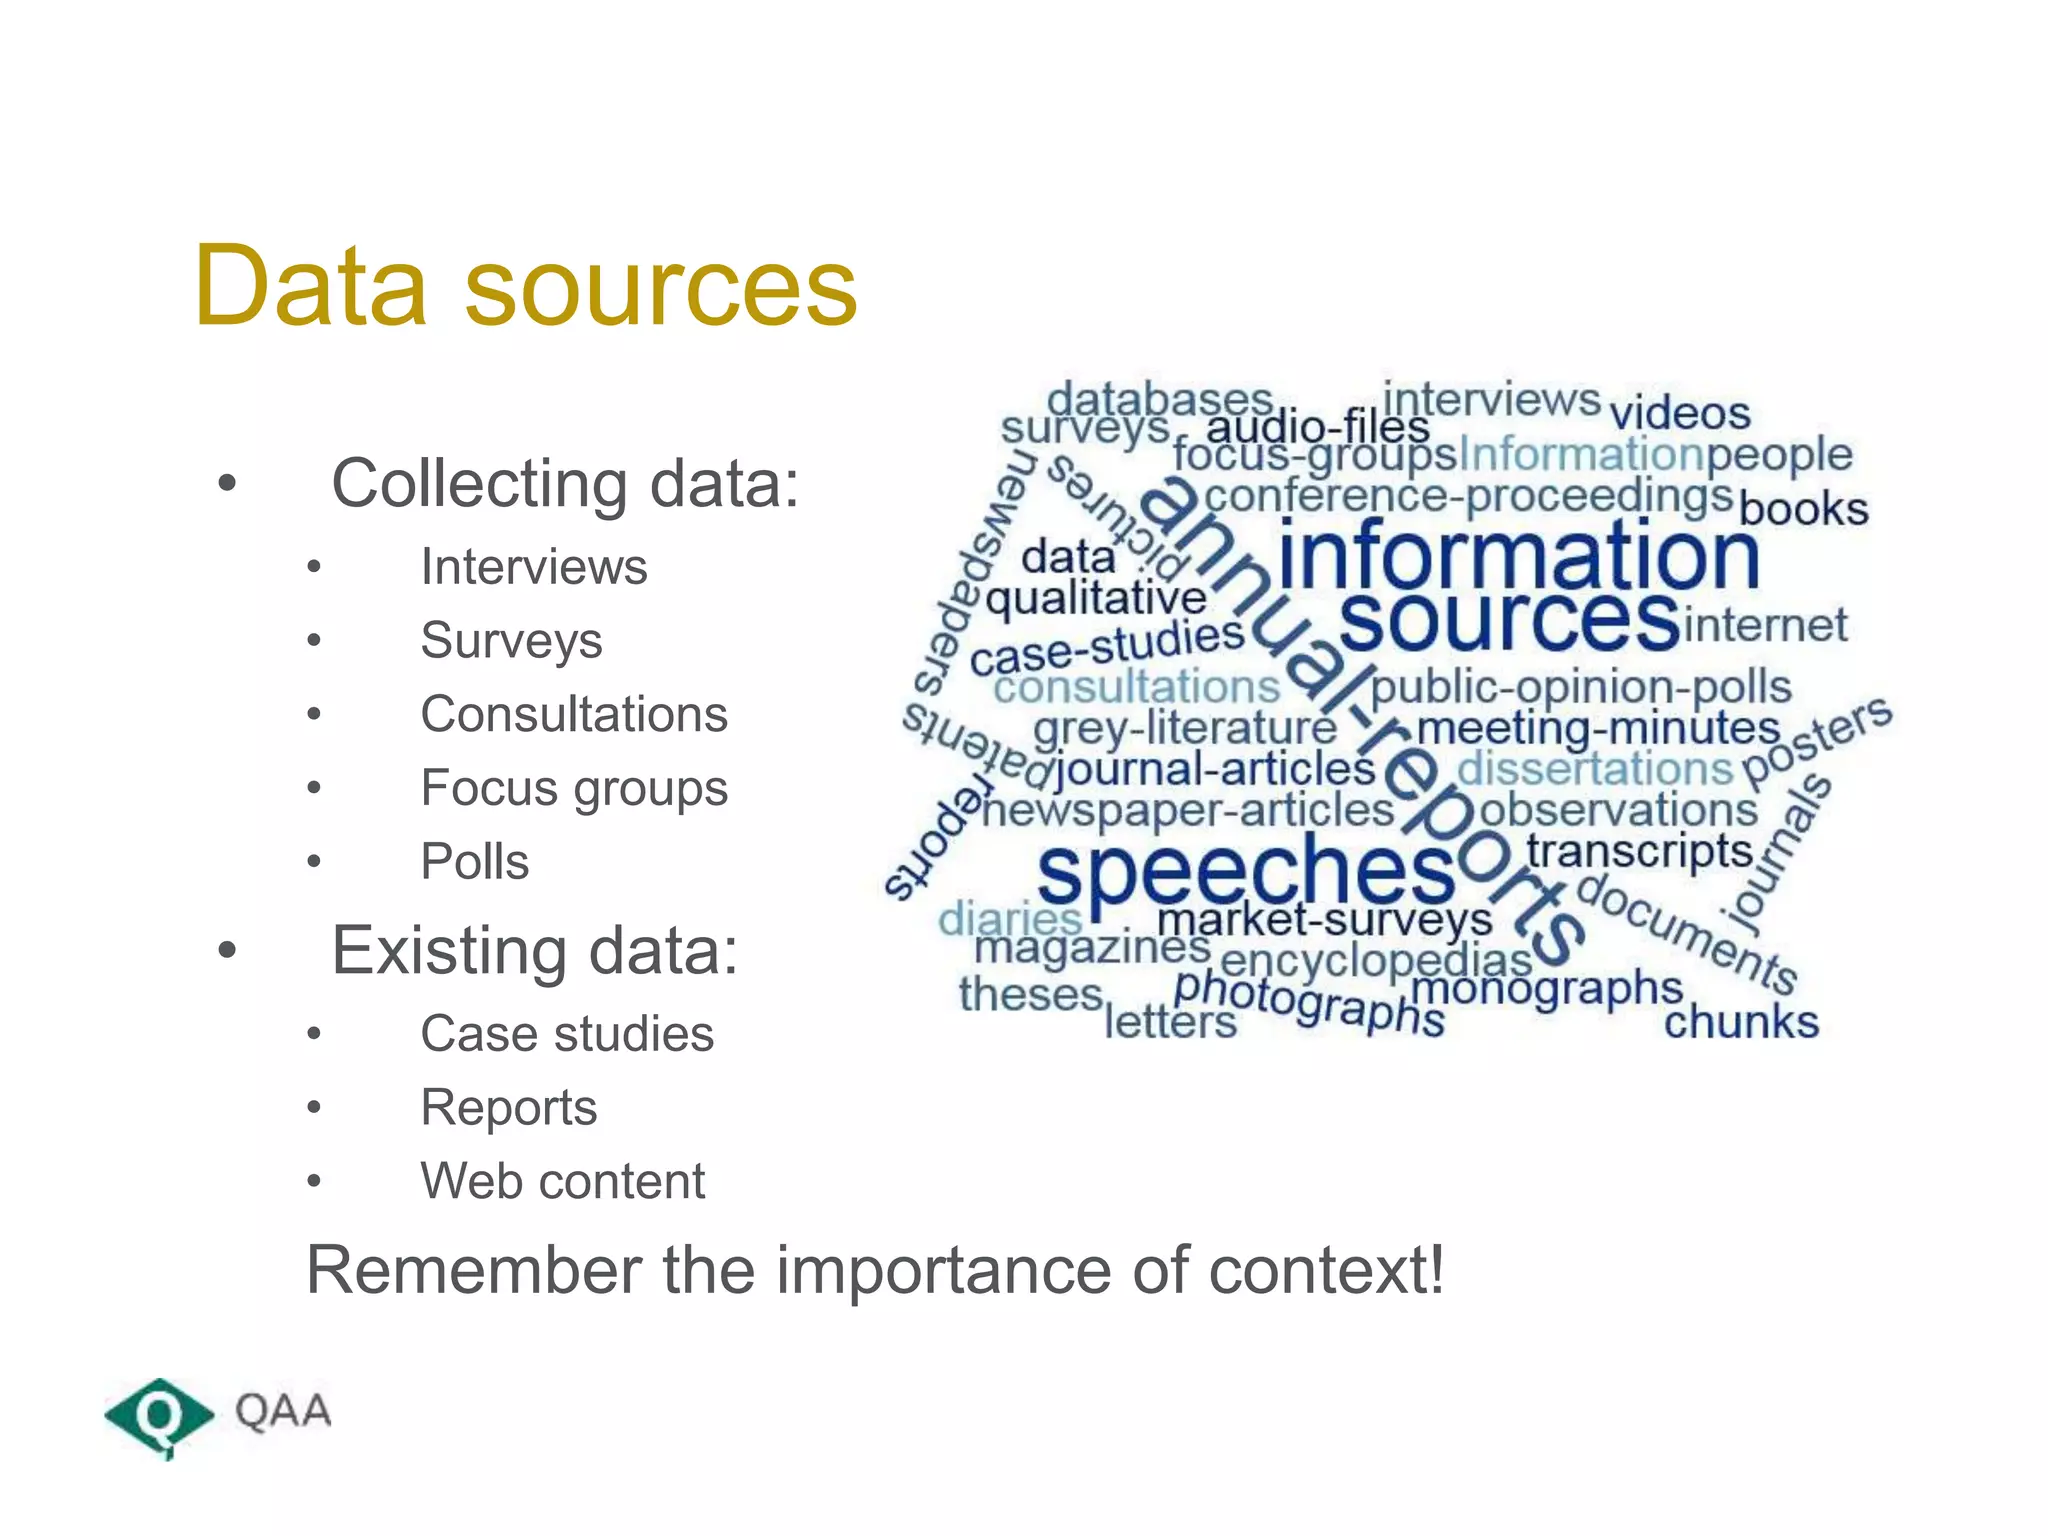

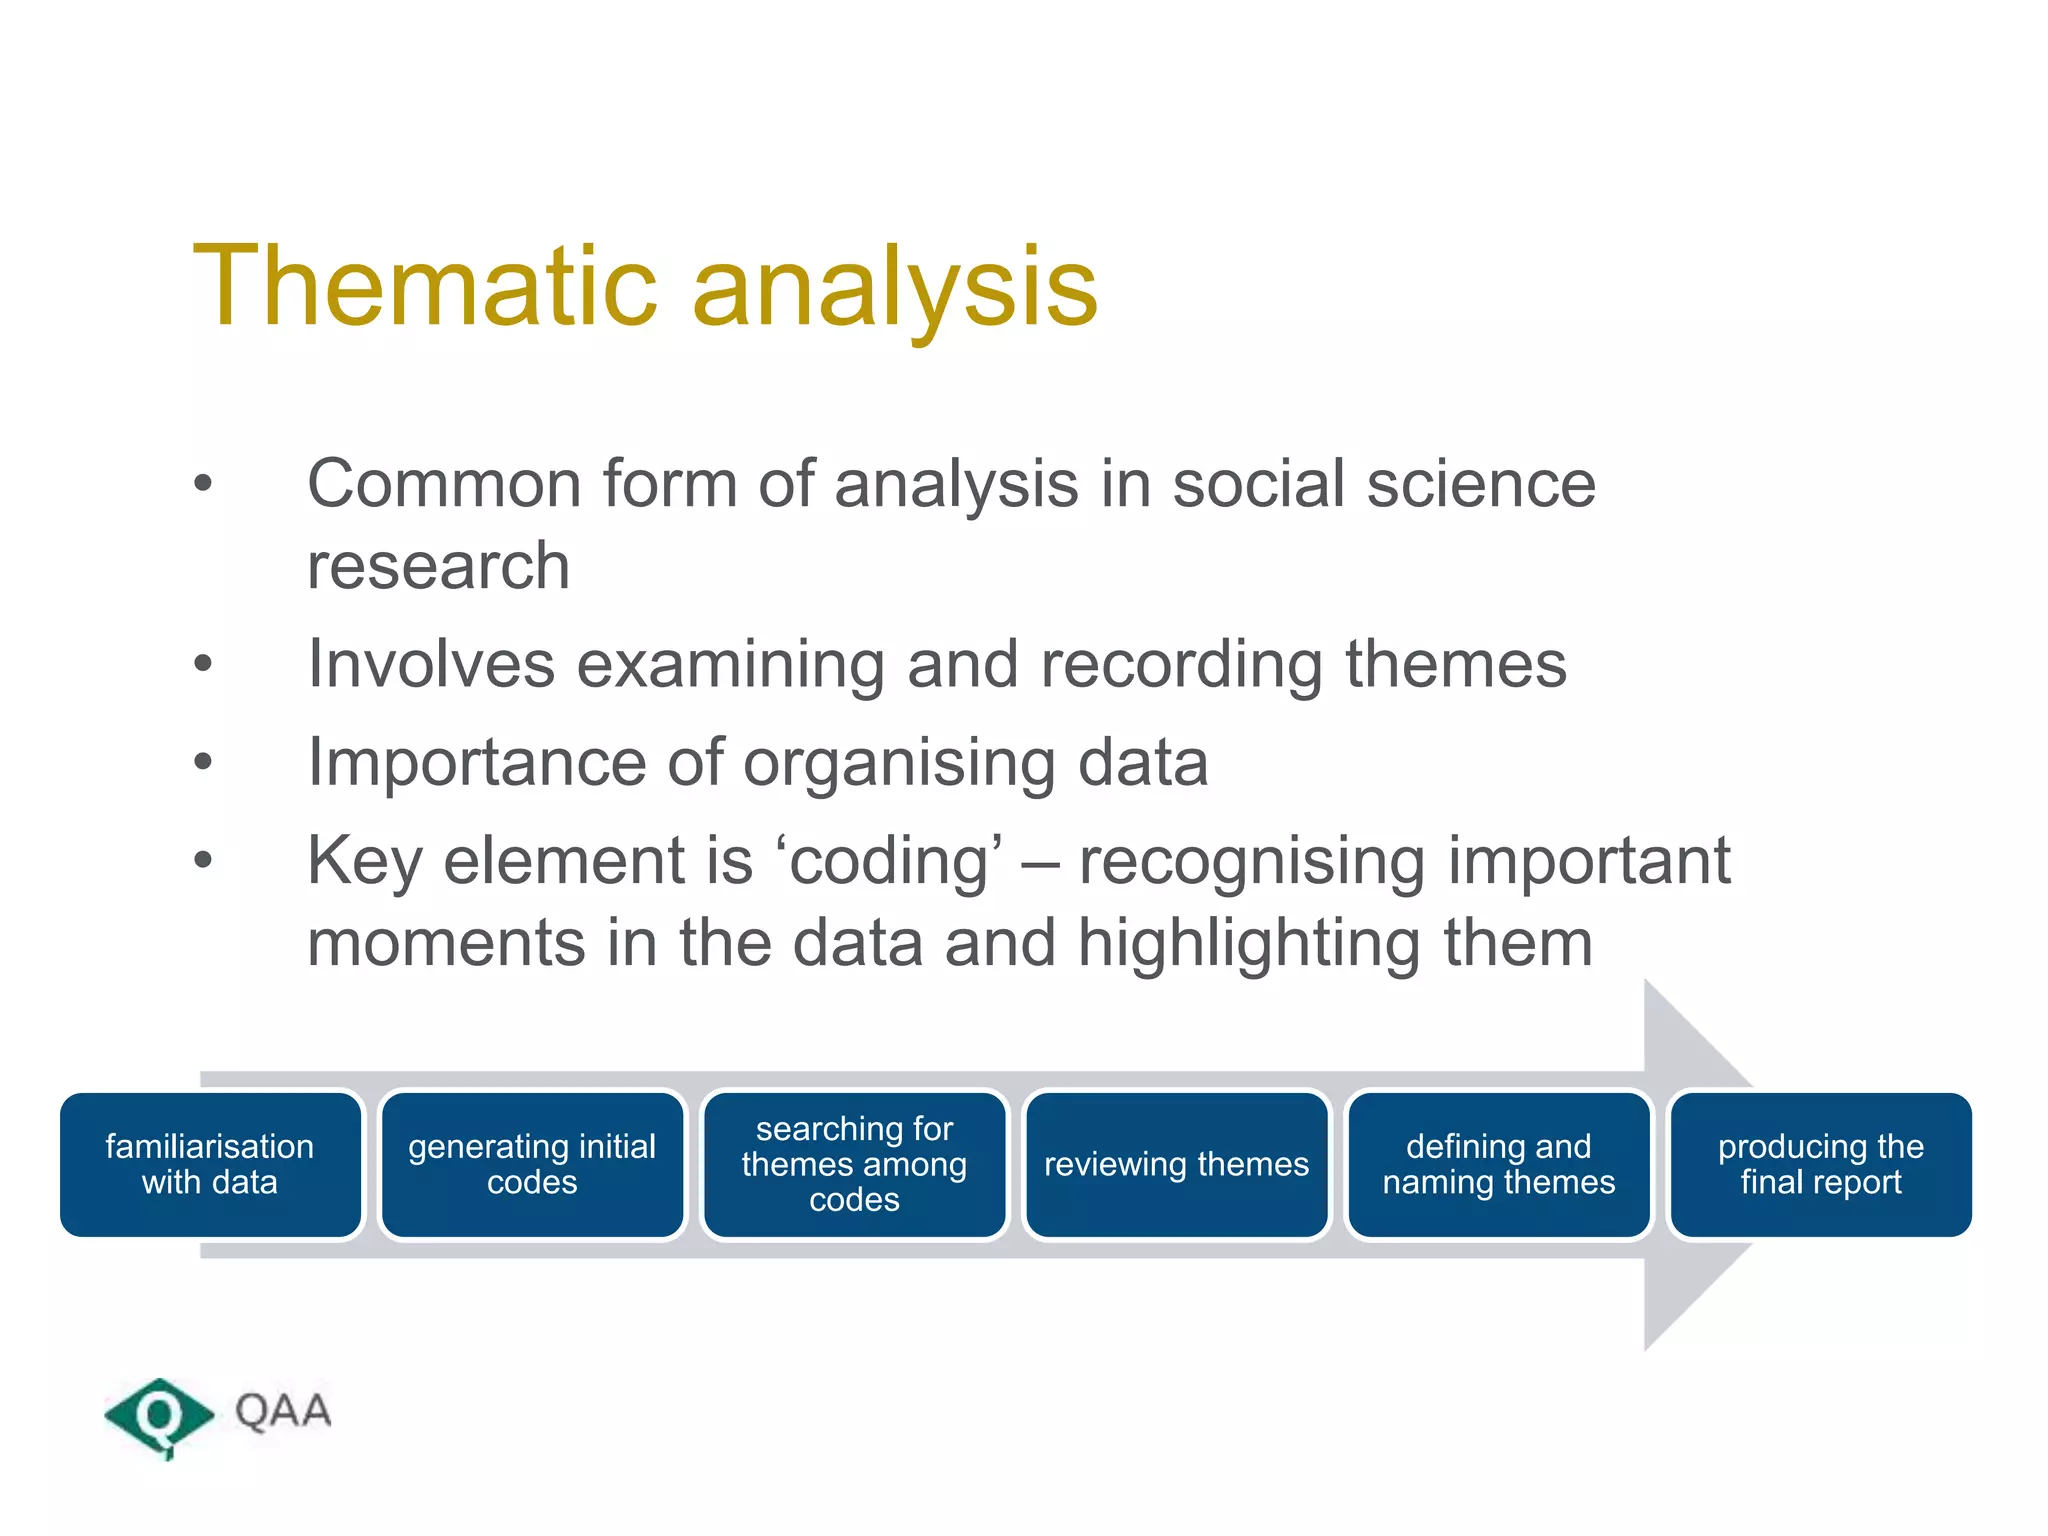
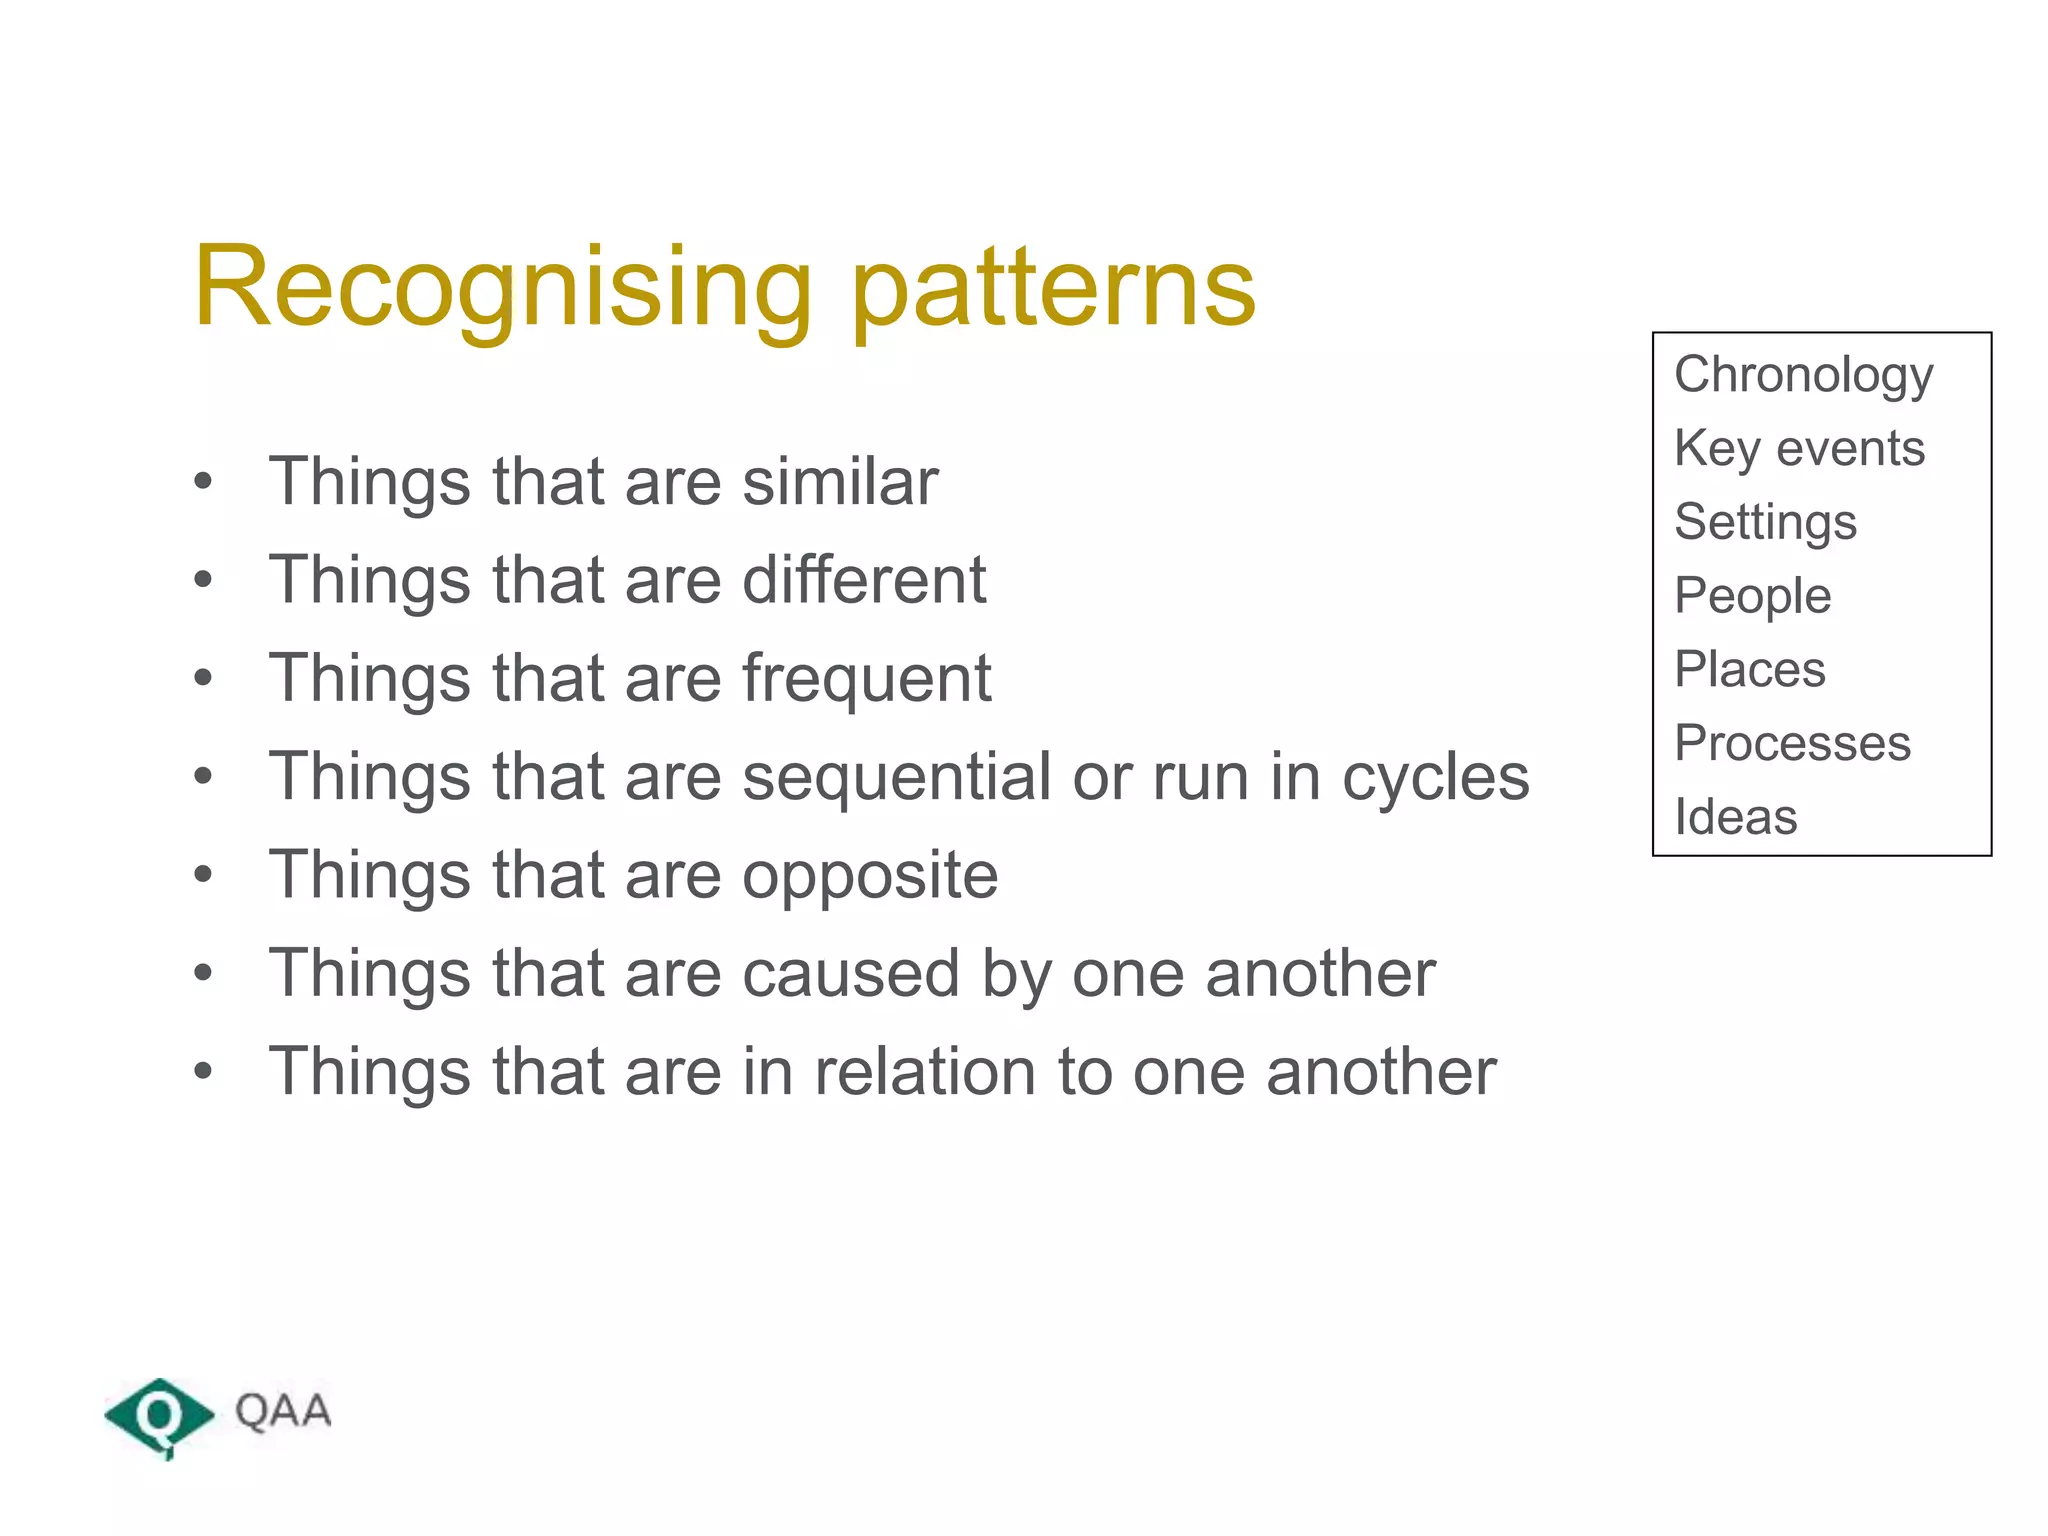
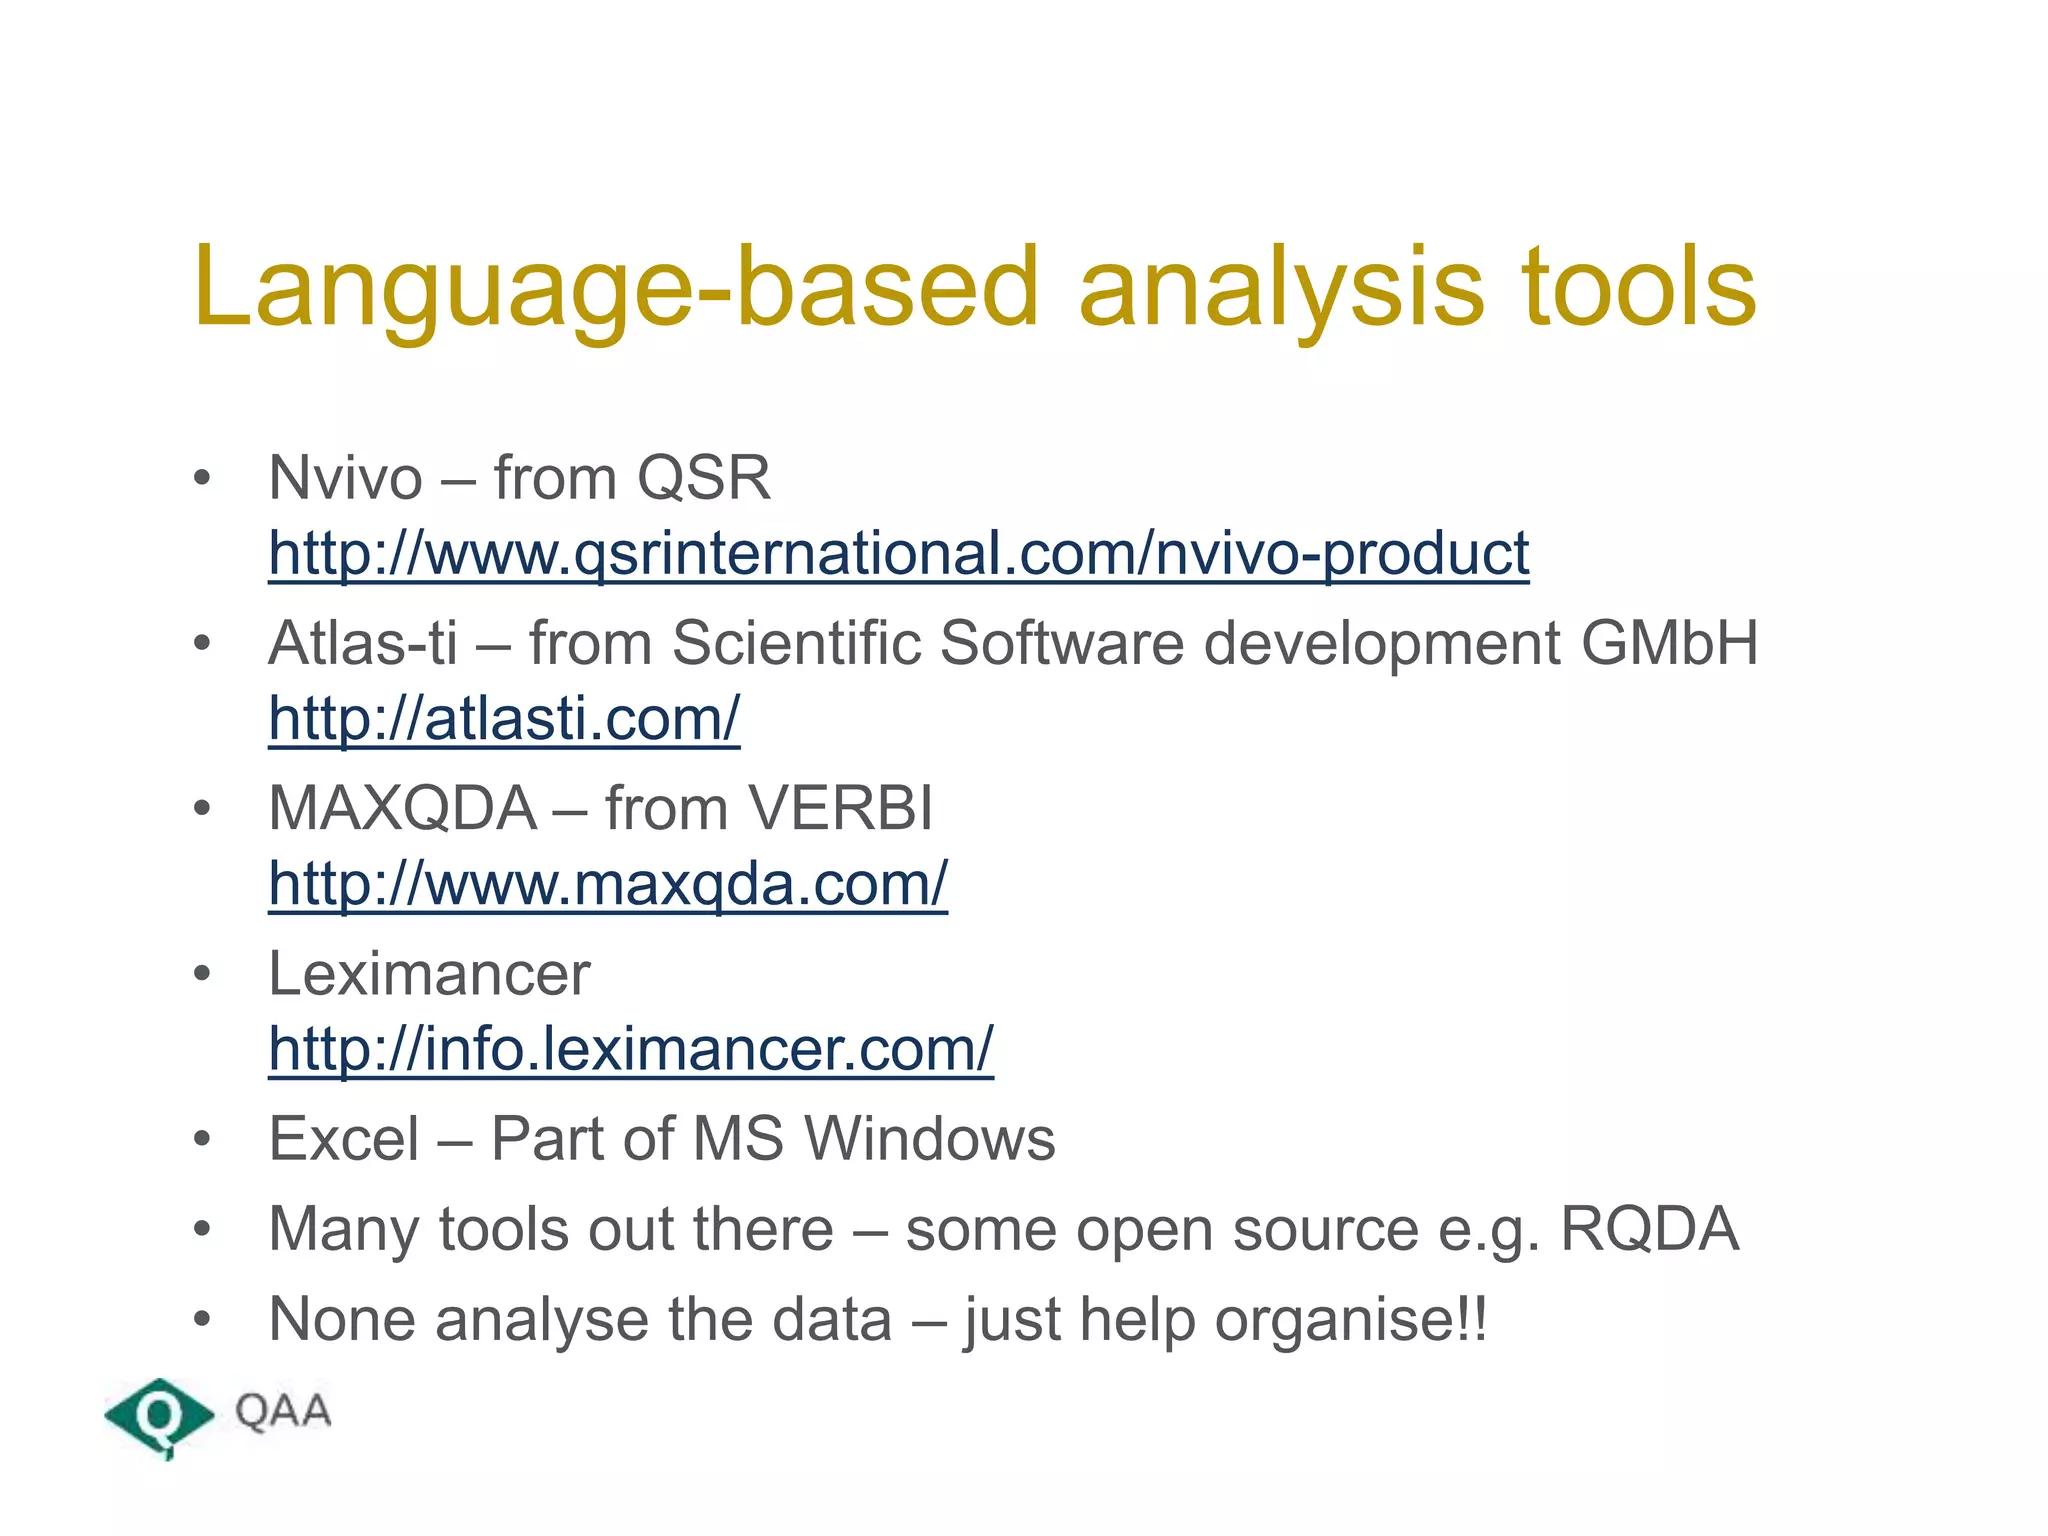

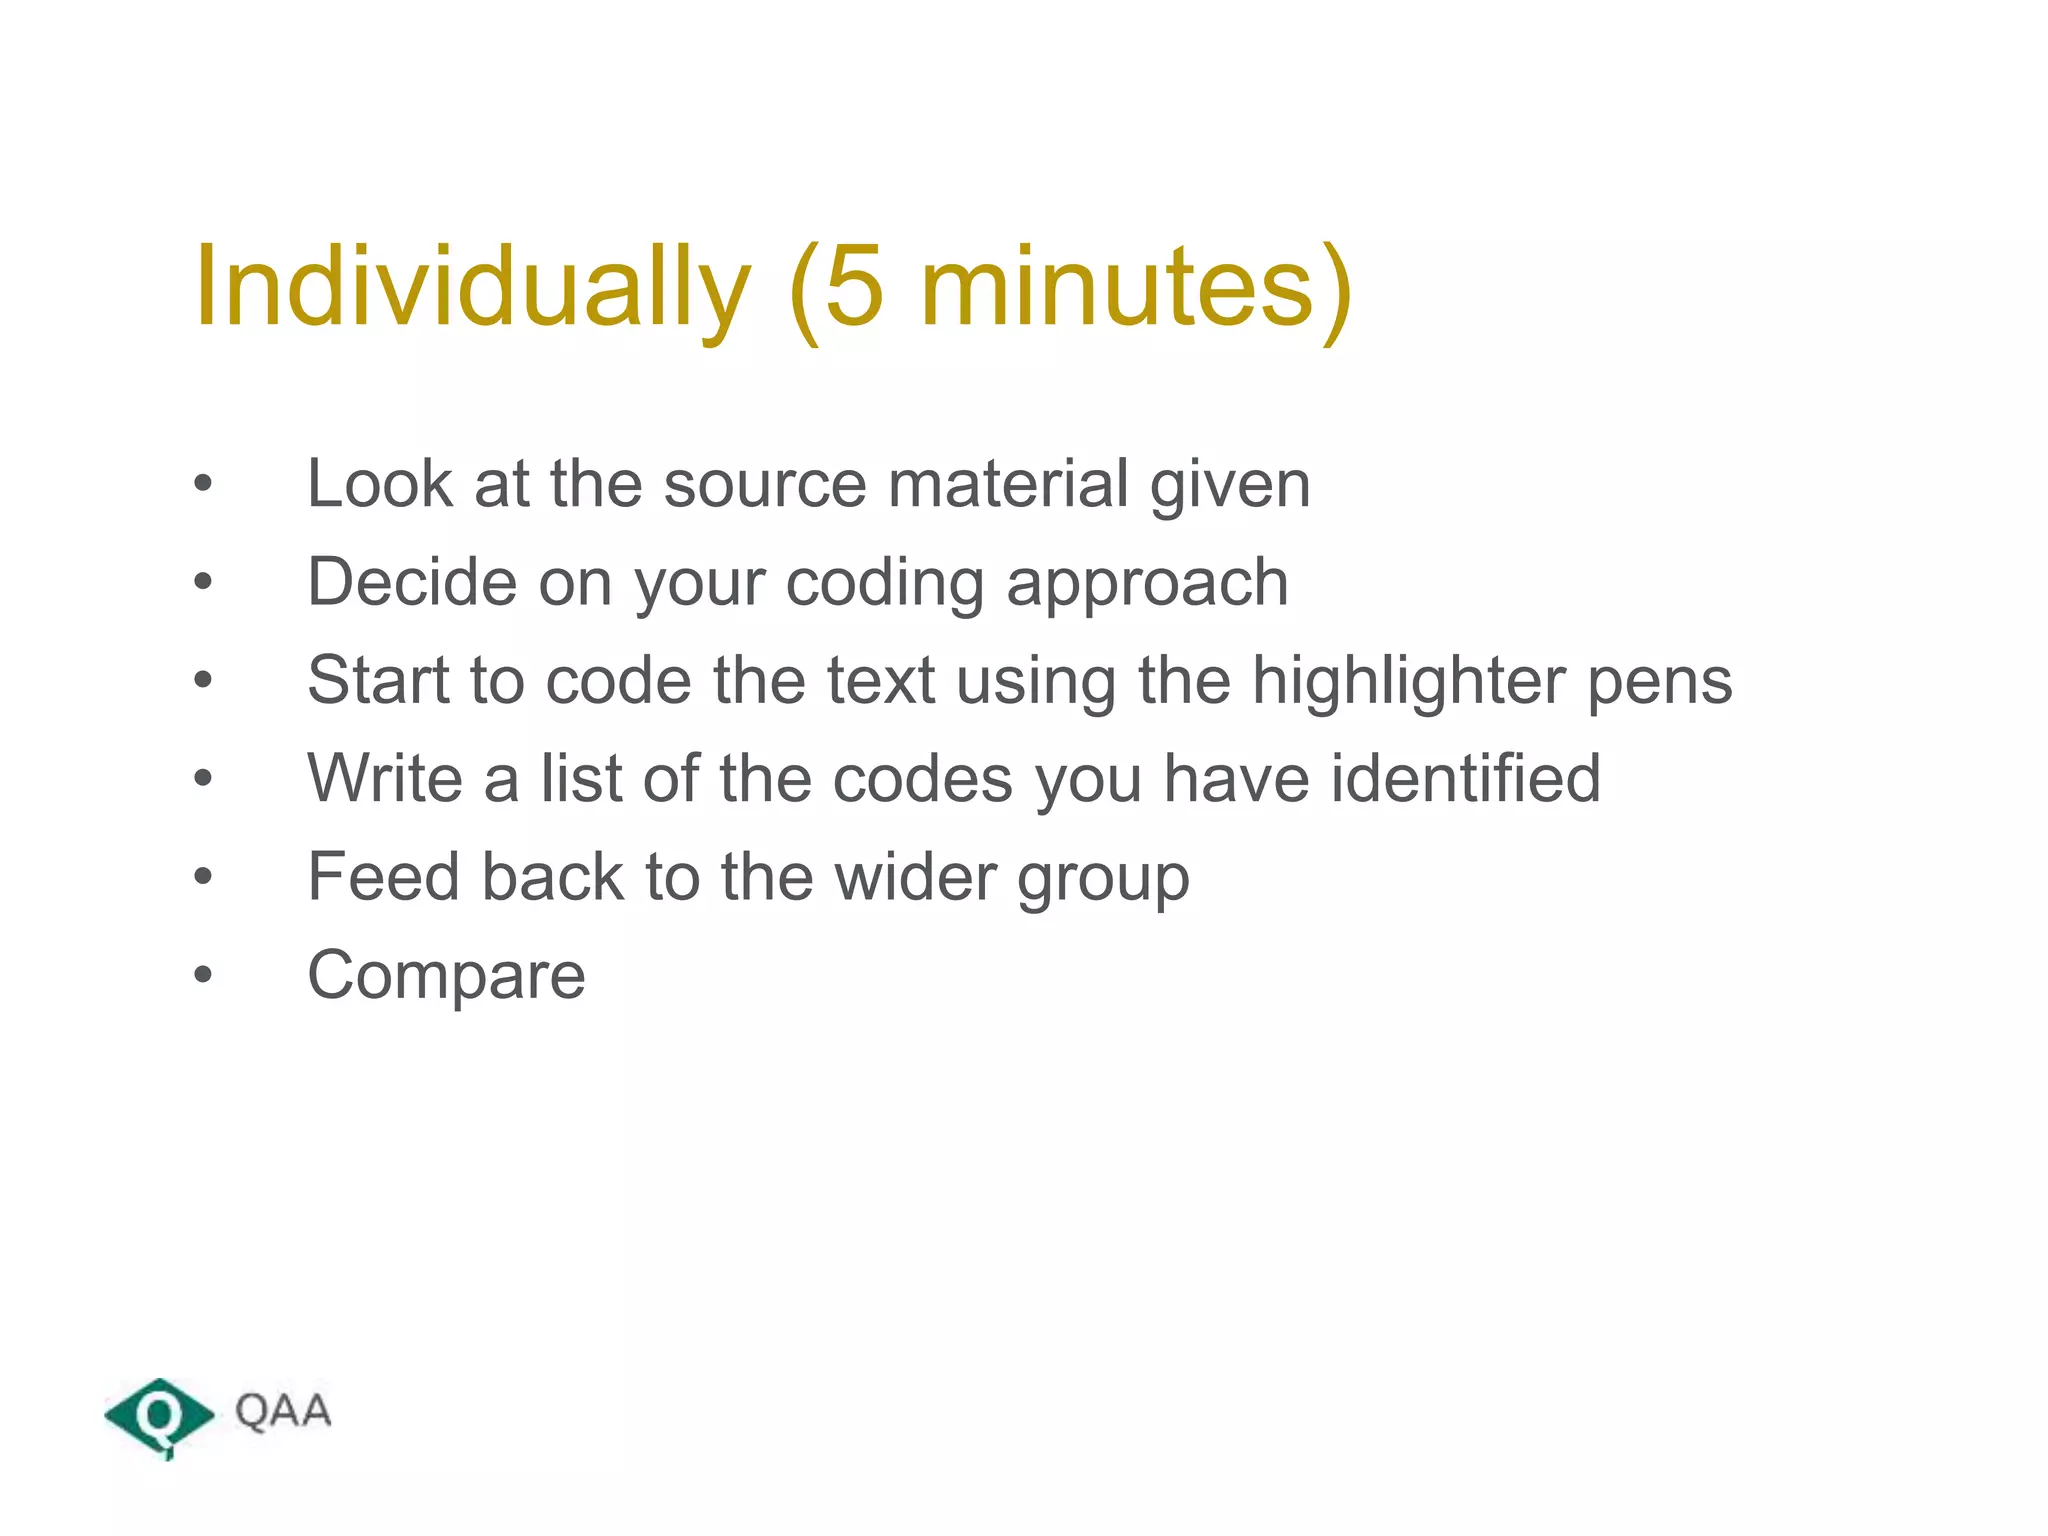
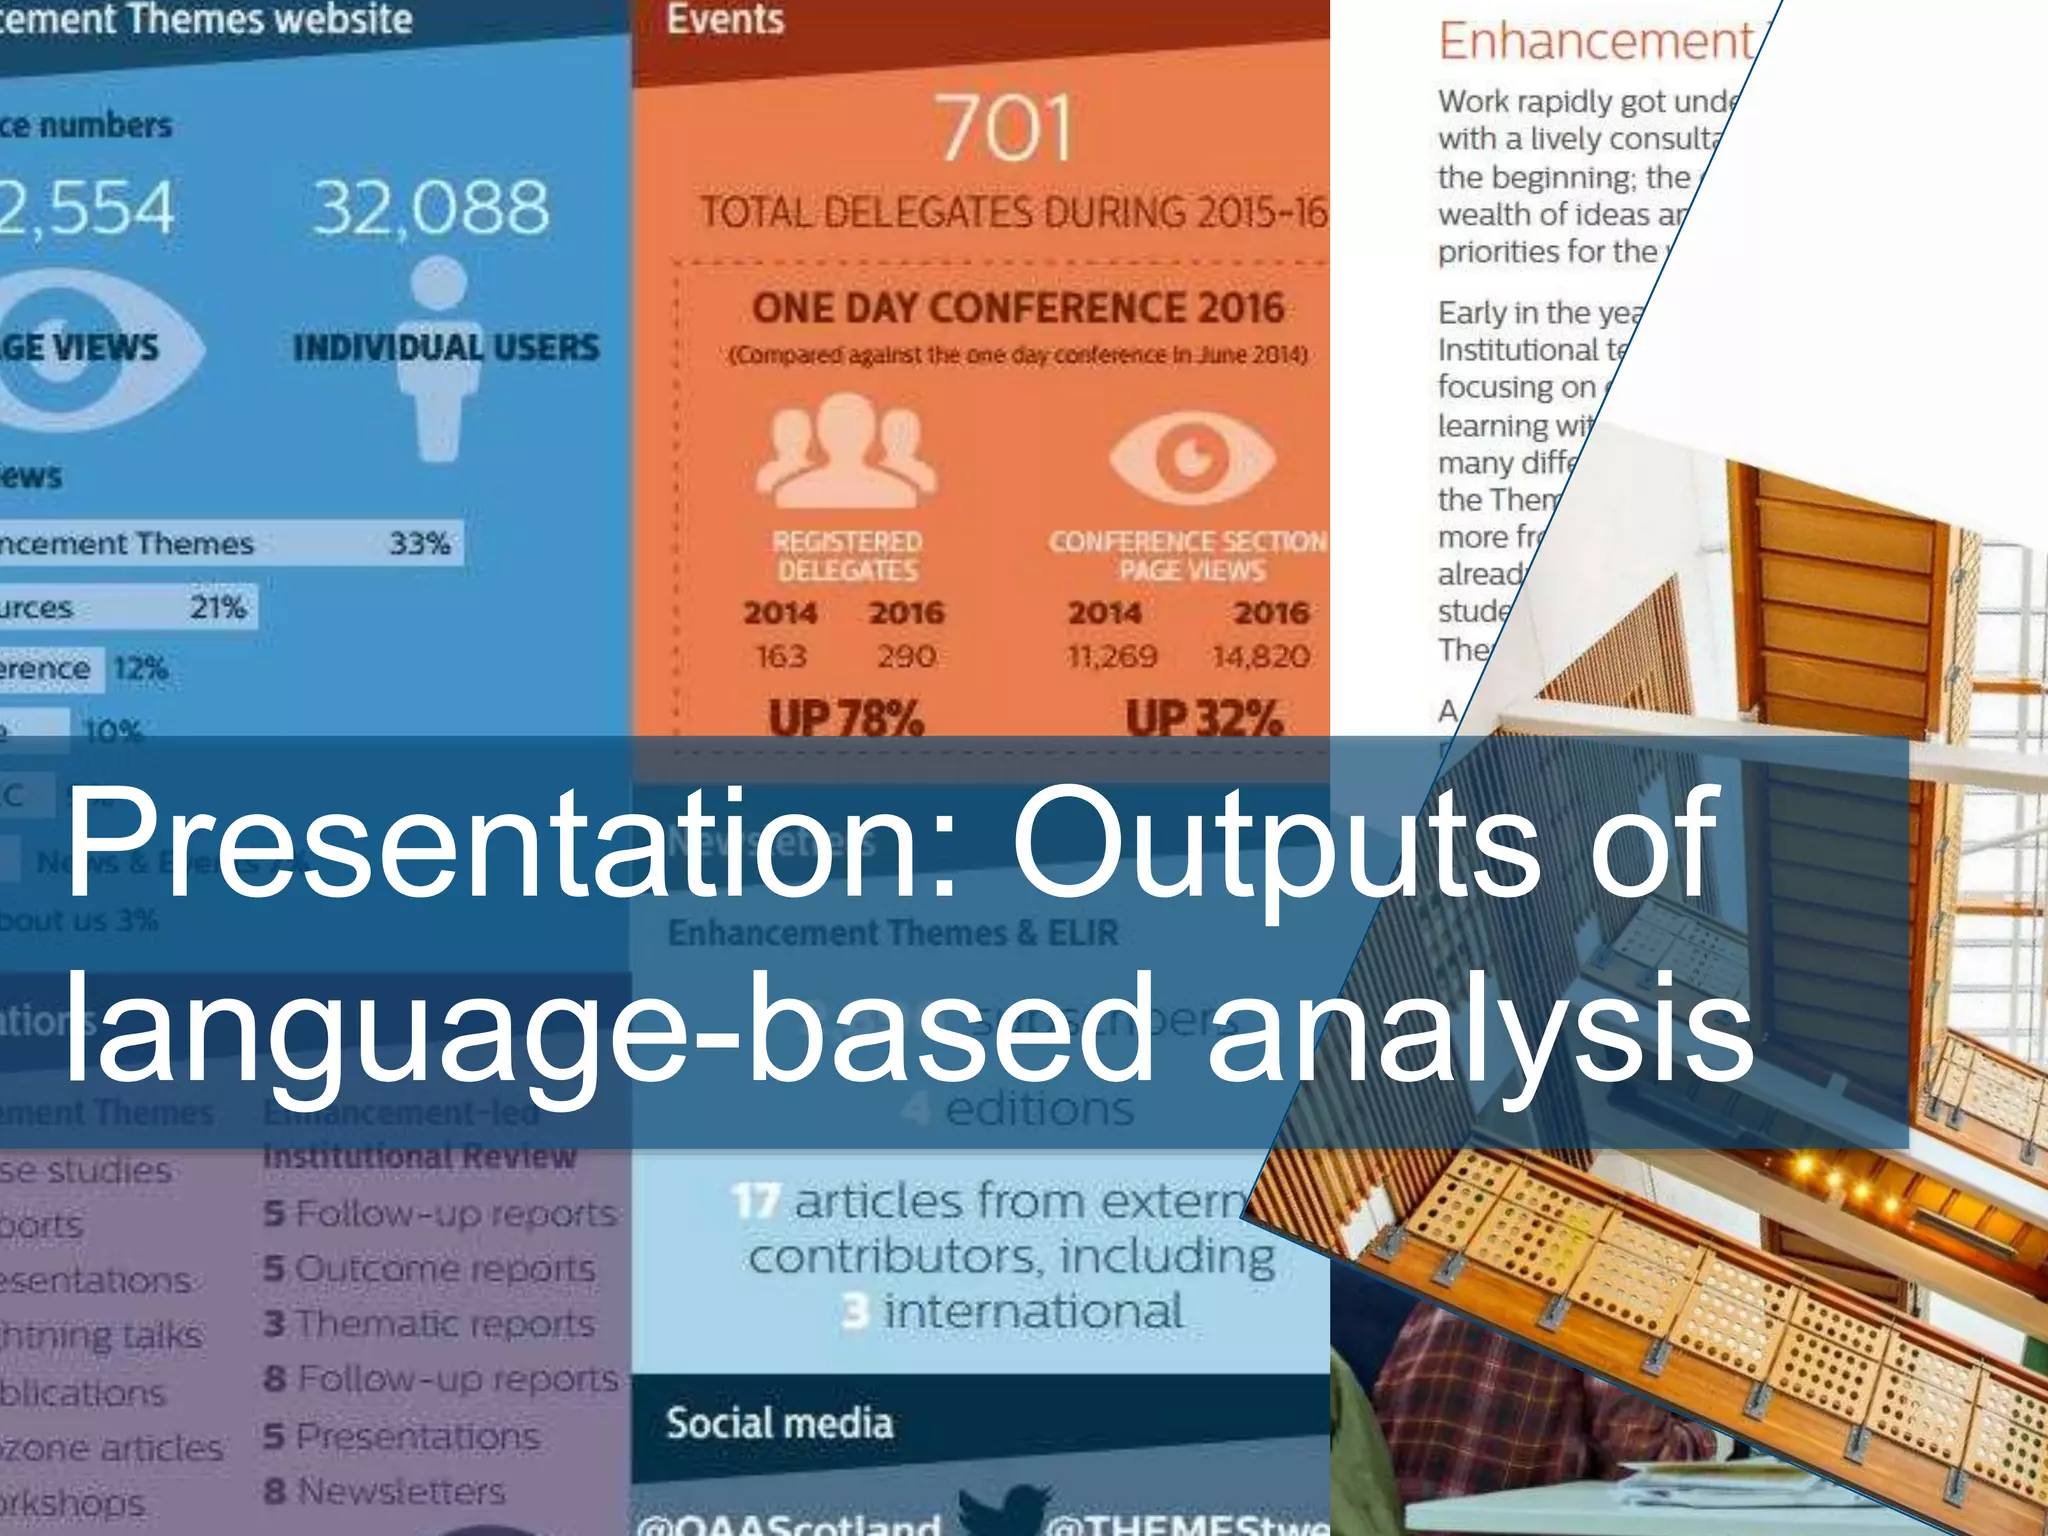
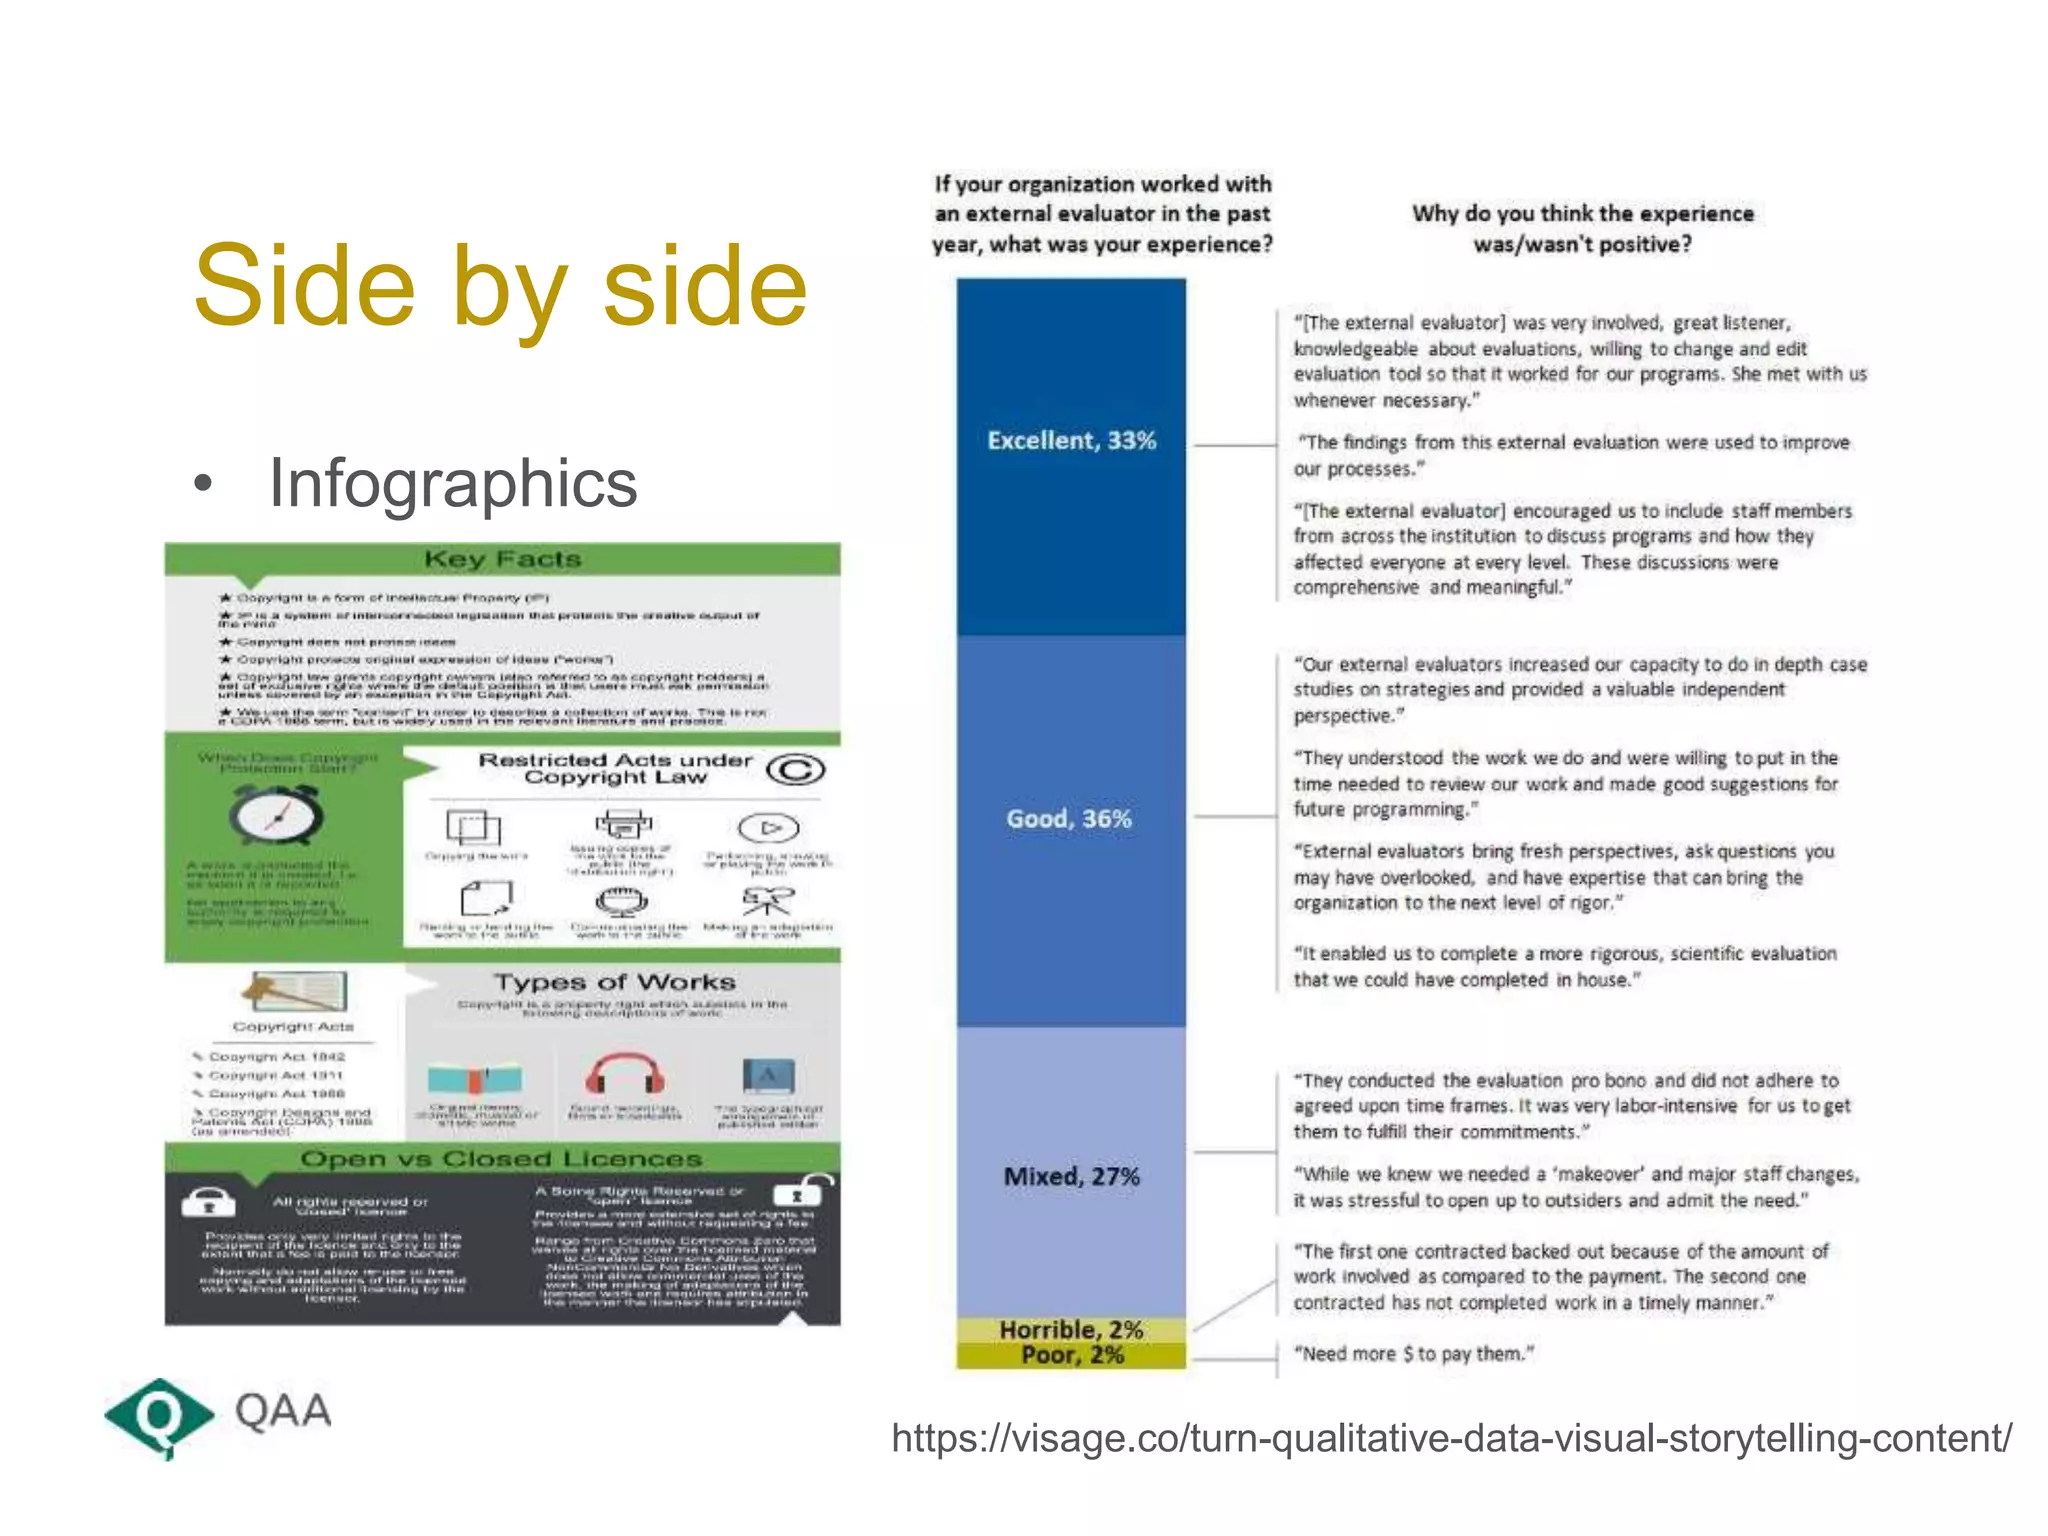

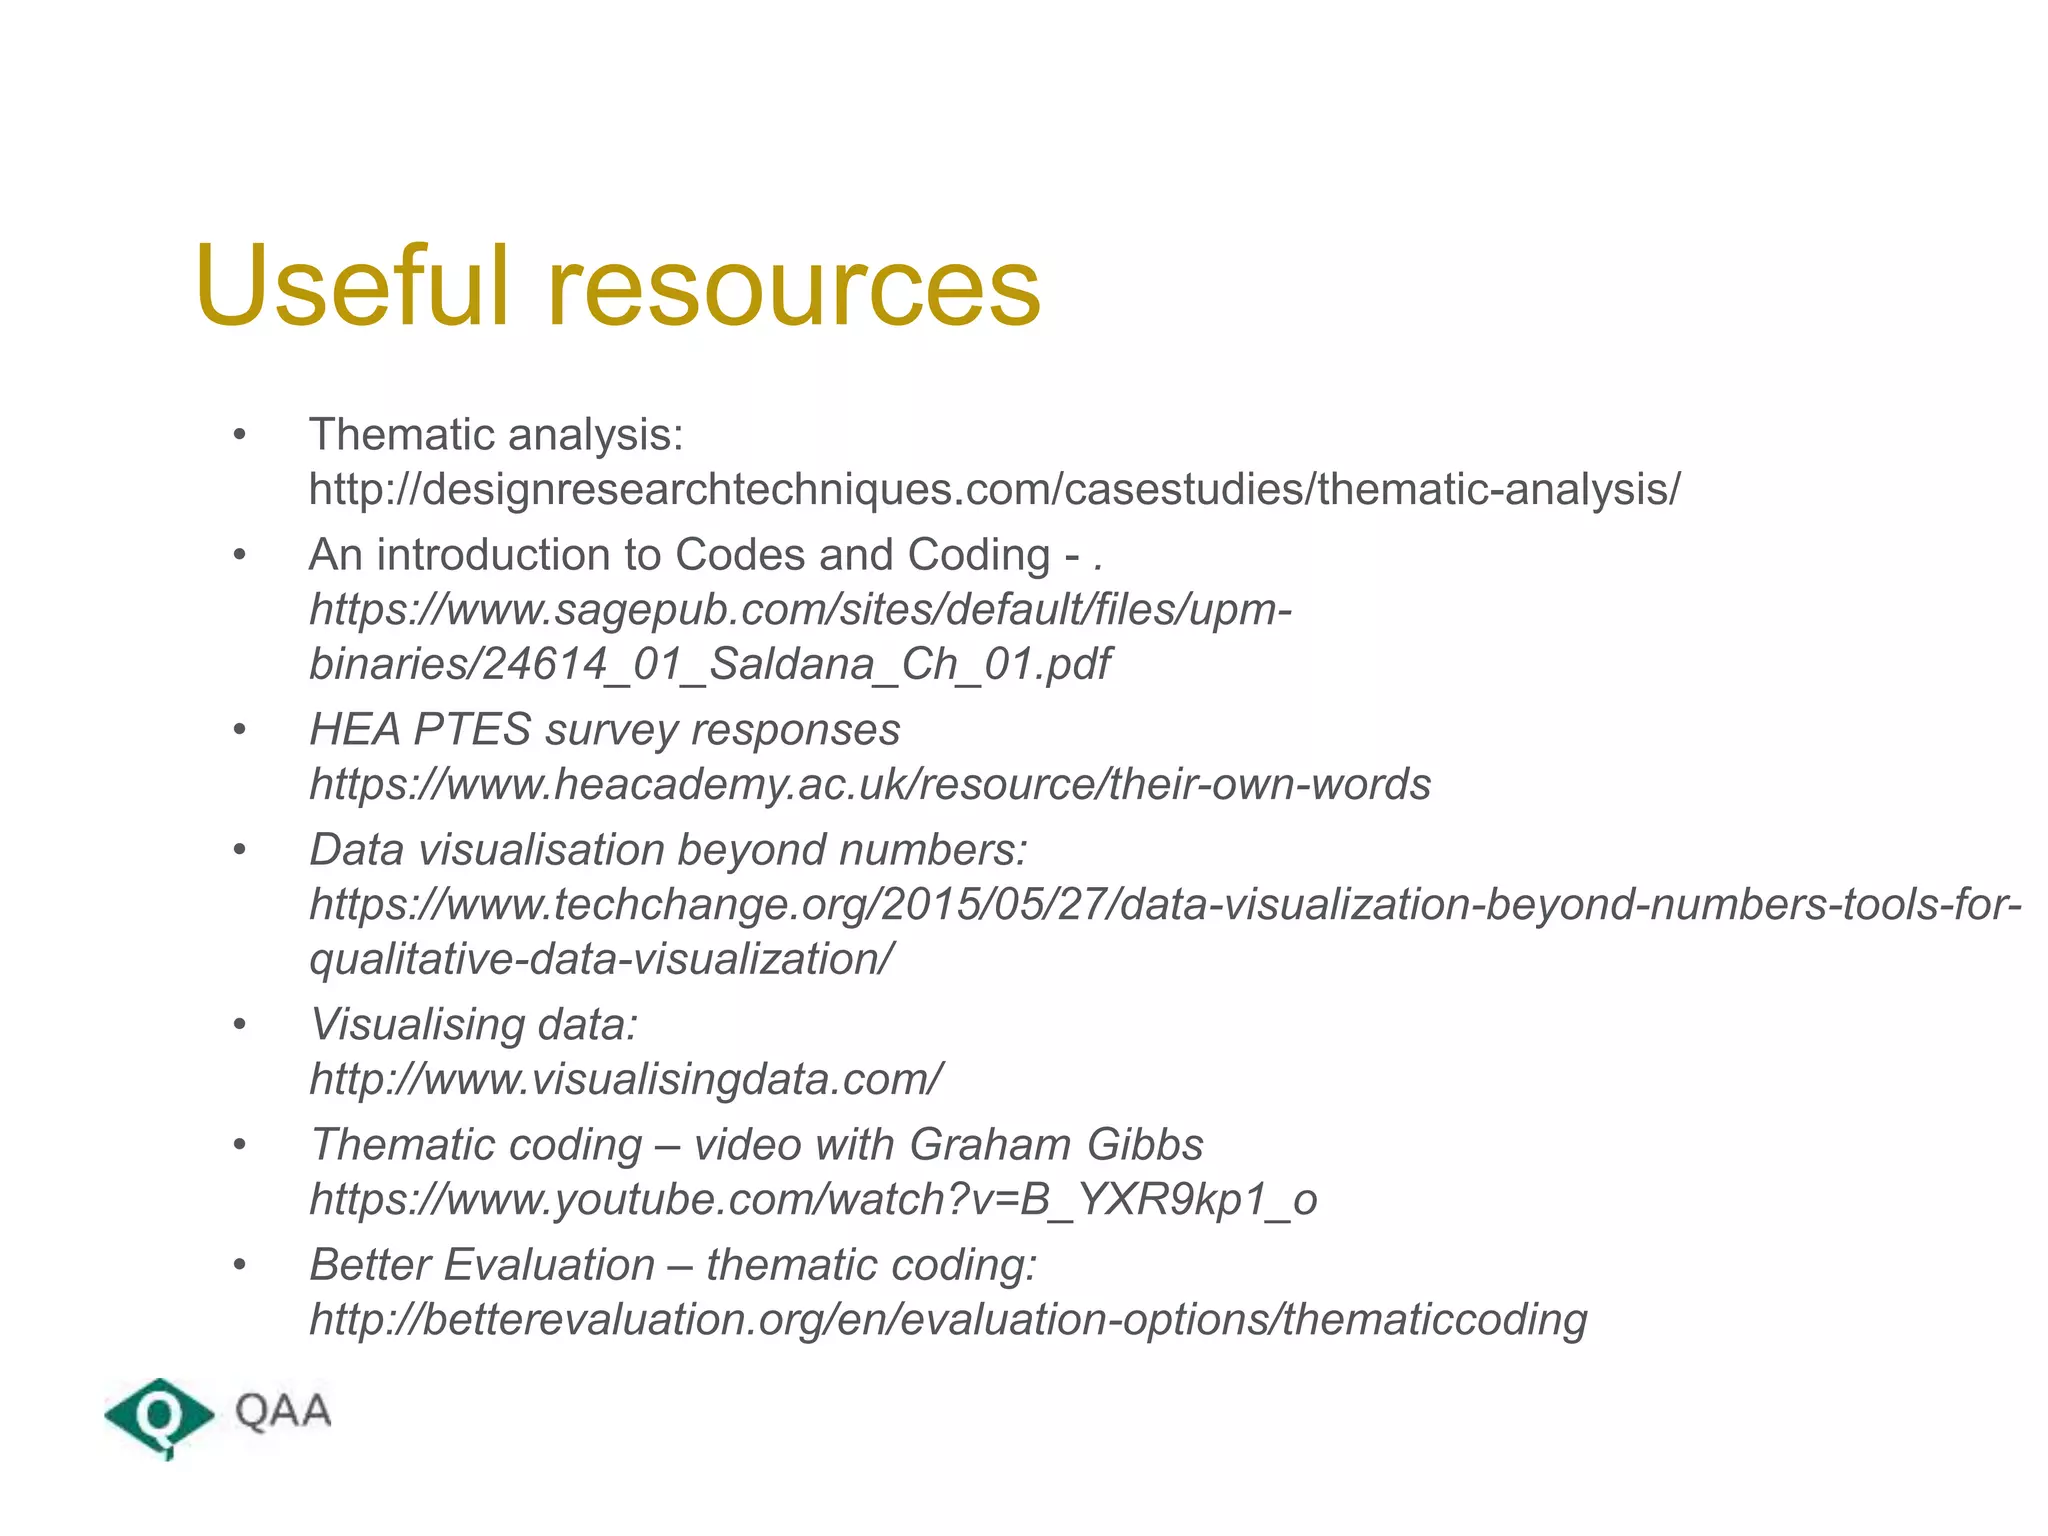


This document provides an overview of a presentation on trendspotting and making sense of large information sources. The presentation introduces qualitative data analysis and thematic coding. It discusses collecting and organizing qualitative data, identifying themes and patterns through coding, and presenting findings through reports, visualizations and infographics. Practical exercises are included to have participants analyze text data by identifying codes and themes in small groups. Resources on qualitative analysis techniques are also provided.