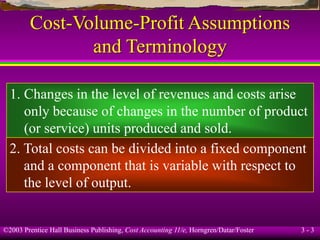
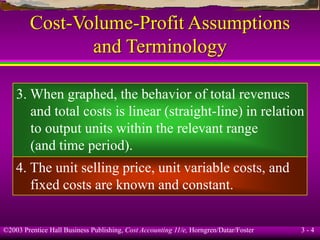
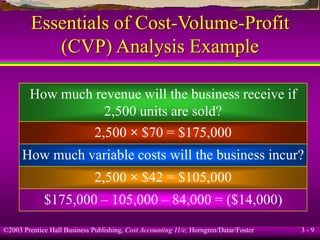
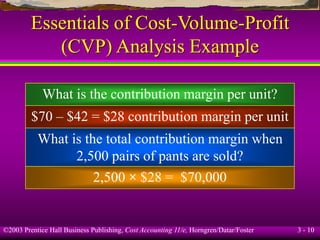
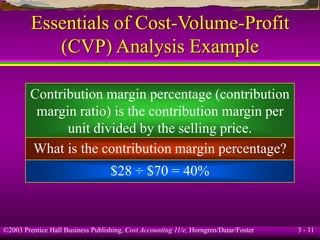
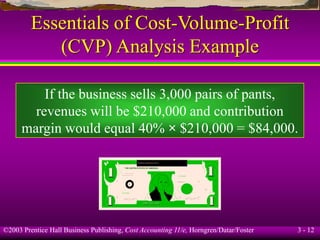
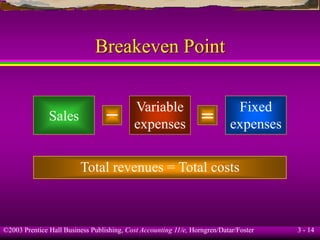
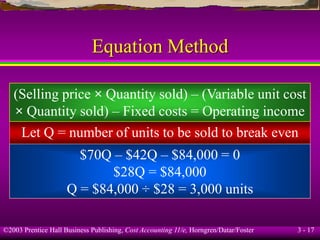
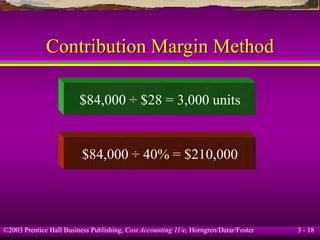
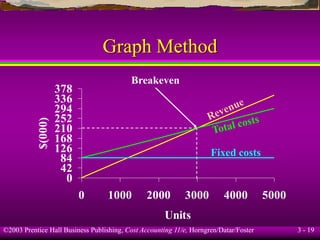
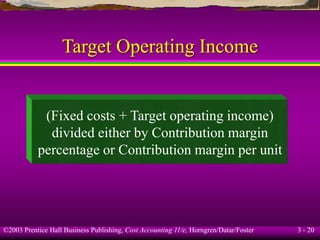
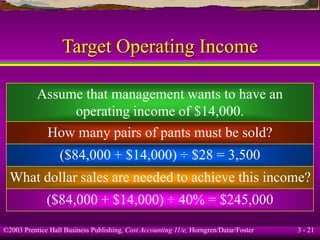
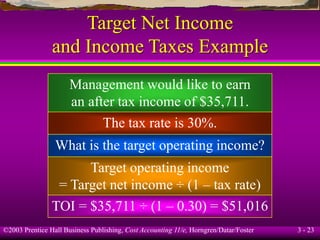
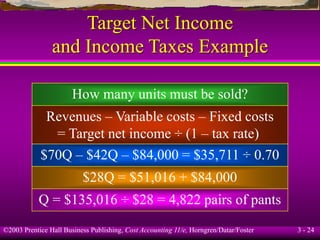
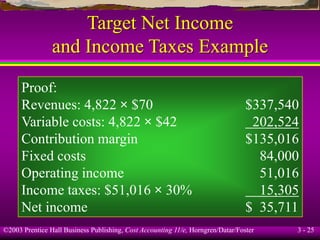
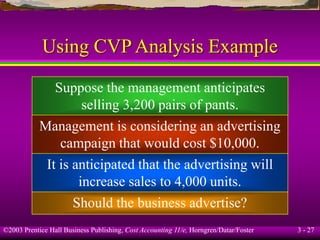
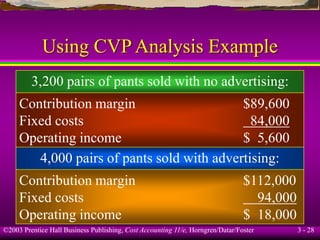
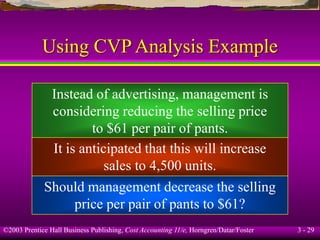
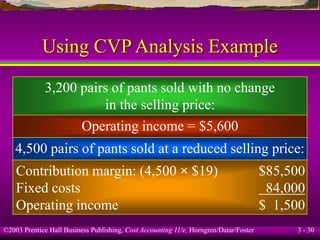
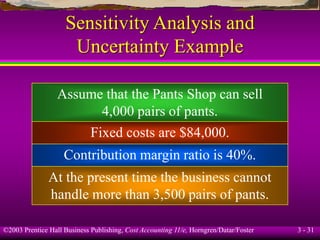
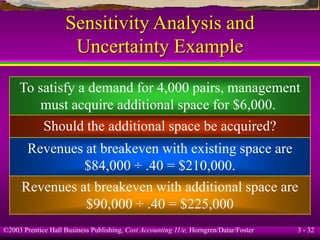
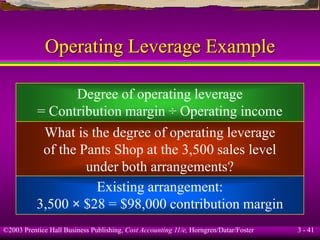
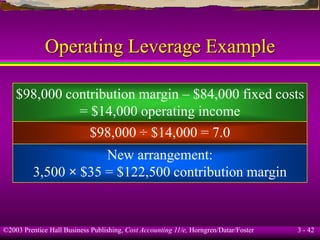
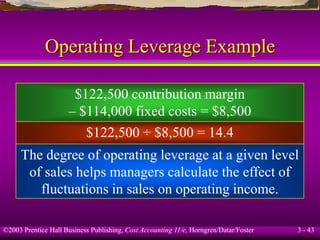
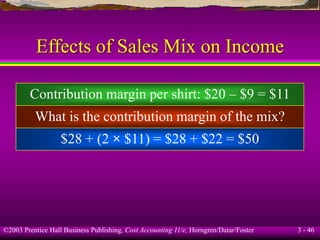
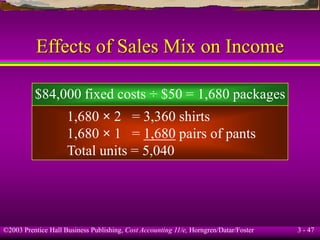
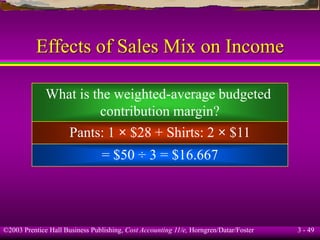
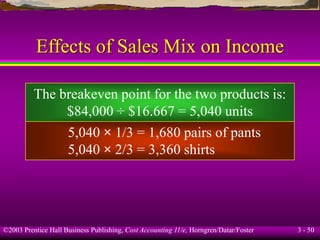
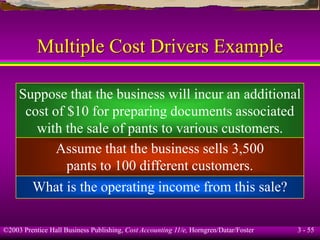
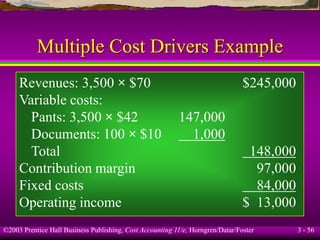
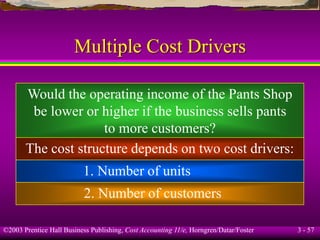
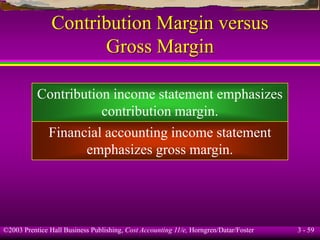
SlideShare a Scribd company logo
1 of 60
©2003 Prentice Hall Business Publishing, Cost Accounting 11/e, Horngren/Datar/Foster 3 - 1
Cost-Volume-Profit Analysis
Chapter 3
©2003 Prentice Hall Business Publishing, Cost Accounting 11/e, Horngren/Datar/Foster 3 - 2
Learning Objective 1
Understand the assumptions
underlying cost-volume-profit
(CVP) analysis.
©2003 Prentice Hall Business Publishing, Cost Accounting 11/e, Horngren/Datar/Foster 3 - 3
Cost-Volume-Profit Assumptions
and Terminology
1. Changes in the level of revenues and costs arise
only because of changes in the number of product
(or service) units produced and sold.
2. Total costs can be divided into a fixed component
and a component that is variable with respect to
the level of output.
©2003 Prentice Hall Business Publishing, Cost Accounting 11/e, Horngren/Datar/Foster 3 - 4
Cost-Volume-Profit Assumptions
and Terminology
3. When graphed, the behavior of total revenues
and total costs is linear (straight-line) in relation
to output units within the relevant range
(and time period).
4. The unit selling price, unit variable costs, and
fixed costs are known and constant.
©2003 Prentice Hall Business Publishing, Cost Accounting 11/e, Horngren/Datar/Foster 3 - 5
Cost-Volume-Profit Assumptions
and Terminology
5. The analysis either covers a single product or
assumes that the sales mix when multiple
products are sold will remain constant as the
level of total units sold changes.
6. All revenues and costs can be added and
compared without taking into account the time
value of money.
©2003 Prentice Hall Business Publishing, Cost Accounting 11/e, Horngren/Datar/Foster 3 - 6
Cost-Volume-Profit Assumptions
and Terminology
Operating income
= Total revenues from operations
– Cost of goods sold and operating costs
(excluding income taxes)
Net income = Operating income – Income taxes
©2003 Prentice Hall Business Publishing, Cost Accounting 11/e, Horngren/Datar/Foster 3 - 7
Learning Objective 2
Explain the features
of CVP analysis.
©2003 Prentice Hall Business Publishing, Cost Accounting 11/e, Horngren/Datar/Foster 3 - 8
Essentials of Cost-Volume-Profit
(CVP) Analysis Example
Assume that the Pants Shop can purchase pants
for $32 from a local factory; other variable costs
amount to $10 per unit.
The local factory allows the Pants Shop to
return all unsold pants and receive a full $32
refund per pair of pants within one year.
The average selling price per pair of pants is $70
and total fixed costs amount to $84,000.
©2003 Prentice Hall Business Publishing, Cost Accounting 11/e, Horngren/Datar/Foster 3 - 9
Essentials of Cost-Volume-Profit
(CVP) Analysis Example
How much revenue will the business receive if
2,500 units are sold?
2,500 × $70 = $175,000
How much variable costs will the business incur?
2,500 × $42 = $105,000
$175,000 – 105,000 – 84,000 = ($14,000)
©2003 Prentice Hall Business Publishing, Cost Accounting 11/e, Horngren/Datar/Foster 3 - 10
Essentials of Cost-Volume-Profit
(CVP) Analysis Example
What is the contribution margin per unit?
$70 – $42 = $28 contribution margin per unit
What is the total contribution margin when
2,500 pairs of pants are sold?
2,500 × $28 = $70,000
©2003 Prentice Hall Business Publishing, Cost Accounting 11/e, Horngren/Datar/Foster 3 - 11
Essentials of Cost-Volume-Profit
(CVP) Analysis Example
Contribution margin percentage (contribution
margin ratio) is the contribution margin per
unit divided by the selling price.
What is the contribution margin percentage?
$28 ÷ $70 = 40%
©2003 Prentice Hall Business Publishing, Cost Accounting 11/e, Horngren/Datar/Foster 3 - 12
Essentials of Cost-Volume-Profit
(CVP) Analysis Example
If the business sells 3,000 pairs of pants,
revenues will be $210,000 and contribution
margin would equal 40% × $210,000 = $84,000.
A
FEDERAL RESERVE NOTE
THE UNITED STATES OF AMERICA
L70744629F
12
12
12
12
L70744629F
ONE DOLLAR
ONE DOLLAR
W A SH IN G TO N, D .C.
TH I S N O TE IS L E G A L T E N D E R
F O R A L L D E B T S , P U B L I C A N D P R IV A T E
S E R I E S
1 9 8 5
H 293
©2003 Prentice Hall Business Publishing, Cost Accounting 11/e, Horngren/Datar/Foster 3 - 13
Learning Objective 3
Determine the breakeven point
and output level needed to achieve
a target operating income using
the equation, contribution margin,
and graph methods.
©2003 Prentice Hall Business Publishing, Cost Accounting 11/e, Horngren/Datar/Foster 3 - 14
Breakeven Point
Sales
Variable
expenses
Fixed
expenses
– =
Total revenues = Total costs
©2003 Prentice Hall Business Publishing, Cost Accounting 11/e, Horngren/Datar/Foster 3 - 15
Abbreviations
SP = Selling price
VCU = Variable cost per unit
CMU = Contribution margin per unit
CM% = Contribution margin percentage
FC = Fixed costs
©2003 Prentice Hall Business Publishing, Cost Accounting 11/e, Horngren/Datar/Foster 3 - 16
Abbreviations
Q = Quantity of output units sold
(and manufactured)
OI = Operating income
TOI = Target operating income
TNI = Target net income
©2003 Prentice Hall Business Publishing, Cost Accounting 11/e, Horngren/Datar/Foster 3 - 17
Equation Method
$70Q – $42Q – $84,000 = 0
$28Q = $84,000
Q = $84,000 ÷ $28 = 3,000 units
Let Q = number of units to be sold to break even
(Selling price × Quantity sold) – (Variable unit cost
× Quantity sold) – Fixed costs = Operating income
©2003 Prentice Hall Business Publishing, Cost Accounting 11/e, Horngren/Datar/Foster 3 - 18
Contribution Margin Method
$84,000 ÷ $28 = 3,000 units
$84,000 ÷ 40% = $210,000
©2003 Prentice Hall Business Publishing, Cost Accounting 11/e, Horngren/Datar/Foster 3 - 19
Graph Method
0
42
84
126
168
210
252
294
336
378
0 1000 2000 3000 4000 5000
Units
$(000)
Breakeven
Fixed costs
©2003 Prentice Hall Business Publishing, Cost Accounting 11/e, Horngren/Datar/Foster 3 - 20
Target Operating Income
(Fixed costs + Target operating income)
divided either by Contribution margin
percentage or Contribution margin per unit
©2003 Prentice Hall Business Publishing, Cost Accounting 11/e, Horngren/Datar/Foster 3 - 21
Target Operating Income
Assume that management wants to have an
operating income of $14,000.
How many pairs of pants must be sold?
($84,000 + $14,000) ÷ $28 = 3,500
What dollar sales are needed to achieve this income?
($84,000 + $14,000) ÷ 40% = $245,000
©2003 Prentice Hall Business Publishing, Cost Accounting 11/e, Horngren/Datar/Foster 3 - 22
Learning Objective 4
Understand how income
taxes affect CVP analysis.
©2003 Prentice Hall Business Publishing, Cost Accounting 11/e, Horngren/Datar/Foster 3 - 23
Target Net Income
and Income Taxes Example
Management would like to earn
an after tax income of $35,711.
The tax rate is 30%.
What is the target operating income?
Target operating income
= Target net income ÷ (1 – tax rate)
TOI = $35,711 ÷ (1 – 0.30) = $51,016
©2003 Prentice Hall Business Publishing, Cost Accounting 11/e, Horngren/Datar/Foster 3 - 24
Target Net Income
and Income Taxes Example
How many units must be sold?
Revenues – Variable costs – Fixed costs
= Target net income ÷ (1 – tax rate)
$70Q – $42Q – $84,000 = $35,711 ÷ 0.70
$28Q = $51,016 + $84,000
Q = $135,016 ÷ $28 = 4,822 pairs of pants
©2003 Prentice Hall Business Publishing, Cost Accounting 11/e, Horngren/Datar/Foster 3 - 25
Target Net Income
and Income Taxes Example
Proof:
Revenues: 4,822 × $70 $337,540
Variable costs: 4,822 × $42 202,524
Contribution margin $135,016
Fixed costs 84,000
Operating income 51,016
Income taxes: $51,016 × 30% 15,305
Net income $ 35,711
©2003 Prentice Hall Business Publishing, Cost Accounting 11/e, Horngren/Datar/Foster 3 - 26
Learning Objective 5
Explain CVP analysis
in decision making and
how sensitivity analysis helps
managers cope with uncertainty.
©2003 Prentice Hall Business Publishing, Cost Accounting 11/e, Horngren/Datar/Foster 3 - 27
Using CVP Analysis Example
Suppose the management anticipates
selling 3,200 pairs of pants.
Management is considering an advertising
campaign that would cost $10,000.
It is anticipated that the advertising will
increase sales to 4,000 units.
Should the business advertise?
©2003 Prentice Hall Business Publishing, Cost Accounting 11/e, Horngren/Datar/Foster 3 - 28
Using CVP Analysis Example
3,200 pairs of pants sold with no advertising:
Contribution margin $89,600
Fixed costs 84,000
Operating income $ 5,600
4,000 pairs of pants sold with advertising:
Contribution margin $112,000
Fixed costs 94,000
Operating income $ 18,000
©2003 Prentice Hall Business Publishing, Cost Accounting 11/e, Horngren/Datar/Foster 3 - 29
Using CVP Analysis Example
Instead of advertising, management is
considering reducing the selling price
to $61 per pair of pants.
It is anticipated that this will increase
sales to 4,500 units.
Should management decrease the selling
price per pair of pants to $61?
©2003 Prentice Hall Business Publishing, Cost Accounting 11/e, Horngren/Datar/Foster 3 - 30
Using CVP Analysis Example
3,200 pairs of pants sold with no change
in the selling price:
Operating income = $5,600
4,500 pairs of pants sold at a reduced selling price:
Contribution margin: (4,500 × $19) $85,500
Fixed costs 84,000
Operating income $ 1,500
©2003 Prentice Hall Business Publishing, Cost Accounting 11/e, Horngren/Datar/Foster 3 - 31
Sensitivity Analysis and
Uncertainty Example
Assume that the Pants Shop can sell
4,000 pairs of pants.
Fixed costs are $84,000.
Contribution margin ratio is 40%.
At the present time the business cannot
handle more than 3,500 pairs of pants.
©2003 Prentice Hall Business Publishing, Cost Accounting 11/e, Horngren/Datar/Foster 3 - 32
Sensitivity Analysis and
Uncertainty Example
To satisfy a demand for 4,000 pairs, management
must acquire additional space for $6,000.
Should the additional space be acquired?
Revenues at breakeven with existing space are
$84,000 ÷ .40 = $210,000.
Revenues at breakeven with additional space are
$90,000 ÷ .40 = $225,000
©2003 Prentice Hall Business Publishing, Cost Accounting 11/e, Horngren/Datar/Foster 3 - 33
Sensitivity Analysis and
Uncertainty Example
Operating income at $245,000 revenues with
existing space = ($245,000 × .40)
– $84,000 = $14,000.
(3,500 pairs of pants × $28) – $84,000 = $14,000
©2003 Prentice Hall Business Publishing, Cost Accounting 11/e, Horngren/Datar/Foster 3 - 34
Sensitivity Analysis and
Uncertainty Example
Operating income at $280,000 revenues with
additional space = ($280,000 × .40) – $90,000
= $22,000.
(4,000 pairs of pants × $28 contribution margin)
– $90,000 = $22,000
©2003 Prentice Hall Business Publishing, Cost Accounting 11/e, Horngren/Datar/Foster 3 - 35
Learning Objective 6
Use CVP analysis to plan
fixed and variable costs.
©2003 Prentice Hall Business Publishing, Cost Accounting 11/e, Horngren/Datar/Foster 3 - 36
Alternative Fixed/Variable Cost
Structures Example
What is the new contribution margin?
Decrease the price they charge from $32 to $25 and
charge an annual administrative fee of $30,000.
Suppose that the factory the Pants Shop is using to
obtain the merchandise offers the following:
©2003 Prentice Hall Business Publishing, Cost Accounting 11/e, Horngren/Datar/Foster 3 - 37
Alternative Fixed/Variable Cost
Structures Example
$70 – ($25 + $10) = $35
Contribution margin increases from $28 to $35.
What is the contribution margin percentage?
$35 ÷ $70 = 50%
What are the new fixed costs?
$84,000 + $30,000 = $114,000
©2003 Prentice Hall Business Publishing, Cost Accounting 11/e, Horngren/Datar/Foster 3 - 38
Alternative Fixed/Variable Cost
Structures Example
Management questions what sales volume
would yield an identical operating income
regardless of the arrangement.
28x – 84,000 = 35x – 114,000
114,000 – 84,000 = 35x – 28x
7x = 30,000
x = 4,286 pairs of pants
©2003 Prentice Hall Business Publishing, Cost Accounting 11/e, Horngren/Datar/Foster 3 - 39
Alternative Fixed/Variable Cost
Structures Example
Cost with existing arrangement
= Cost with new arrangement
.60x + 84,000 = .50x + 114,000
.10x = $30,000  x = $300,000
($300,000 × .40) – $ 84,000 = $36,000
($300,000 × .50) – $114,000 = $36,000
©2003 Prentice Hall Business Publishing, Cost Accounting 11/e, Horngren/Datar/Foster 3 - 40
Operating Leverage
Operating leverage describes the effects that
fixed costs have on changes in operating
income as changes occur in units sold.
Organizations with a high proportion of fixed
costs have high operating leverage.
©2003 Prentice Hall Business Publishing, Cost Accounting 11/e, Horngren/Datar/Foster 3 - 41
Operating Leverage Example
Degree of operating leverage
= Contribution margin ÷ Operating income
What is the degree of operating leverage
of the Pants Shop at the 3,500 sales level
under both arrangements?
Existing arrangement:
3,500 × $28 = $98,000 contribution margin
©2003 Prentice Hall Business Publishing, Cost Accounting 11/e, Horngren/Datar/Foster 3 - 42
Operating Leverage Example
$98,000 contribution margin – $84,000 fixed costs
= $14,000 operating income
$98,000 ÷ $14,000 = 7.0
New arrangement:
3,500 × $35 = $122,500 contribution margin
©2003 Prentice Hall Business Publishing, Cost Accounting 11/e, Horngren/Datar/Foster 3 - 43
Operating Leverage Example
$122,500 contribution margin
– $114,000 fixed costs = $8,500
$122,500 ÷ $8,500 = 14.4
The degree of operating leverage at a given level
of sales helps managers calculate the effect of
fluctuations in sales on operating income.
©2003 Prentice Hall Business Publishing, Cost Accounting 11/e, Horngren/Datar/Foster 3 - 44
Learning Objective 7
Apply CVP analysis to a company
producing different products.
©2003 Prentice Hall Business Publishing, Cost Accounting 11/e, Horngren/Datar/Foster 3 - 45
Effects of Sales Mix on Income
Pants Shop Example
Management expects to sell 2 shirts at $20 each
for every pair of pants it sells.
This will not require any additional fixed costs.
©2003 Prentice Hall Business Publishing, Cost Accounting 11/e, Horngren/Datar/Foster 3 - 46
Effects of Sales Mix on Income
What is the contribution margin of the mix?
Contribution margin per shirt: $20 – $9 = $11
$28 + (2 × $11) = $28 + $22 = $50
©2003 Prentice Hall Business Publishing, Cost Accounting 11/e, Horngren/Datar/Foster 3 - 47
Effects of Sales Mix on Income
$84,000 fixed costs ÷ $50 = 1,680 packages
1,680 × 2 = 3,360 shirts
1,680 × 1 = 1,680 pairs of pants
Total units = 5,040
©2003 Prentice Hall Business Publishing, Cost Accounting 11/e, Horngren/Datar/Foster 3 - 48
Effects of Sales Mix on Income
What is the breakeven in dollars?
3,360 shirts × $20 = $ 67,200
1,680 pairs of pants × $70 = 117,600
$184,800
©2003 Prentice Hall Business Publishing, Cost Accounting 11/e, Horngren/Datar/Foster 3 - 49
Effects of Sales Mix on Income
What is the weighted-average budgeted
contribution margin?
Pants: 1 × $28 + Shirts: 2 × $11
= $50 ÷ 3 = $16.667
©2003 Prentice Hall Business Publishing, Cost Accounting 11/e, Horngren/Datar/Foster 3 - 50
Effects of Sales Mix on Income
The breakeven point for the two products is:
$84,000 ÷ $16.667 = 5,040 units
5,040 × 1/3 = 1,680 pairs of pants
5,040 × 2/3 = 3,360 shirts
©2003 Prentice Hall Business Publishing, Cost Accounting 11/e, Horngren/Datar/Foster 3 - 51
Effects of Sales Mix on Income
Sales mix can be stated in sales dollars:
Pants Shirts
Sales price $70 $40
Variable costs 42 18
Contribution margin $28 $22
Contribution margin ratio 40% 55%
©2003 Prentice Hall Business Publishing, Cost Accounting 11/e, Horngren/Datar/Foster 3 - 52
Effects of Sales Mix on Income
Assume the sales mix in dollars
is 63.6% pants and 36.4% shirts.
Weighted contribution would be:
40% × 63.6% = 25.44% pants
55% × 36.4% = 20.02% shirts
45.46%
©2003 Prentice Hall Business Publishing, Cost Accounting 11/e, Horngren/Datar/Foster 3 - 53
Effects of Sales Mix on Income
Breakeven sales dollars is $84,000
÷ 45.46% = $184,778 (rounding).
$184,778 × 63.6% = $117,519 pants sales
$184,778 × 36.4% = $ 67,259 shirt sales
©2003 Prentice Hall Business Publishing, Cost Accounting 11/e, Horngren/Datar/Foster 3 - 54
Learning Objective 8
Adapt CVP analysis to situations
in which a product has more
than one cost driver.
©2003 Prentice Hall Business Publishing, Cost Accounting 11/e, Horngren/Datar/Foster 3 - 55
Multiple Cost Drivers Example
Suppose that the business will incur an additional
cost of $10 for preparing documents associated
with the sale of pants to various customers.
Assume that the business sells 3,500
pants to 100 different customers.
What is the operating income from this sale?
©2003 Prentice Hall Business Publishing, Cost Accounting 11/e, Horngren/Datar/Foster 3 - 56
Multiple Cost Drivers Example
Revenues: 3,500 × $70 $245,000
Variable costs:
Pants: 3,500 × $42 147,000
Documents: 100 × $10 1,000
Total 148,000
Contribution margin 97,000
Fixed costs 84,000
Operating income $ 13,000
©2003 Prentice Hall Business Publishing, Cost Accounting 11/e, Horngren/Datar/Foster 3 - 57
Multiple Cost Drivers
Would the operating income of the Pants Shop
be lower or higher if the business sells pants
to more customers?
The cost structure depends on two cost drivers:
1. Number of units
2. Number of customers
©2003 Prentice Hall Business Publishing, Cost Accounting 11/e, Horngren/Datar/Foster 3 - 58
Learning Objective 9
Distinguish between
contribution margin
and gross margin.
©2003 Prentice Hall Business Publishing, Cost Accounting 11/e, Horngren/Datar/Foster 3 - 59
Contribution Margin versus
Gross Margin
Contribution income statement emphasizes
contribution margin.
Financial accounting income statement
emphasizes gross margin.
©2003 Prentice Hall Business Publishing, Cost Accounting 11/e, Horngren/Datar/Foster 3 - 60
End of Chapter 3

More Related Content

Similar to Cost volume Profile analysis PowerPoint presentation

Similar to Cost volume Profile analysis PowerPoint presentation (20)

11ch17
11ch1711ch17
11ch17
 
11ch16
11ch1611ch16
11ch16
 
11ch16
11ch1611ch16
11ch16
 
Cost volume-profit analysis
Cost volume-profit analysisCost volume-profit analysis
Cost volume-profit analysis
 
11ch02.ppt
11ch02.ppt11ch02.ppt
11ch02.ppt
 
11ch11
11ch1111ch11
11ch11
 
cost12eppt_03.ppt
cost12eppt_03.pptcost12eppt_03.ppt
cost12eppt_03.ppt
 
3 Cost-Volume Profit CVP.ppt
3 Cost-Volume Profit CVP.ppt3 Cost-Volume Profit CVP.ppt
3 Cost-Volume Profit CVP.ppt
 
Costs of Production
Costs of ProductionCosts of Production
Costs of Production
 
yrtyt
yrtytyrtyt
yrtyt
 
17a marginal costing & breakeven analysis
17a marginal costing & breakeven analysis17a marginal costing & breakeven analysis
17a marginal costing & breakeven analysis
 
Break Even Analysis
Break Even AnalysisBreak Even Analysis
Break Even Analysis
 
Chemical process economics
Chemical process economicsChemical process economics
Chemical process economics
 
11ch22
11ch2211ch22
11ch22
 
Managerial_economics (3).docx
Managerial_economics (3).docxManagerial_economics (3).docx
Managerial_economics (3).docx
 
11ch22.ppt
11ch22.ppt11ch22.ppt
11ch22.ppt
 
L6 marginal & absorption costing
L6 marginal & absorption costingL6 marginal & absorption costing
L6 marginal & absorption costing
 
Break – even recap
Break – even recap Break – even recap
Break – even recap
 
11ch21.ppt
11ch21.ppt11ch21.ppt
11ch21.ppt
 
Cost-Volume-Profit Analysis.ppt
Cost-Volume-Profit Analysis.pptCost-Volume-Profit Analysis.ppt
Cost-Volume-Profit Analysis.ppt
 

Recently uploaded

BEST Call Girls In Greater Noida ✨ 9773824855 ✨ Escorts Service In Delhi Ncr,
BEST Call Girls In Greater Noida ✨ 9773824855 ✨ Escorts Service In Delhi Ncr,BEST Call Girls In Greater Noida ✨ 9773824855 ✨ Escorts Service In Delhi Ncr,
BEST Call Girls In Greater Noida ✨ 9773824855 ✨ Escorts Service In Delhi Ncr,noida100girls
 
Global Scenario On Sustainable and Resilient Coconut Industry by Dr. Jelfina...
Global Scenario On Sustainable  and Resilient Coconut Industry by Dr. Jelfina...Global Scenario On Sustainable  and Resilient Coconut Industry by Dr. Jelfina...
Global Scenario On Sustainable and Resilient Coconut Industry by Dr. Jelfina...ictsugar
 
Intro to BCG's Carbon Emissions Benchmark_vF.pdf
Intro to BCG's Carbon Emissions Benchmark_vF.pdfIntro to BCG's Carbon Emissions Benchmark_vF.pdf
Intro to BCG's Carbon Emissions Benchmark_vF.pdfpollardmorgan
 
RE Capital's Visionary Leadership under Newman Leech
RE Capital's Visionary Leadership under Newman LeechRE Capital's Visionary Leadership under Newman Leech
RE Capital's Visionary Leadership under Newman LeechNewman George Leech
 
Annual General Meeting Presentation Slides
Annual General Meeting Presentation SlidesAnnual General Meeting Presentation Slides
Annual General Meeting Presentation SlidesKeppelCorporation
 
Keppel Ltd. 1Q 2024 Business Update Presentation Slides
Keppel Ltd. 1Q 2024 Business Update  Presentation SlidesKeppel Ltd. 1Q 2024 Business Update  Presentation Slides
Keppel Ltd. 1Q 2024 Business Update Presentation SlidesKeppelCorporation
 
Call US-88OO1O2216 Call Girls In Mahipalpur Female Escort Service
Call US-88OO1O2216 Call Girls In Mahipalpur Female Escort ServiceCall US-88OO1O2216 Call Girls In Mahipalpur Female Escort Service
Call US-88OO1O2216 Call Girls In Mahipalpur Female Escort Servicecallgirls2057
 
Marketing Management Business Plan_My Sweet Creations
Marketing Management Business Plan_My Sweet CreationsMarketing Management Business Plan_My Sweet Creations
Marketing Management Business Plan_My Sweet Creationsnakalysalcedo61
 
/:Call Girls In Indirapuram Ghaziabad ➥9990211544 Independent Best Escorts In...
/:Call Girls In Indirapuram Ghaziabad ➥9990211544 Independent Best Escorts In.../:Call Girls In Indirapuram Ghaziabad ➥9990211544 Independent Best Escorts In...
/:Call Girls In Indirapuram Ghaziabad ➥9990211544 Independent Best Escorts In...lizamodels9
 
Future Of Sample Report 2024 | Redacted Version
Future Of Sample Report 2024 | Redacted VersionFuture Of Sample Report 2024 | Redacted Version
Future Of Sample Report 2024 | Redacted VersionMintel Group
 
8447779800, Low rate Call girls in Shivaji Enclave Delhi NCR
8447779800, Low rate Call girls in Shivaji Enclave Delhi NCR8447779800, Low rate Call girls in Shivaji Enclave Delhi NCR
8447779800, Low rate Call girls in Shivaji Enclave Delhi NCRashishs7044
 
8447779800, Low rate Call girls in Rohini Delhi NCR
8447779800, Low rate Call girls in Rohini Delhi NCR8447779800, Low rate Call girls in Rohini Delhi NCR
8447779800, Low rate Call girls in Rohini Delhi NCRashishs7044
 
India Consumer 2024 Redacted Sample Report
India Consumer 2024 Redacted Sample ReportIndia Consumer 2024 Redacted Sample Report
India Consumer 2024 Redacted Sample ReportMintel Group
 
Call Girls In Sikandarpur Gurgaon ❤️8860477959_Russian 100% Genuine Escorts I...
Call Girls In Sikandarpur Gurgaon ❤️8860477959_Russian 100% Genuine Escorts I...Call Girls In Sikandarpur Gurgaon ❤️8860477959_Russian 100% Genuine Escorts I...
Call Girls In Sikandarpur Gurgaon ❤️8860477959_Russian 100% Genuine Escorts I...lizamodels9
 
Lean: From Theory to Practice — One City’s (and Library’s) Lean Story… Abridged
Lean: From Theory to Practice — One City’s (and Library’s) Lean Story… AbridgedLean: From Theory to Practice — One City’s (and Library’s) Lean Story… Abridged
Lean: From Theory to Practice — One City’s (and Library’s) Lean Story… AbridgedKaiNexus
 
Youth Involvement in an Innovative Coconut Value Chain by Mwalimu Menza
Youth Involvement in an Innovative Coconut Value Chain by Mwalimu MenzaYouth Involvement in an Innovative Coconut Value Chain by Mwalimu Menza
Youth Involvement in an Innovative Coconut Value Chain by Mwalimu Menzaictsugar
 
Vip Female Escorts Noida 9711199171 Greater Noida Escorts Service
Vip Female Escorts Noida 9711199171 Greater Noida Escorts ServiceVip Female Escorts Noida 9711199171 Greater Noida Escorts Service
Vip Female Escorts Noida 9711199171 Greater Noida Escorts Serviceankitnayak356677
 
Kenya’s Coconut Value Chain by Gatsby Africa
Kenya’s Coconut Value Chain by Gatsby AfricaKenya’s Coconut Value Chain by Gatsby Africa
Kenya’s Coconut Value Chain by Gatsby Africaictsugar
 
Islamabad Escorts | Call 03274100048 | Escort Service in Islamabad
Islamabad Escorts | Call 03274100048 | Escort Service in IslamabadIslamabad Escorts | Call 03274100048 | Escort Service in Islamabad
Islamabad Escorts | Call 03274100048 | Escort Service in IslamabadAyesha Khan
 
Sales & Marketing Alignment: How to Synergize for Success
Sales & Marketing Alignment: How to Synergize for SuccessSales & Marketing Alignment: How to Synergize for Success
Sales & Marketing Alignment: How to Synergize for SuccessAggregage
 

Recently uploaded (20)

BEST Call Girls In Greater Noida ✨ 9773824855 ✨ Escorts Service In Delhi Ncr,
BEST Call Girls In Greater Noida ✨ 9773824855 ✨ Escorts Service In Delhi Ncr,BEST Call Girls In Greater Noida ✨ 9773824855 ✨ Escorts Service In Delhi Ncr,
BEST Call Girls In Greater Noida ✨ 9773824855 ✨ Escorts Service In Delhi Ncr,
 
Global Scenario On Sustainable and Resilient Coconut Industry by Dr. Jelfina...
Global Scenario On Sustainable  and Resilient Coconut Industry by Dr. Jelfina...Global Scenario On Sustainable  and Resilient Coconut Industry by Dr. Jelfina...
Global Scenario On Sustainable and Resilient Coconut Industry by Dr. Jelfina...
 
Intro to BCG's Carbon Emissions Benchmark_vF.pdf
Intro to BCG's Carbon Emissions Benchmark_vF.pdfIntro to BCG's Carbon Emissions Benchmark_vF.pdf
Intro to BCG's Carbon Emissions Benchmark_vF.pdf
 
RE Capital's Visionary Leadership under Newman Leech
RE Capital's Visionary Leadership under Newman LeechRE Capital's Visionary Leadership under Newman Leech
RE Capital's Visionary Leadership under Newman Leech
 
Annual General Meeting Presentation Slides
Annual General Meeting Presentation SlidesAnnual General Meeting Presentation Slides
Annual General Meeting Presentation Slides
 
Keppel Ltd. 1Q 2024 Business Update Presentation Slides
Keppel Ltd. 1Q 2024 Business Update  Presentation SlidesKeppel Ltd. 1Q 2024 Business Update  Presentation Slides
Keppel Ltd. 1Q 2024 Business Update Presentation Slides
 
Call US-88OO1O2216 Call Girls In Mahipalpur Female Escort Service
Call US-88OO1O2216 Call Girls In Mahipalpur Female Escort ServiceCall US-88OO1O2216 Call Girls In Mahipalpur Female Escort Service
Call US-88OO1O2216 Call Girls In Mahipalpur Female Escort Service
 
Marketing Management Business Plan_My Sweet Creations
Marketing Management Business Plan_My Sweet CreationsMarketing Management Business Plan_My Sweet Creations
Marketing Management Business Plan_My Sweet Creations
 
/:Call Girls In Indirapuram Ghaziabad ➥9990211544 Independent Best Escorts In...
/:Call Girls In Indirapuram Ghaziabad ➥9990211544 Independent Best Escorts In.../:Call Girls In Indirapuram Ghaziabad ➥9990211544 Independent Best Escorts In...
/:Call Girls In Indirapuram Ghaziabad ➥9990211544 Independent Best Escorts In...
 
Future Of Sample Report 2024 | Redacted Version
Future Of Sample Report 2024 | Redacted VersionFuture Of Sample Report 2024 | Redacted Version
Future Of Sample Report 2024 | Redacted Version
 
8447779800, Low rate Call girls in Shivaji Enclave Delhi NCR
8447779800, Low rate Call girls in Shivaji Enclave Delhi NCR8447779800, Low rate Call girls in Shivaji Enclave Delhi NCR
8447779800, Low rate Call girls in Shivaji Enclave Delhi NCR
 
8447779800, Low rate Call girls in Rohini Delhi NCR
8447779800, Low rate Call girls in Rohini Delhi NCR8447779800, Low rate Call girls in Rohini Delhi NCR
8447779800, Low rate Call girls in Rohini Delhi NCR
 
India Consumer 2024 Redacted Sample Report
India Consumer 2024 Redacted Sample ReportIndia Consumer 2024 Redacted Sample Report
India Consumer 2024 Redacted Sample Report
 
Call Girls In Sikandarpur Gurgaon ❤️8860477959_Russian 100% Genuine Escorts I...
Call Girls In Sikandarpur Gurgaon ❤️8860477959_Russian 100% Genuine Escorts I...Call Girls In Sikandarpur Gurgaon ❤️8860477959_Russian 100% Genuine Escorts I...
Call Girls In Sikandarpur Gurgaon ❤️8860477959_Russian 100% Genuine Escorts I...
 
Lean: From Theory to Practice — One City’s (and Library’s) Lean Story… Abridged
Lean: From Theory to Practice — One City’s (and Library’s) Lean Story… AbridgedLean: From Theory to Practice — One City’s (and Library’s) Lean Story… Abridged
Lean: From Theory to Practice — One City’s (and Library’s) Lean Story… Abridged
 
Youth Involvement in an Innovative Coconut Value Chain by Mwalimu Menza
Youth Involvement in an Innovative Coconut Value Chain by Mwalimu MenzaYouth Involvement in an Innovative Coconut Value Chain by Mwalimu Menza
Youth Involvement in an Innovative Coconut Value Chain by Mwalimu Menza
 
Vip Female Escorts Noida 9711199171 Greater Noida Escorts Service
Vip Female Escorts Noida 9711199171 Greater Noida Escorts ServiceVip Female Escorts Noida 9711199171 Greater Noida Escorts Service
Vip Female Escorts Noida 9711199171 Greater Noida Escorts Service
 
Kenya’s Coconut Value Chain by Gatsby Africa
Kenya’s Coconut Value Chain by Gatsby AfricaKenya’s Coconut Value Chain by Gatsby Africa
Kenya’s Coconut Value Chain by Gatsby Africa
 
Islamabad Escorts | Call 03274100048 | Escort Service in Islamabad
Islamabad Escorts | Call 03274100048 | Escort Service in IslamabadIslamabad Escorts | Call 03274100048 | Escort Service in Islamabad
Islamabad Escorts | Call 03274100048 | Escort Service in Islamabad
 
Sales & Marketing Alignment: How to Synergize for Success
Sales & Marketing Alignment: How to Synergize for SuccessSales & Marketing Alignment: How to Synergize for Success
Sales & Marketing Alignment: How to Synergize for Success
 

Cost volume Profile analysis PowerPoint presentation

  • 1. ©2003 Prentice Hall Business Publishing, Cost Accounting 11/e, Horngren/Datar/Foster 3 - 1 Cost-Volume-Profit Analysis Chapter 3
  • 2. ©2003 Prentice Hall Business Publishing, Cost Accounting 11/e, Horngren/Datar/Foster 3 - 2 Learning Objective 1 Understand the assumptions underlying cost-volume-profit (CVP) analysis.
  • 3. ©2003 Prentice Hall Business Publishing, Cost Accounting 11/e, Horngren/Datar/Foster 3 - 3 Cost-Volume-Profit Assumptions and Terminology 1. Changes in the level of revenues and costs arise only because of changes in the number of product (or service) units produced and sold. 2. Total costs can be divided into a fixed component and a component that is variable with respect to the level of output.
  • 4. ©2003 Prentice Hall Business Publishing, Cost Accounting 11/e, Horngren/Datar/Foster 3 - 4 Cost-Volume-Profit Assumptions and Terminology 3. When graphed, the behavior of total revenues and total costs is linear (straight-line) in relation to output units within the relevant range (and time period). 4. The unit selling price, unit variable costs, and fixed costs are known and constant.
  • 5. ©2003 Prentice Hall Business Publishing, Cost Accounting 11/e, Horngren/Datar/Foster 3 - 5 Cost-Volume-Profit Assumptions and Terminology 5. The analysis either covers a single product or assumes that the sales mix when multiple products are sold will remain constant as the level of total units sold changes. 6. All revenues and costs can be added and compared without taking into account the time value of money.
  • 6. ©2003 Prentice Hall Business Publishing, Cost Accounting 11/e, Horngren/Datar/Foster 3 - 6 Cost-Volume-Profit Assumptions and Terminology Operating income = Total revenues from operations – Cost of goods sold and operating costs (excluding income taxes) Net income = Operating income – Income taxes
  • 7. ©2003 Prentice Hall Business Publishing, Cost Accounting 11/e, Horngren/Datar/Foster 3 - 7 Learning Objective 2 Explain the features of CVP analysis.
  • 8. ©2003 Prentice Hall Business Publishing, Cost Accounting 11/e, Horngren/Datar/Foster 3 - 8 Essentials of Cost-Volume-Profit (CVP) Analysis Example Assume that the Pants Shop can purchase pants for $32 from a local factory; other variable costs amount to $10 per unit. The local factory allows the Pants Shop to return all unsold pants and receive a full $32 refund per pair of pants within one year. The average selling price per pair of pants is $70 and total fixed costs amount to $84,000.
  • 9. ©2003 Prentice Hall Business Publishing, Cost Accounting 11/e, Horngren/Datar/Foster 3 - 9 Essentials of Cost-Volume-Profit (CVP) Analysis Example How much revenue will the business receive if 2,500 units are sold? 2,500 × $70 = $175,000 How much variable costs will the business incur? 2,500 × $42 = $105,000 $175,000 – 105,000 – 84,000 = ($14,000)
  • 10. ©2003 Prentice Hall Business Publishing, Cost Accounting 11/e, Horngren/Datar/Foster 3 - 10 Essentials of Cost-Volume-Profit (CVP) Analysis Example What is the contribution margin per unit? $70 – $42 = $28 contribution margin per unit What is the total contribution margin when 2,500 pairs of pants are sold? 2,500 × $28 = $70,000
  • 11. ©2003 Prentice Hall Business Publishing, Cost Accounting 11/e, Horngren/Datar/Foster 3 - 11 Essentials of Cost-Volume-Profit (CVP) Analysis Example Contribution margin percentage (contribution margin ratio) is the contribution margin per unit divided by the selling price. What is the contribution margin percentage? $28 ÷ $70 = 40%
  • 12. ©2003 Prentice Hall Business Publishing, Cost Accounting 11/e, Horngren/Datar/Foster 3 - 12 Essentials of Cost-Volume-Profit (CVP) Analysis Example If the business sells 3,000 pairs of pants, revenues will be $210,000 and contribution margin would equal 40% × $210,000 = $84,000. A FEDERAL RESERVE NOTE THE UNITED STATES OF AMERICA THE UNITED STATES OF AMERICA L70744629F 12 12 12 12 L70744629F ONE DOLLAR ONE DOLLAR W A SH IN G TO N, D .C. TH I S N O TE IS L E G A L T E N D E R F O R A L L D E B T S , P U B L I C A N D P R IV A T E S E R I E S 1 9 8 5 H 293
  • 13. ©2003 Prentice Hall Business Publishing, Cost Accounting 11/e, Horngren/Datar/Foster 3 - 13 Learning Objective 3 Determine the breakeven point and output level needed to achieve a target operating income using the equation, contribution margin, and graph methods.
  • 14. ©2003 Prentice Hall Business Publishing, Cost Accounting 11/e, Horngren/Datar/Foster 3 - 14 Breakeven Point Sales Variable expenses Fixed expenses – = Total revenues = Total costs
  • 15. ©2003 Prentice Hall Business Publishing, Cost Accounting 11/e, Horngren/Datar/Foster 3 - 15 Abbreviations SP = Selling price VCU = Variable cost per unit CMU = Contribution margin per unit CM% = Contribution margin percentage FC = Fixed costs
  • 16. ©2003 Prentice Hall Business Publishing, Cost Accounting 11/e, Horngren/Datar/Foster 3 - 16 Abbreviations Q = Quantity of output units sold (and manufactured) OI = Operating income TOI = Target operating income TNI = Target net income
  • 17. ©2003 Prentice Hall Business Publishing, Cost Accounting 11/e, Horngren/Datar/Foster 3 - 17 Equation Method $70Q – $42Q – $84,000 = 0 $28Q = $84,000 Q = $84,000 ÷ $28 = 3,000 units Let Q = number of units to be sold to break even (Selling price × Quantity sold) – (Variable unit cost × Quantity sold) – Fixed costs = Operating income
  • 18. ©2003 Prentice Hall Business Publishing, Cost Accounting 11/e, Horngren/Datar/Foster 3 - 18 Contribution Margin Method $84,000 ÷ $28 = 3,000 units $84,000 ÷ 40% = $210,000
  • 19. ©2003 Prentice Hall Business Publishing, Cost Accounting 11/e, Horngren/Datar/Foster 3 - 19 Graph Method 0 42 84 126 168 210 252 294 336 378 0 1000 2000 3000 4000 5000 Units $(000) Breakeven Fixed costs
  • 20. ©2003 Prentice Hall Business Publishing, Cost Accounting 11/e, Horngren/Datar/Foster 3 - 20 Target Operating Income (Fixed costs + Target operating income) divided either by Contribution margin percentage or Contribution margin per unit
  • 21. ©2003 Prentice Hall Business Publishing, Cost Accounting 11/e, Horngren/Datar/Foster 3 - 21 Target Operating Income Assume that management wants to have an operating income of $14,000. How many pairs of pants must be sold? ($84,000 + $14,000) ÷ $28 = 3,500 What dollar sales are needed to achieve this income? ($84,000 + $14,000) ÷ 40% = $245,000
  • 22. ©2003 Prentice Hall Business Publishing, Cost Accounting 11/e, Horngren/Datar/Foster 3 - 22 Learning Objective 4 Understand how income taxes affect CVP analysis.
  • 23. ©2003 Prentice Hall Business Publishing, Cost Accounting 11/e, Horngren/Datar/Foster 3 - 23 Target Net Income and Income Taxes Example Management would like to earn an after tax income of $35,711. The tax rate is 30%. What is the target operating income? Target operating income = Target net income ÷ (1 – tax rate) TOI = $35,711 ÷ (1 – 0.30) = $51,016
  • 24. ©2003 Prentice Hall Business Publishing, Cost Accounting 11/e, Horngren/Datar/Foster 3 - 24 Target Net Income and Income Taxes Example How many units must be sold? Revenues – Variable costs – Fixed costs = Target net income ÷ (1 – tax rate) $70Q – $42Q – $84,000 = $35,711 ÷ 0.70 $28Q = $51,016 + $84,000 Q = $135,016 ÷ $28 = 4,822 pairs of pants
  • 25. ©2003 Prentice Hall Business Publishing, Cost Accounting 11/e, Horngren/Datar/Foster 3 - 25 Target Net Income and Income Taxes Example Proof: Revenues: 4,822 × $70 $337,540 Variable costs: 4,822 × $42 202,524 Contribution margin $135,016 Fixed costs 84,000 Operating income 51,016 Income taxes: $51,016 × 30% 15,305 Net income $ 35,711
  • 26. ©2003 Prentice Hall Business Publishing, Cost Accounting 11/e, Horngren/Datar/Foster 3 - 26 Learning Objective 5 Explain CVP analysis in decision making and how sensitivity analysis helps managers cope with uncertainty.
  • 27. ©2003 Prentice Hall Business Publishing, Cost Accounting 11/e, Horngren/Datar/Foster 3 - 27 Using CVP Analysis Example Suppose the management anticipates selling 3,200 pairs of pants. Management is considering an advertising campaign that would cost $10,000. It is anticipated that the advertising will increase sales to 4,000 units. Should the business advertise?
  • 28. ©2003 Prentice Hall Business Publishing, Cost Accounting 11/e, Horngren/Datar/Foster 3 - 28 Using CVP Analysis Example 3,200 pairs of pants sold with no advertising: Contribution margin $89,600 Fixed costs 84,000 Operating income $ 5,600 4,000 pairs of pants sold with advertising: Contribution margin $112,000 Fixed costs 94,000 Operating income $ 18,000
  • 29. ©2003 Prentice Hall Business Publishing, Cost Accounting 11/e, Horngren/Datar/Foster 3 - 29 Using CVP Analysis Example Instead of advertising, management is considering reducing the selling price to $61 per pair of pants. It is anticipated that this will increase sales to 4,500 units. Should management decrease the selling price per pair of pants to $61?
  • 30. ©2003 Prentice Hall Business Publishing, Cost Accounting 11/e, Horngren/Datar/Foster 3 - 30 Using CVP Analysis Example 3,200 pairs of pants sold with no change in the selling price: Operating income = $5,600 4,500 pairs of pants sold at a reduced selling price: Contribution margin: (4,500 × $19) $85,500 Fixed costs 84,000 Operating income $ 1,500
  • 31. ©2003 Prentice Hall Business Publishing, Cost Accounting 11/e, Horngren/Datar/Foster 3 - 31 Sensitivity Analysis and Uncertainty Example Assume that the Pants Shop can sell 4,000 pairs of pants. Fixed costs are $84,000. Contribution margin ratio is 40%. At the present time the business cannot handle more than 3,500 pairs of pants.
  • 32. ©2003 Prentice Hall Business Publishing, Cost Accounting 11/e, Horngren/Datar/Foster 3 - 32 Sensitivity Analysis and Uncertainty Example To satisfy a demand for 4,000 pairs, management must acquire additional space for $6,000. Should the additional space be acquired? Revenues at breakeven with existing space are $84,000 ÷ .40 = $210,000. Revenues at breakeven with additional space are $90,000 ÷ .40 = $225,000
  • 33. ©2003 Prentice Hall Business Publishing, Cost Accounting 11/e, Horngren/Datar/Foster 3 - 33 Sensitivity Analysis and Uncertainty Example Operating income at $245,000 revenues with existing space = ($245,000 × .40) – $84,000 = $14,000. (3,500 pairs of pants × $28) – $84,000 = $14,000
  • 34. ©2003 Prentice Hall Business Publishing, Cost Accounting 11/e, Horngren/Datar/Foster 3 - 34 Sensitivity Analysis and Uncertainty Example Operating income at $280,000 revenues with additional space = ($280,000 × .40) – $90,000 = $22,000. (4,000 pairs of pants × $28 contribution margin) – $90,000 = $22,000
  • 35. ©2003 Prentice Hall Business Publishing, Cost Accounting 11/e, Horngren/Datar/Foster 3 - 35 Learning Objective 6 Use CVP analysis to plan fixed and variable costs.
  • 36. ©2003 Prentice Hall Business Publishing, Cost Accounting 11/e, Horngren/Datar/Foster 3 - 36 Alternative Fixed/Variable Cost Structures Example What is the new contribution margin? Decrease the price they charge from $32 to $25 and charge an annual administrative fee of $30,000. Suppose that the factory the Pants Shop is using to obtain the merchandise offers the following:
  • 37. ©2003 Prentice Hall Business Publishing, Cost Accounting 11/e, Horngren/Datar/Foster 3 - 37 Alternative Fixed/Variable Cost Structures Example $70 – ($25 + $10) = $35 Contribution margin increases from $28 to $35. What is the contribution margin percentage? $35 ÷ $70 = 50% What are the new fixed costs? $84,000 + $30,000 = $114,000
  • 38. ©2003 Prentice Hall Business Publishing, Cost Accounting 11/e, Horngren/Datar/Foster 3 - 38 Alternative Fixed/Variable Cost Structures Example Management questions what sales volume would yield an identical operating income regardless of the arrangement. 28x – 84,000 = 35x – 114,000 114,000 – 84,000 = 35x – 28x 7x = 30,000 x = 4,286 pairs of pants
  • 39. ©2003 Prentice Hall Business Publishing, Cost Accounting 11/e, Horngren/Datar/Foster 3 - 39 Alternative Fixed/Variable Cost Structures Example Cost with existing arrangement = Cost with new arrangement .60x + 84,000 = .50x + 114,000 .10x = $30,000  x = $300,000 ($300,000 × .40) – $ 84,000 = $36,000 ($300,000 × .50) – $114,000 = $36,000
  • 40. ©2003 Prentice Hall Business Publishing, Cost Accounting 11/e, Horngren/Datar/Foster 3 - 40 Operating Leverage Operating leverage describes the effects that fixed costs have on changes in operating income as changes occur in units sold. Organizations with a high proportion of fixed costs have high operating leverage.
  • 41. ©2003 Prentice Hall Business Publishing, Cost Accounting 11/e, Horngren/Datar/Foster 3 - 41 Operating Leverage Example Degree of operating leverage = Contribution margin ÷ Operating income What is the degree of operating leverage of the Pants Shop at the 3,500 sales level under both arrangements? Existing arrangement: 3,500 × $28 = $98,000 contribution margin
  • 42. ©2003 Prentice Hall Business Publishing, Cost Accounting 11/e, Horngren/Datar/Foster 3 - 42 Operating Leverage Example $98,000 contribution margin – $84,000 fixed costs = $14,000 operating income $98,000 ÷ $14,000 = 7.0 New arrangement: 3,500 × $35 = $122,500 contribution margin
  • 43. ©2003 Prentice Hall Business Publishing, Cost Accounting 11/e, Horngren/Datar/Foster 3 - 43 Operating Leverage Example $122,500 contribution margin – $114,000 fixed costs = $8,500 $122,500 ÷ $8,500 = 14.4 The degree of operating leverage at a given level of sales helps managers calculate the effect of fluctuations in sales on operating income.
  • 44. ©2003 Prentice Hall Business Publishing, Cost Accounting 11/e, Horngren/Datar/Foster 3 - 44 Learning Objective 7 Apply CVP analysis to a company producing different products.
  • 45. ©2003 Prentice Hall Business Publishing, Cost Accounting 11/e, Horngren/Datar/Foster 3 - 45 Effects of Sales Mix on Income Pants Shop Example Management expects to sell 2 shirts at $20 each for every pair of pants it sells. This will not require any additional fixed costs.
  • 46. ©2003 Prentice Hall Business Publishing, Cost Accounting 11/e, Horngren/Datar/Foster 3 - 46 Effects of Sales Mix on Income What is the contribution margin of the mix? Contribution margin per shirt: $20 – $9 = $11 $28 + (2 × $11) = $28 + $22 = $50
  • 47. ©2003 Prentice Hall Business Publishing, Cost Accounting 11/e, Horngren/Datar/Foster 3 - 47 Effects of Sales Mix on Income $84,000 fixed costs ÷ $50 = 1,680 packages 1,680 × 2 = 3,360 shirts 1,680 × 1 = 1,680 pairs of pants Total units = 5,040
  • 48. ©2003 Prentice Hall Business Publishing, Cost Accounting 11/e, Horngren/Datar/Foster 3 - 48 Effects of Sales Mix on Income What is the breakeven in dollars? 3,360 shirts × $20 = $ 67,200 1,680 pairs of pants × $70 = 117,600 $184,800
  • 49. ©2003 Prentice Hall Business Publishing, Cost Accounting 11/e, Horngren/Datar/Foster 3 - 49 Effects of Sales Mix on Income What is the weighted-average budgeted contribution margin? Pants: 1 × $28 + Shirts: 2 × $11 = $50 ÷ 3 = $16.667
  • 50. ©2003 Prentice Hall Business Publishing, Cost Accounting 11/e, Horngren/Datar/Foster 3 - 50 Effects of Sales Mix on Income The breakeven point for the two products is: $84,000 ÷ $16.667 = 5,040 units 5,040 × 1/3 = 1,680 pairs of pants 5,040 × 2/3 = 3,360 shirts
  • 51. ©2003 Prentice Hall Business Publishing, Cost Accounting 11/e, Horngren/Datar/Foster 3 - 51 Effects of Sales Mix on Income Sales mix can be stated in sales dollars: Pants Shirts Sales price $70 $40 Variable costs 42 18 Contribution margin $28 $22 Contribution margin ratio 40% 55%
  • 52. ©2003 Prentice Hall Business Publishing, Cost Accounting 11/e, Horngren/Datar/Foster 3 - 52 Effects of Sales Mix on Income Assume the sales mix in dollars is 63.6% pants and 36.4% shirts. Weighted contribution would be: 40% × 63.6% = 25.44% pants 55% × 36.4% = 20.02% shirts 45.46%
  • 53. ©2003 Prentice Hall Business Publishing, Cost Accounting 11/e, Horngren/Datar/Foster 3 - 53 Effects of Sales Mix on Income Breakeven sales dollars is $84,000 ÷ 45.46% = $184,778 (rounding). $184,778 × 63.6% = $117,519 pants sales $184,778 × 36.4% = $ 67,259 shirt sales
  • 54. ©2003 Prentice Hall Business Publishing, Cost Accounting 11/e, Horngren/Datar/Foster 3 - 54 Learning Objective 8 Adapt CVP analysis to situations in which a product has more than one cost driver.
  • 55. ©2003 Prentice Hall Business Publishing, Cost Accounting 11/e, Horngren/Datar/Foster 3 - 55 Multiple Cost Drivers Example Suppose that the business will incur an additional cost of $10 for preparing documents associated with the sale of pants to various customers. Assume that the business sells 3,500 pants to 100 different customers. What is the operating income from this sale?
  • 56. ©2003 Prentice Hall Business Publishing, Cost Accounting 11/e, Horngren/Datar/Foster 3 - 56 Multiple Cost Drivers Example Revenues: 3,500 × $70 $245,000 Variable costs: Pants: 3,500 × $42 147,000 Documents: 100 × $10 1,000 Total 148,000 Contribution margin 97,000 Fixed costs 84,000 Operating income $ 13,000
  • 57. ©2003 Prentice Hall Business Publishing, Cost Accounting 11/e, Horngren/Datar/Foster 3 - 57 Multiple Cost Drivers Would the operating income of the Pants Shop be lower or higher if the business sells pants to more customers? The cost structure depends on two cost drivers: 1. Number of units 2. Number of customers
  • 58. ©2003 Prentice Hall Business Publishing, Cost Accounting 11/e, Horngren/Datar/Foster 3 - 58 Learning Objective 9 Distinguish between contribution margin and gross margin.
  • 59. ©2003 Prentice Hall Business Publishing, Cost Accounting 11/e, Horngren/Datar/Foster 3 - 59 Contribution Margin versus Gross Margin Contribution income statement emphasizes contribution margin. Financial accounting income statement emphasizes gross margin.
  • 60. ©2003 Prentice Hall Business Publishing, Cost Accounting 11/e, Horngren/Datar/Foster 3 - 60 End of Chapter 3