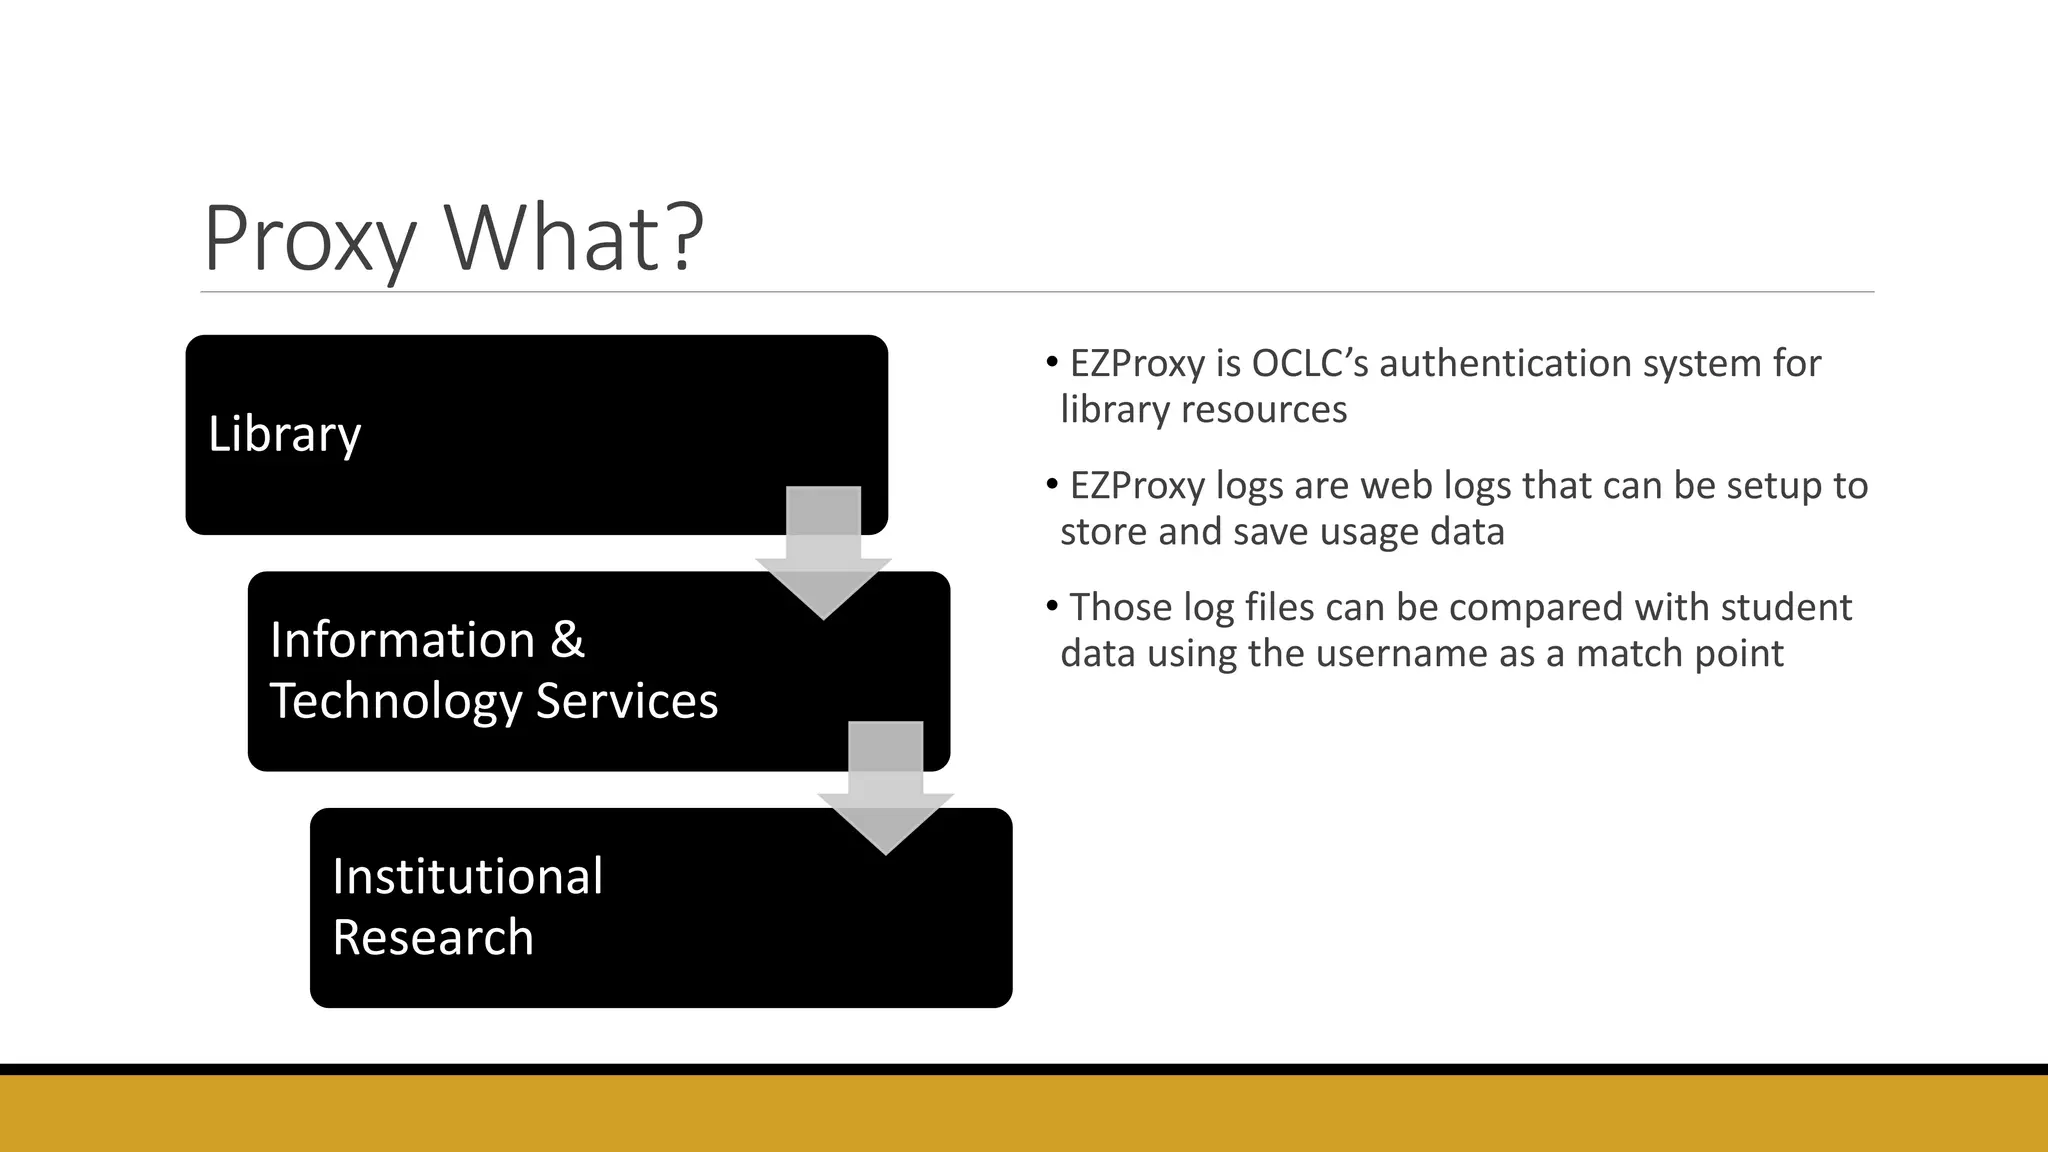
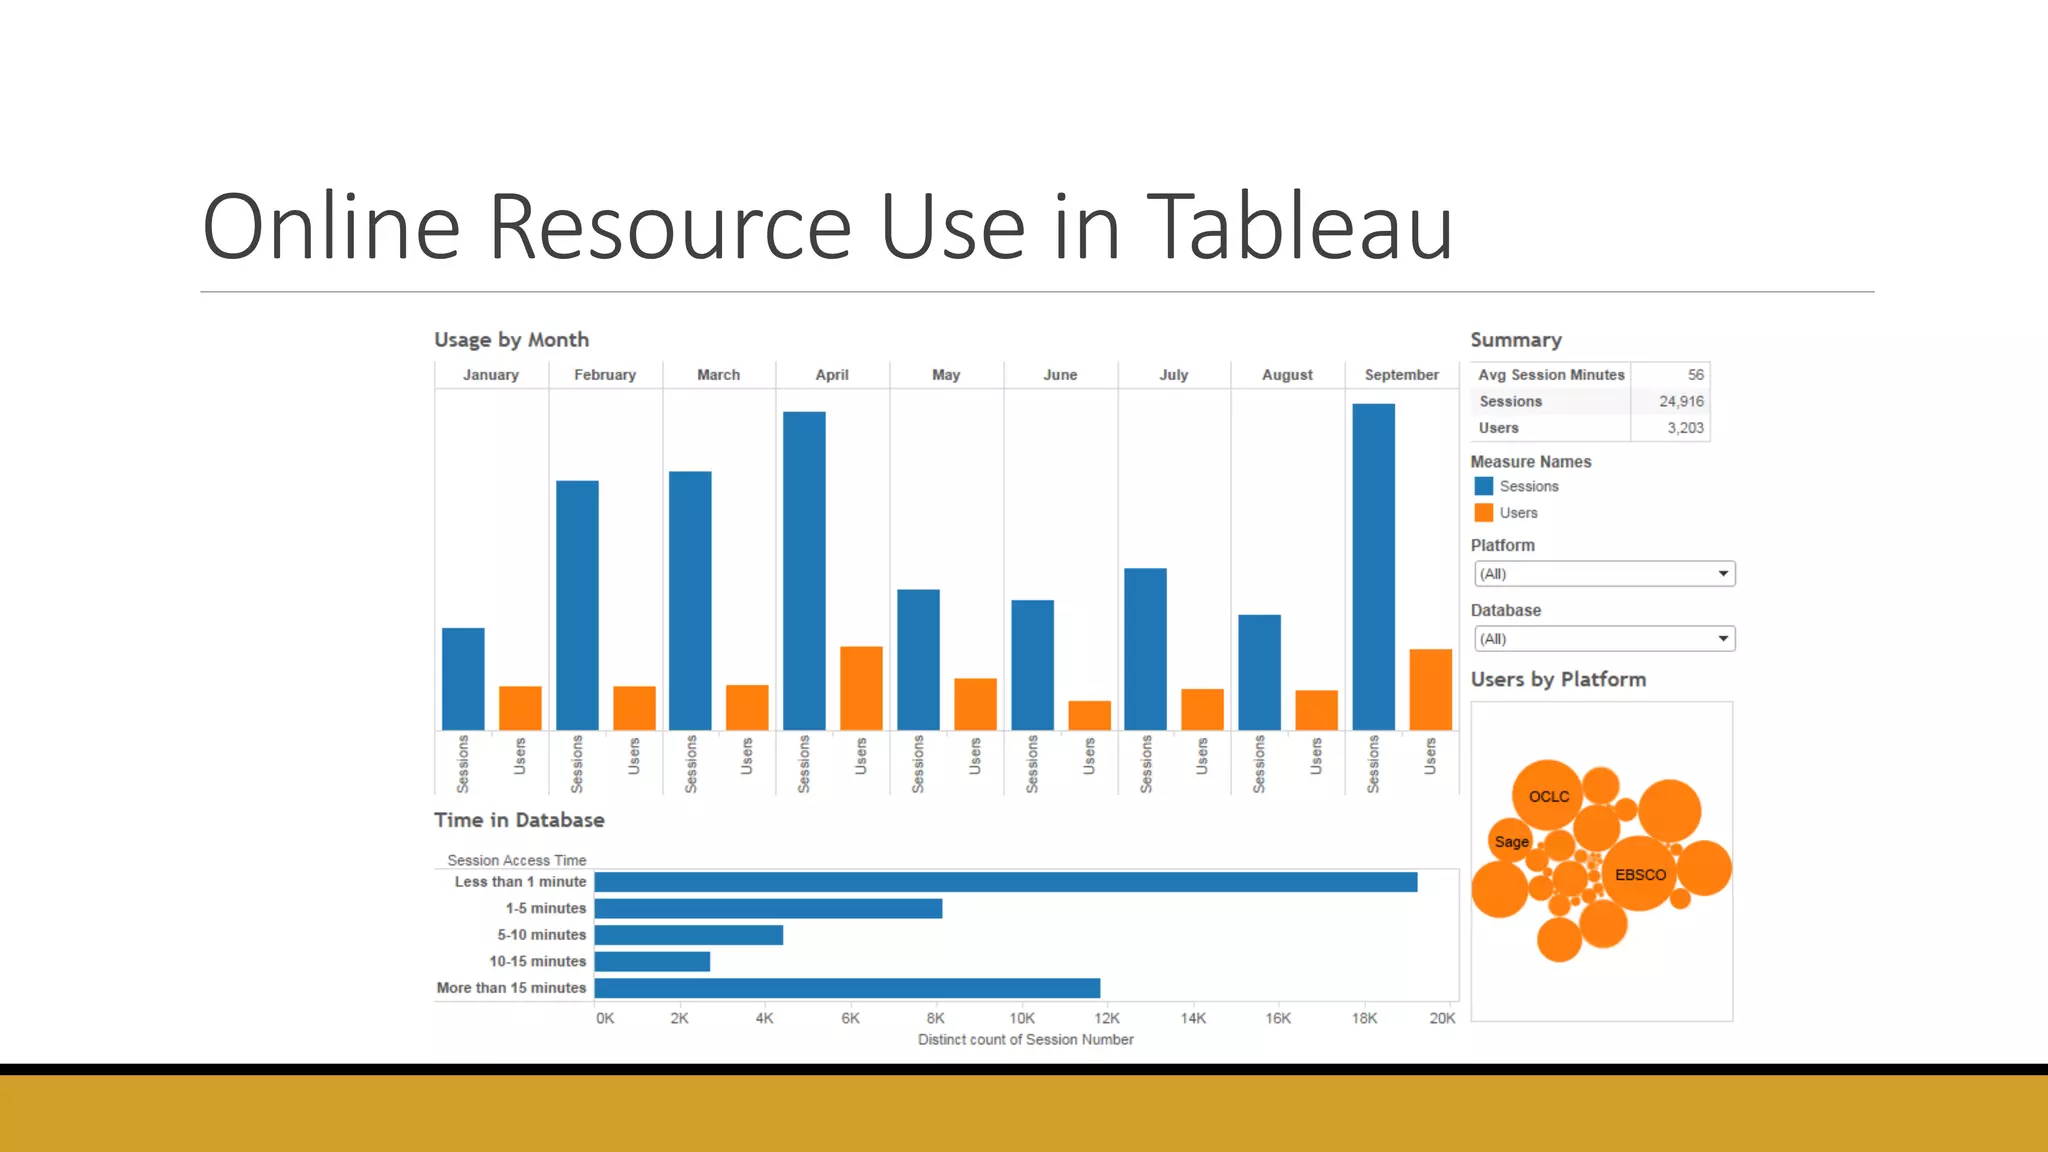
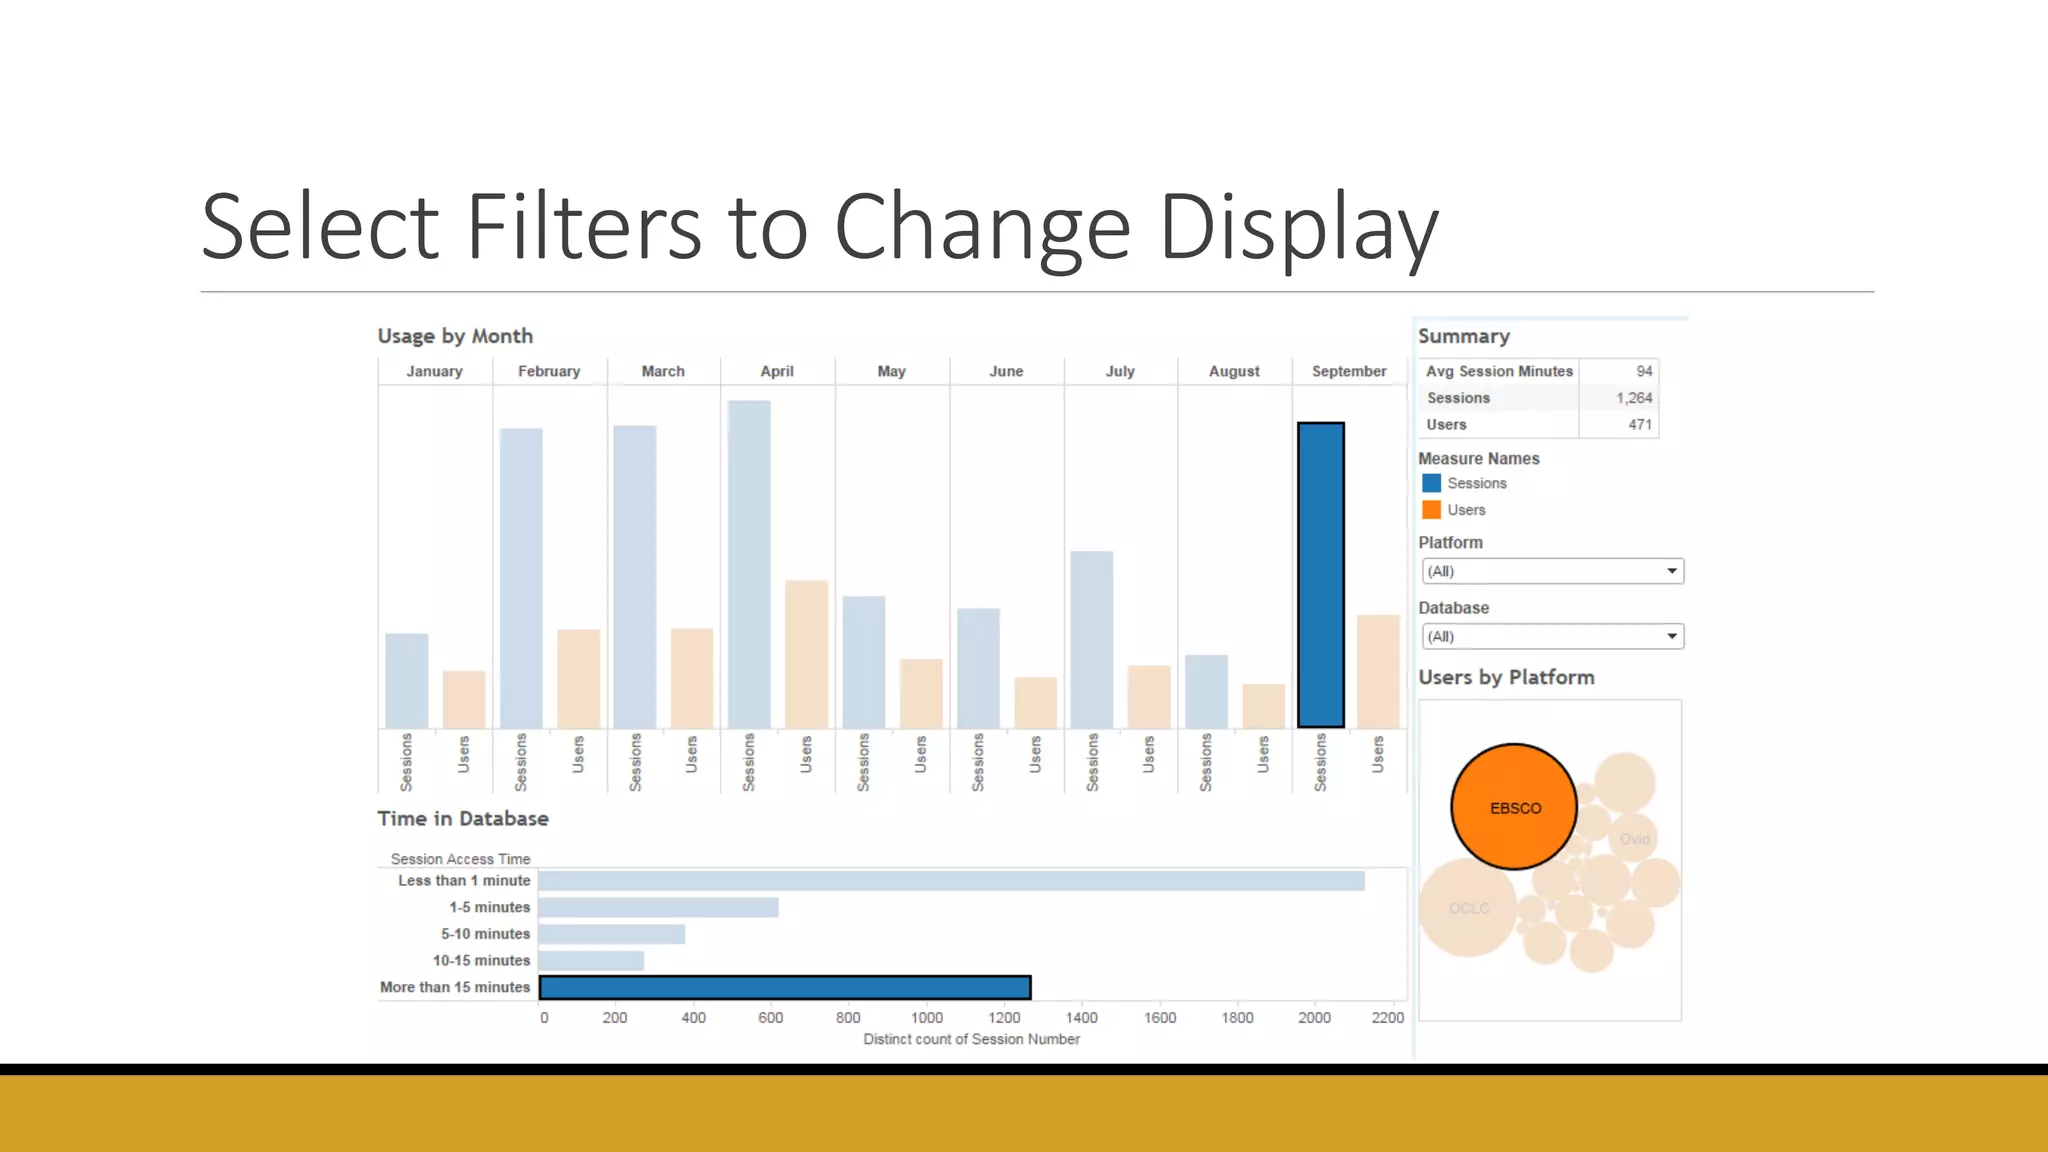
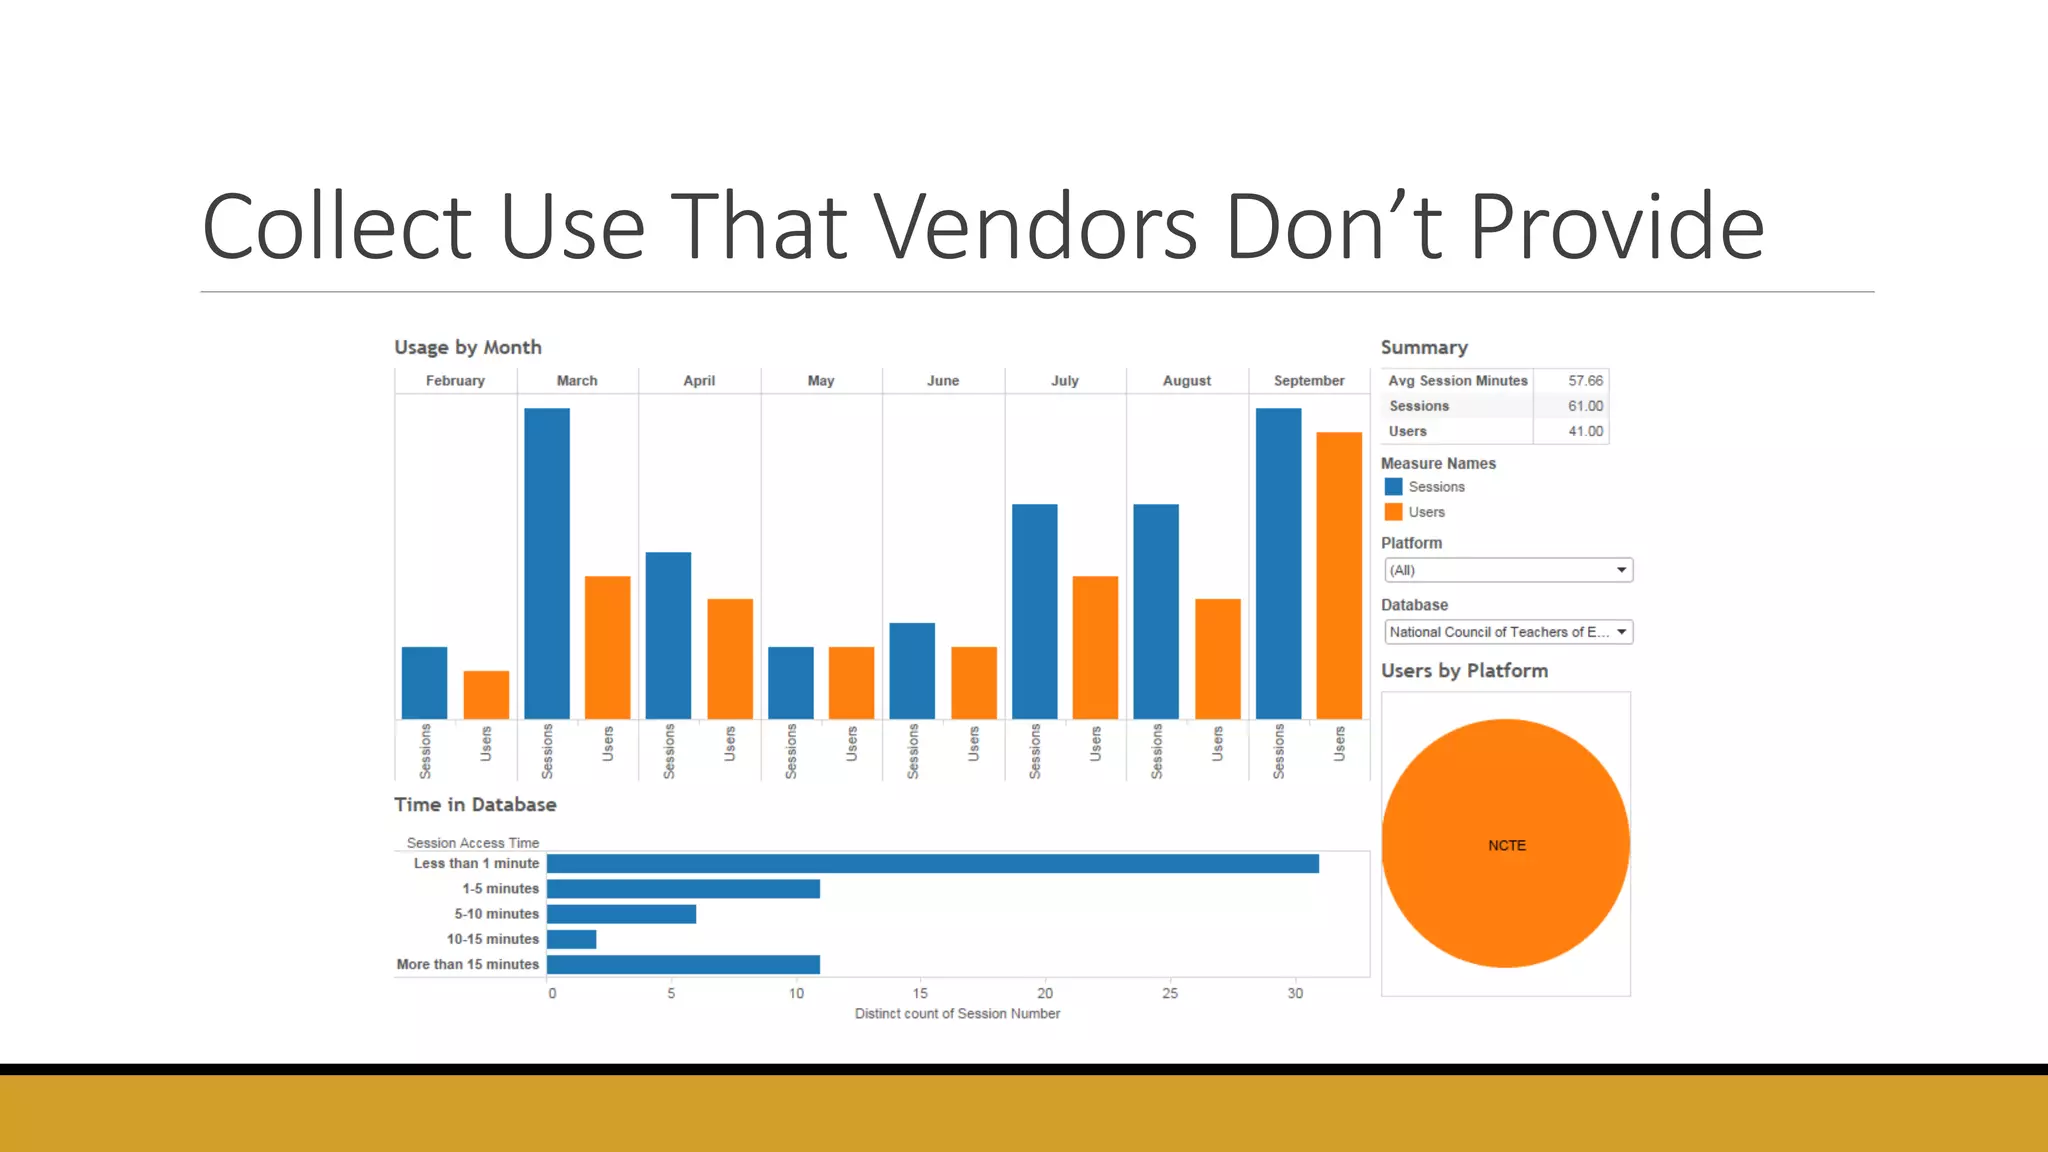
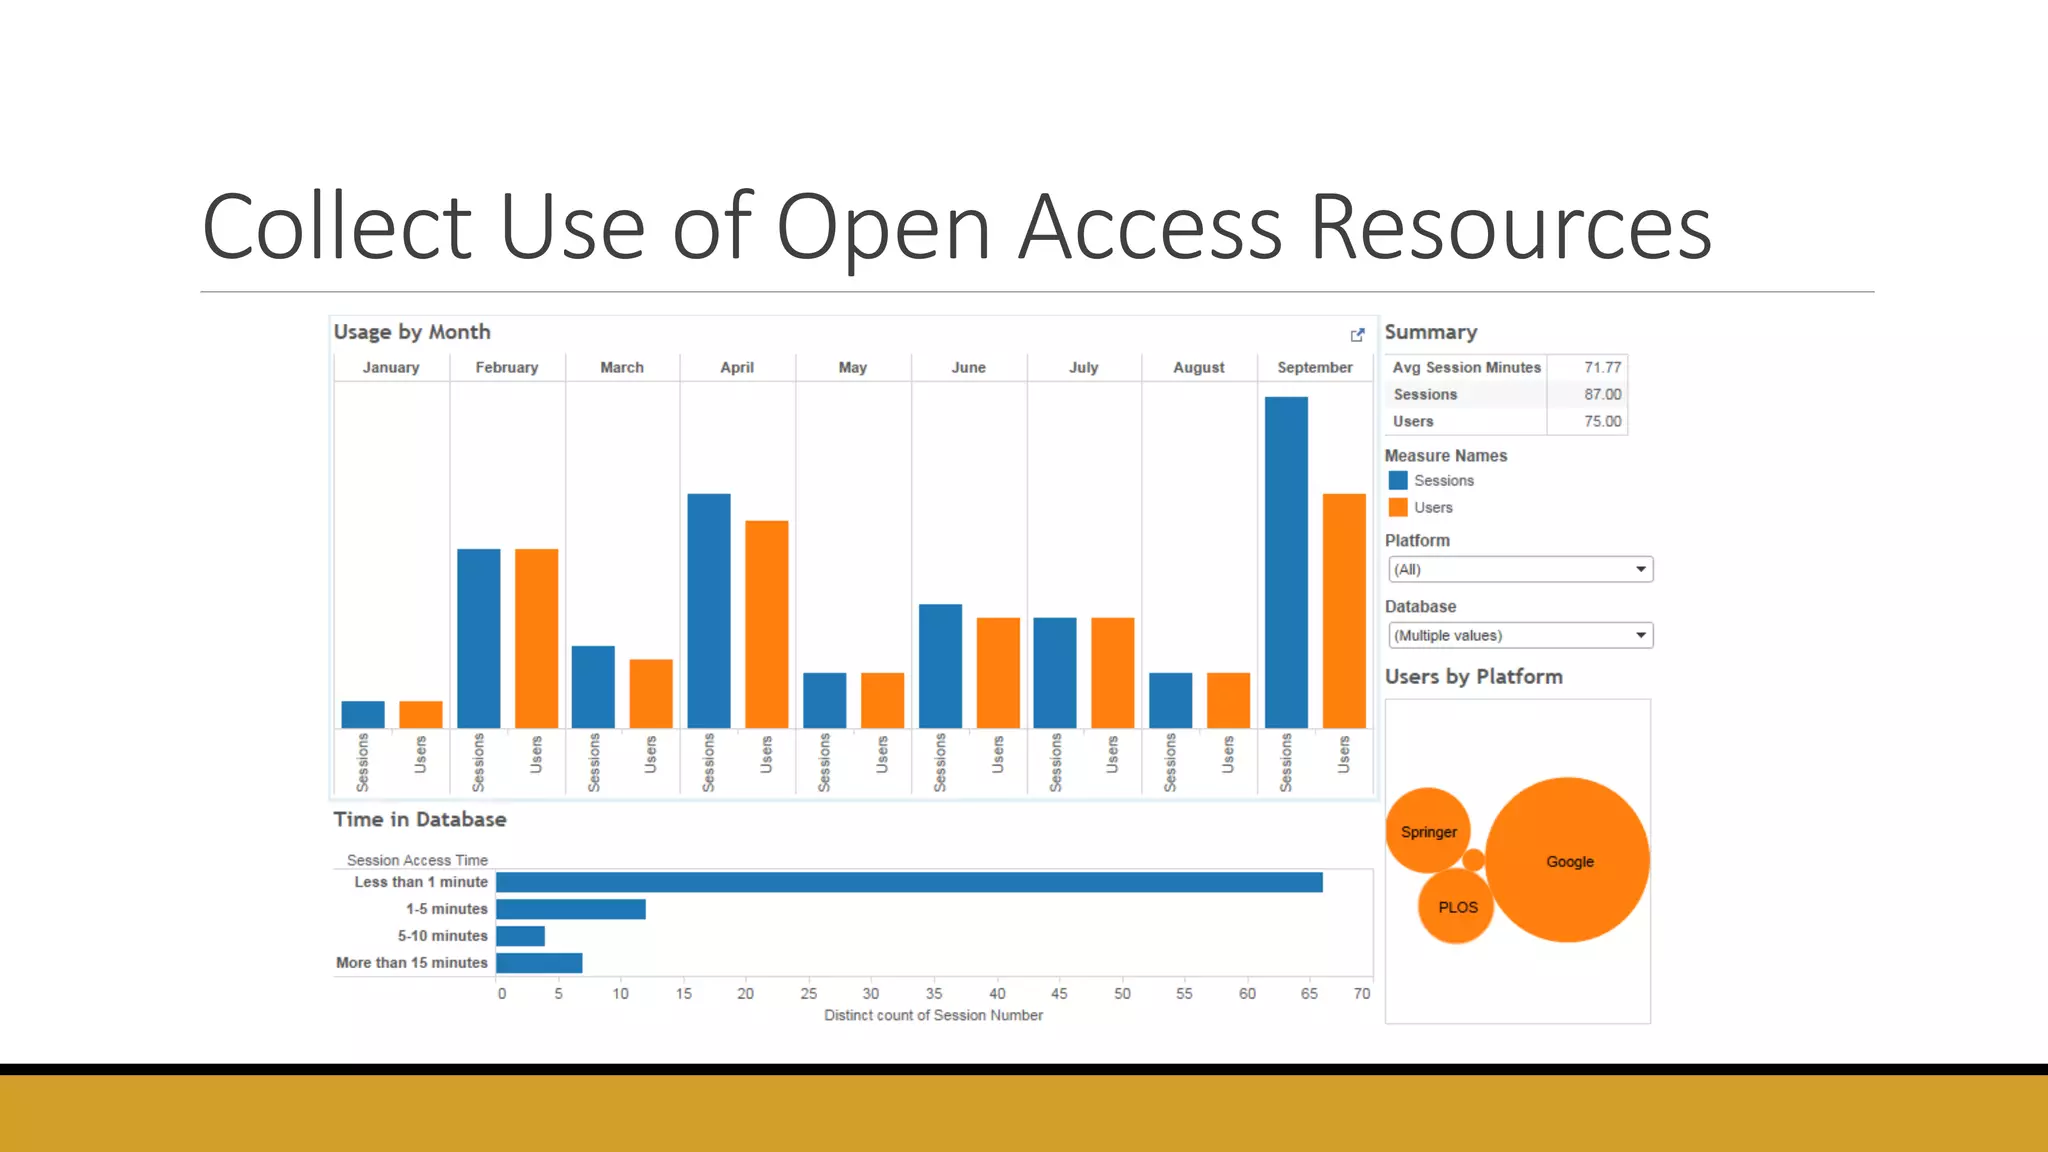
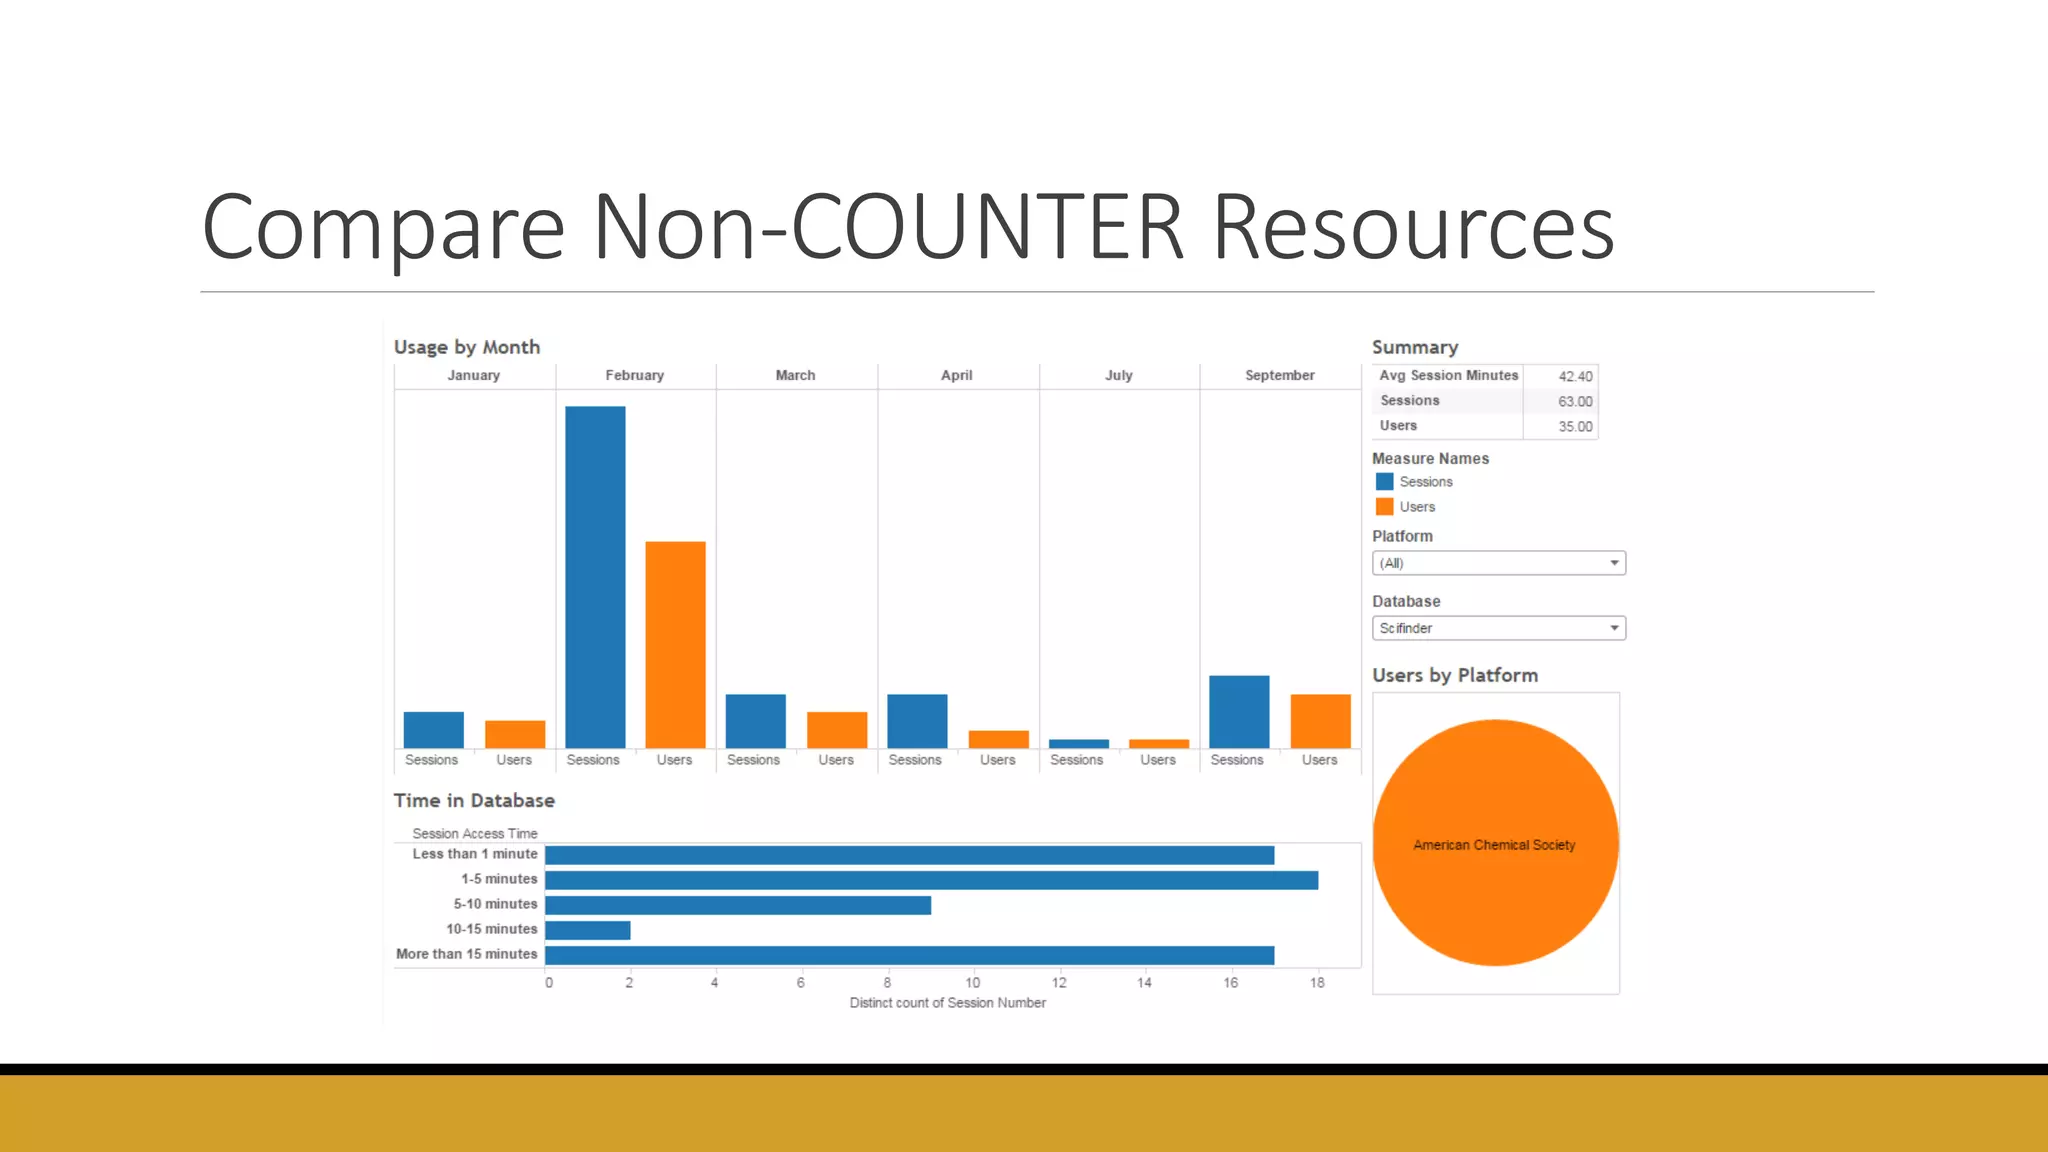
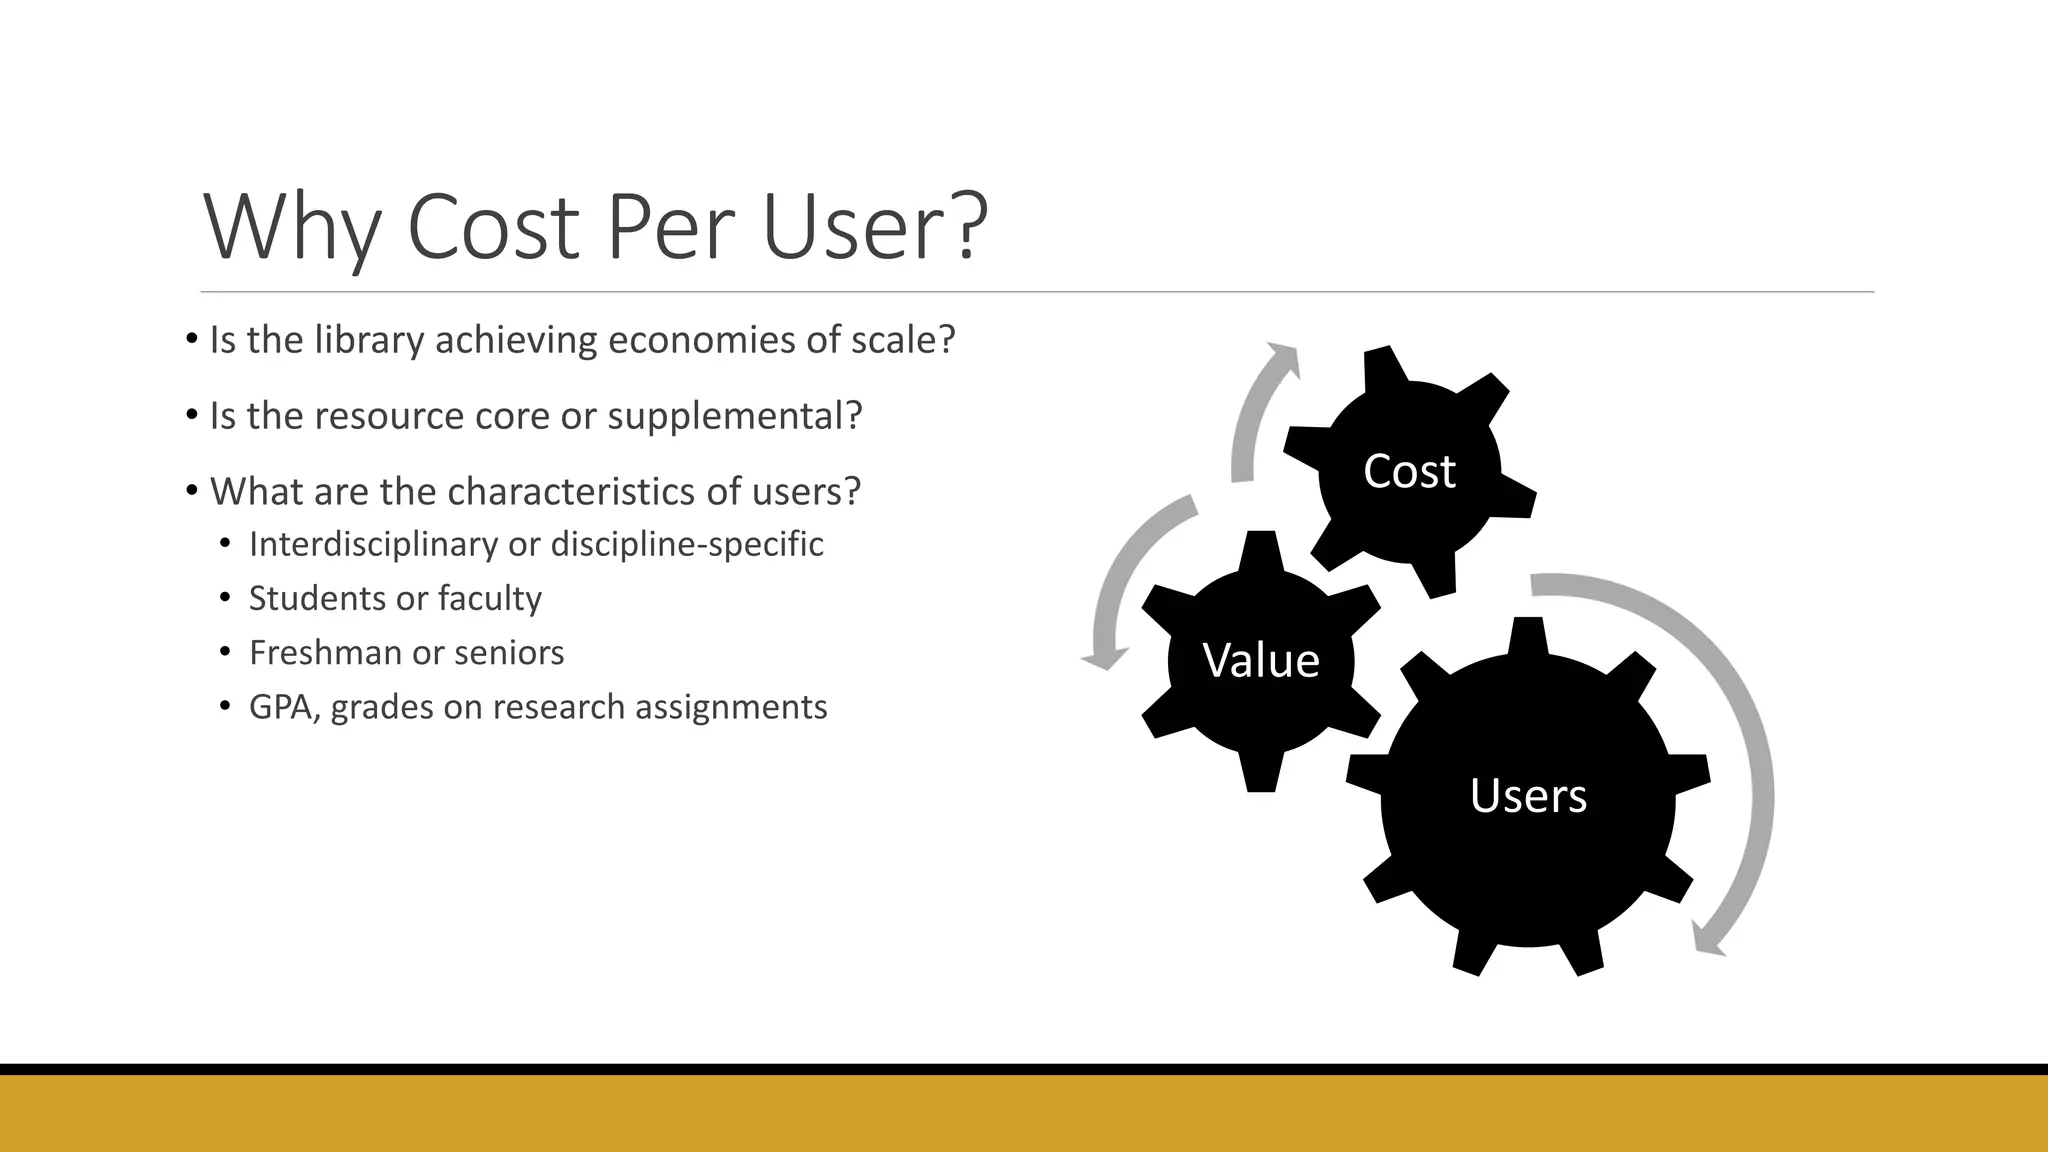
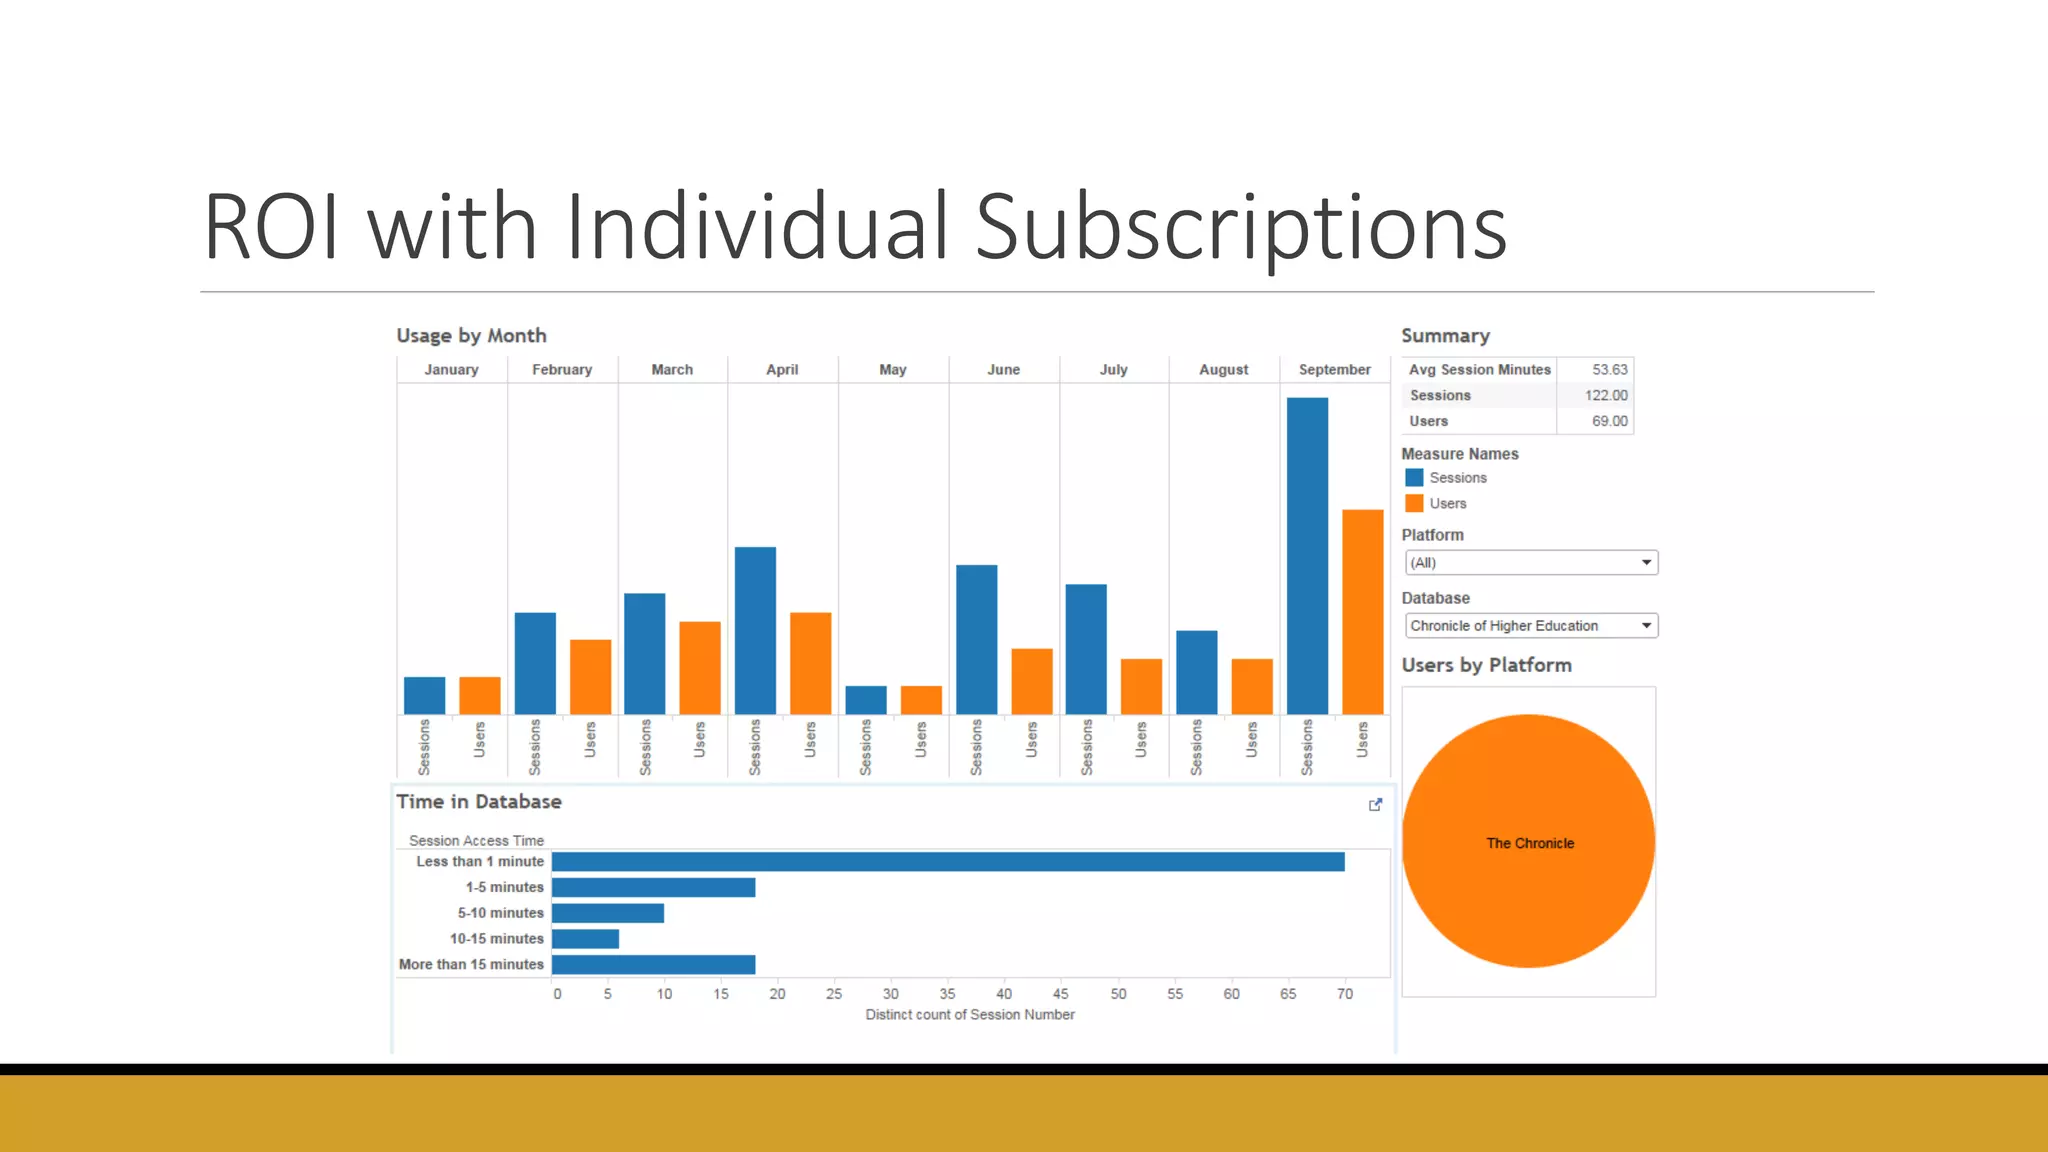
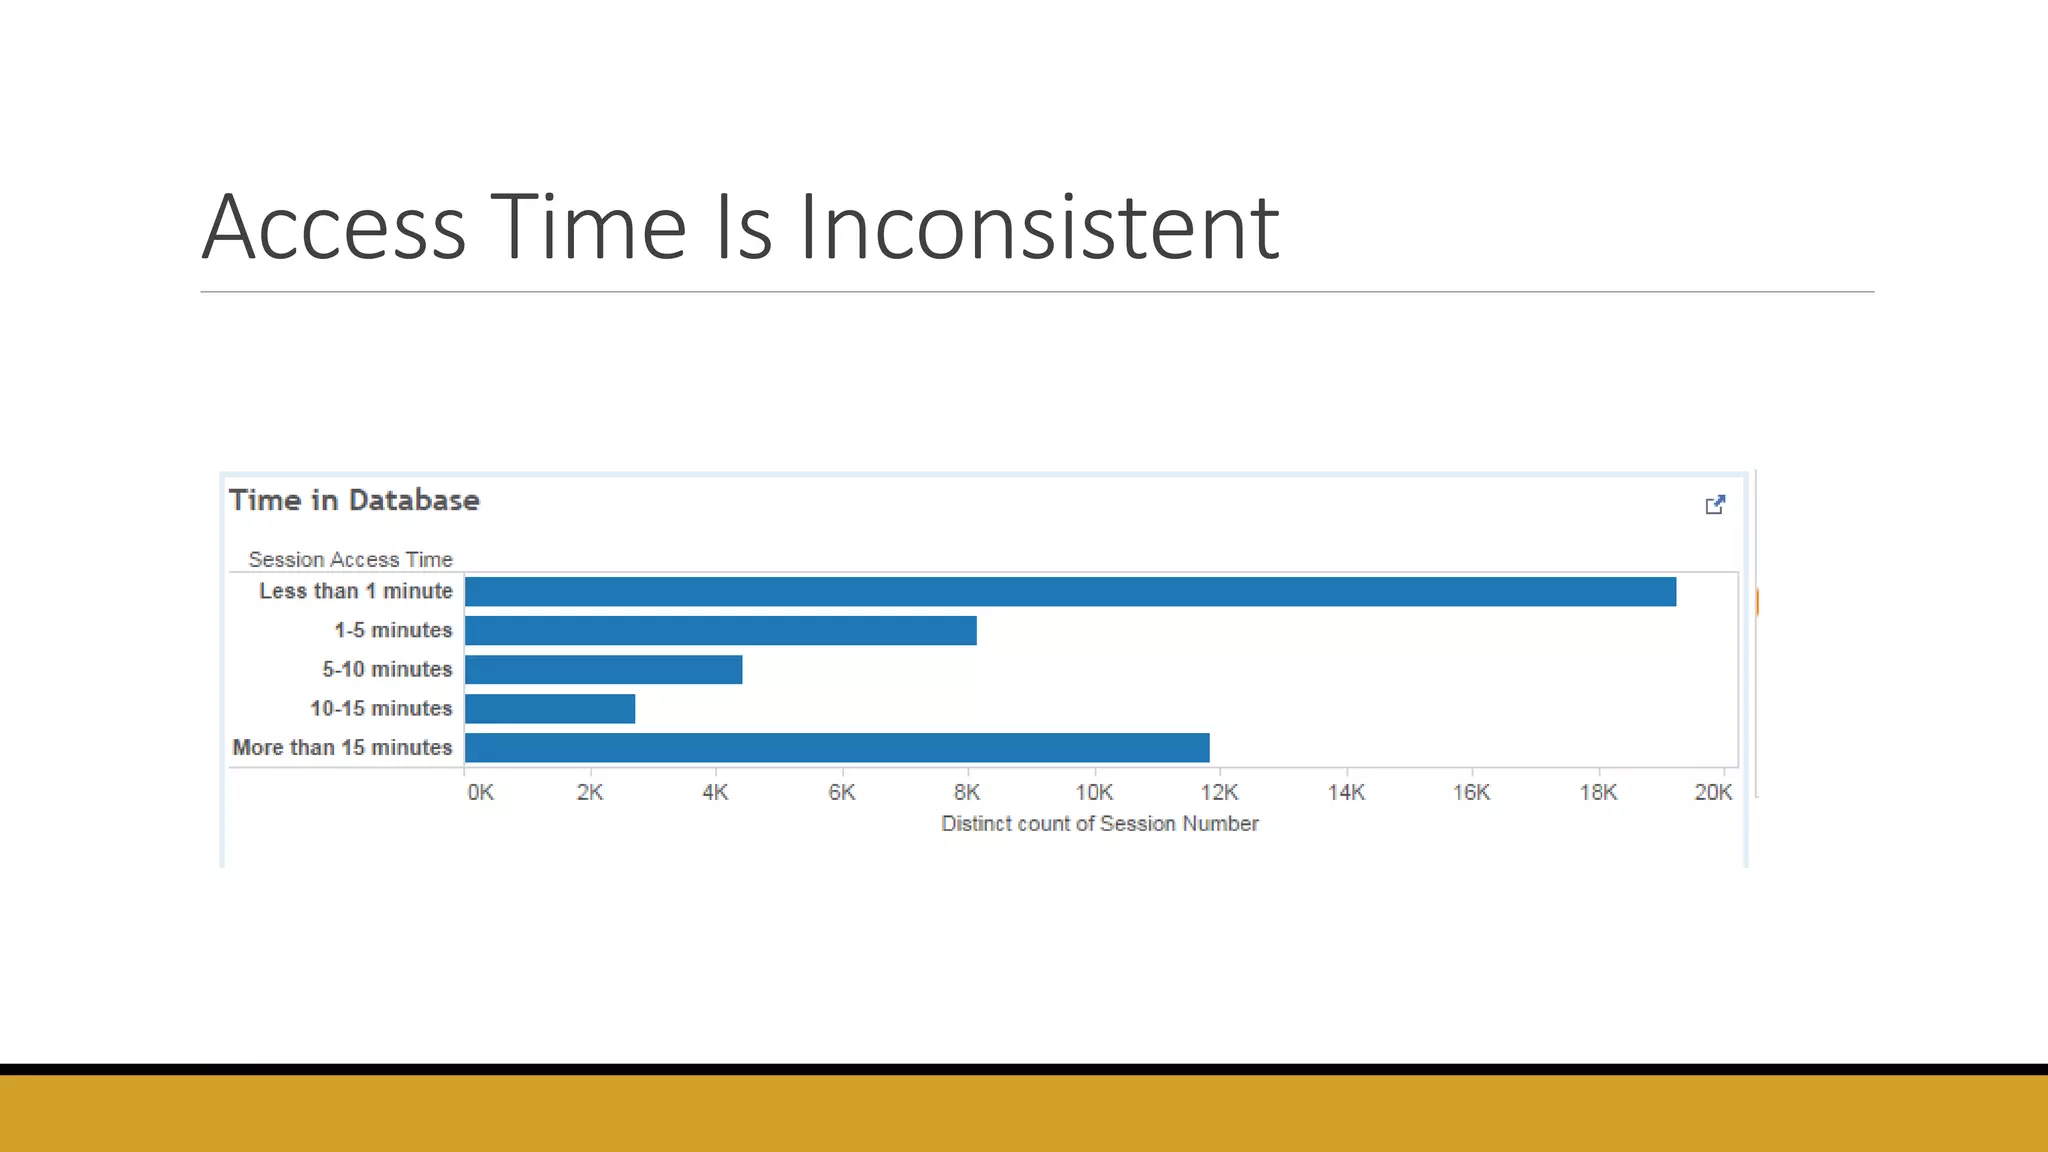
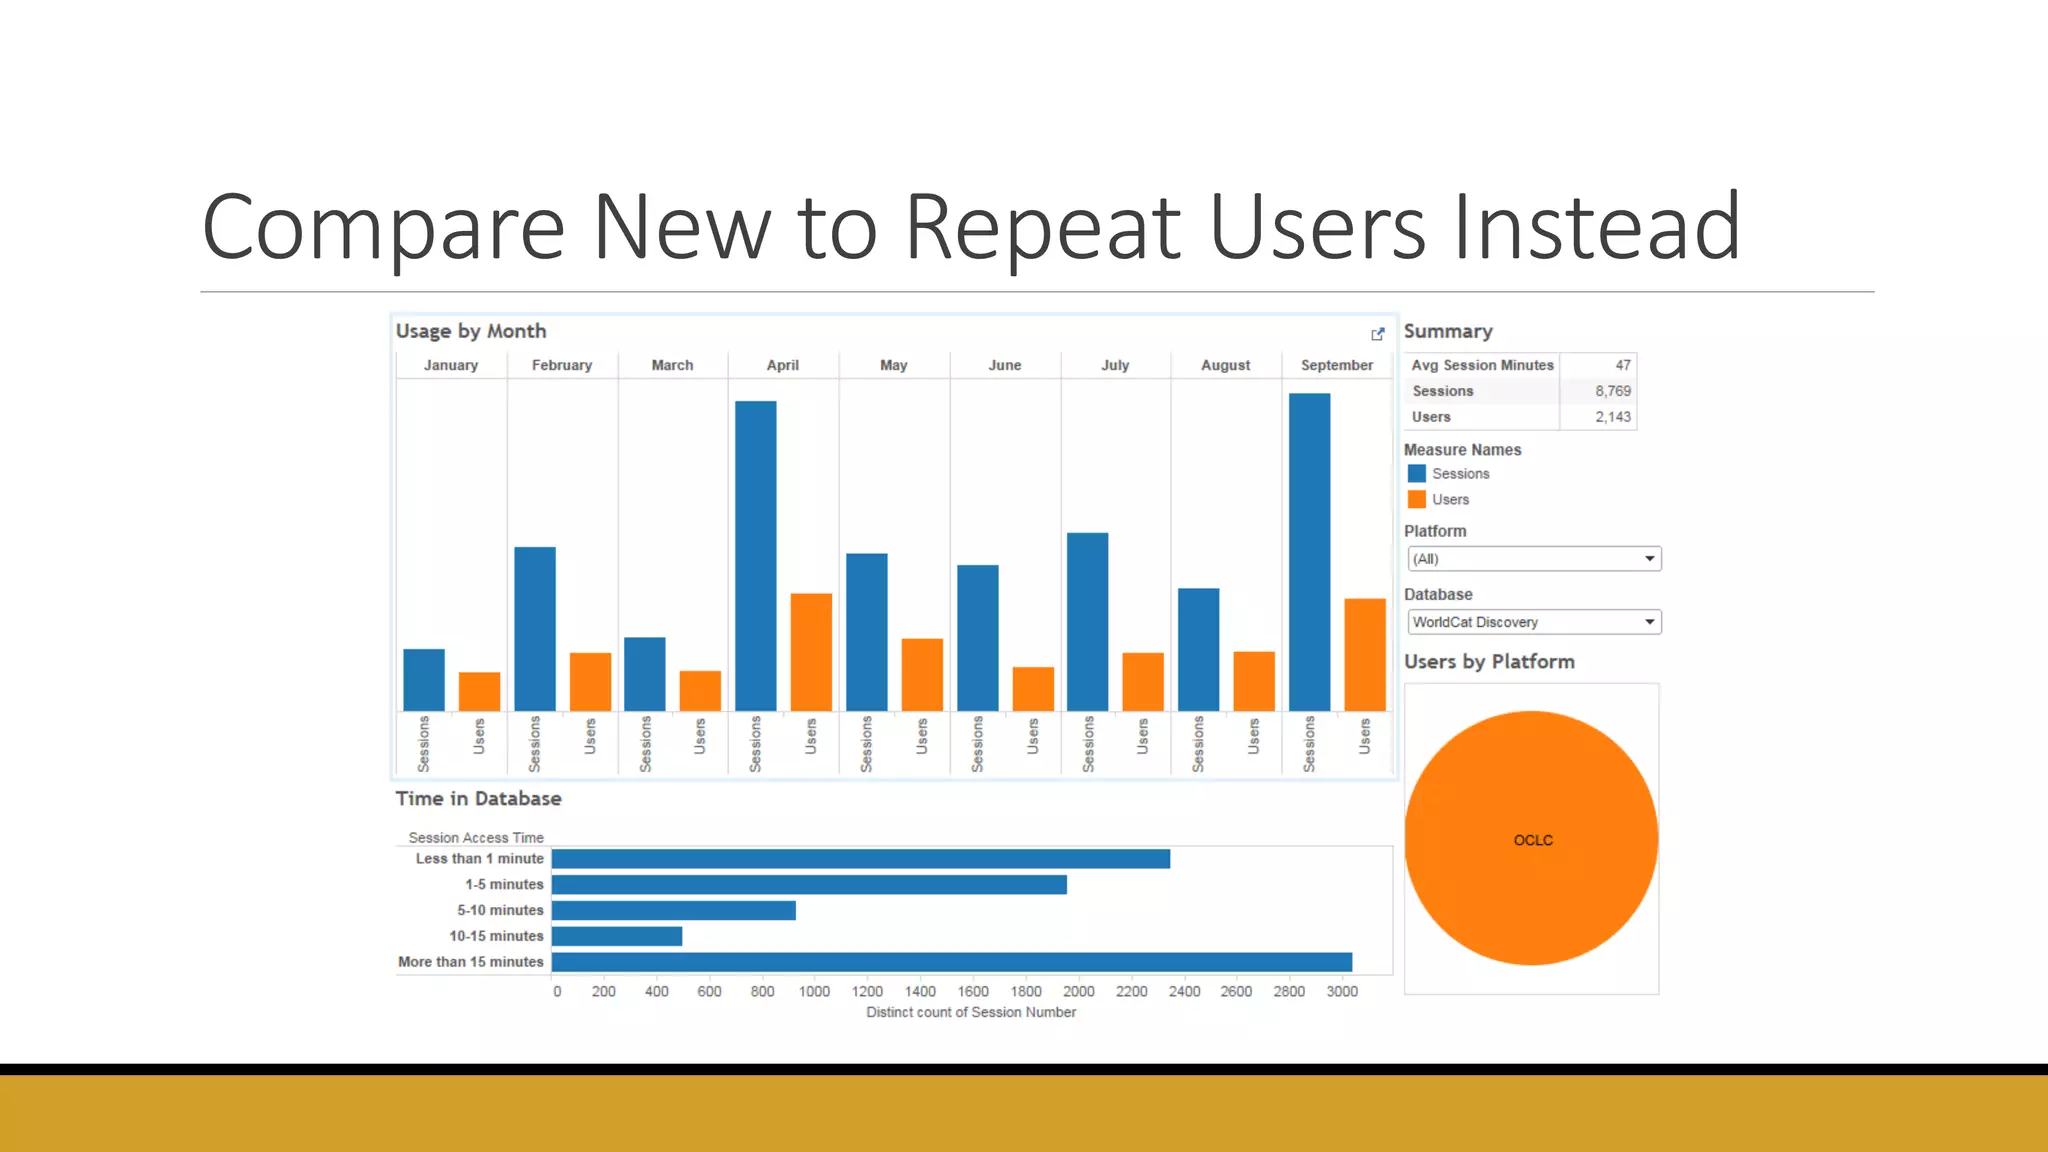
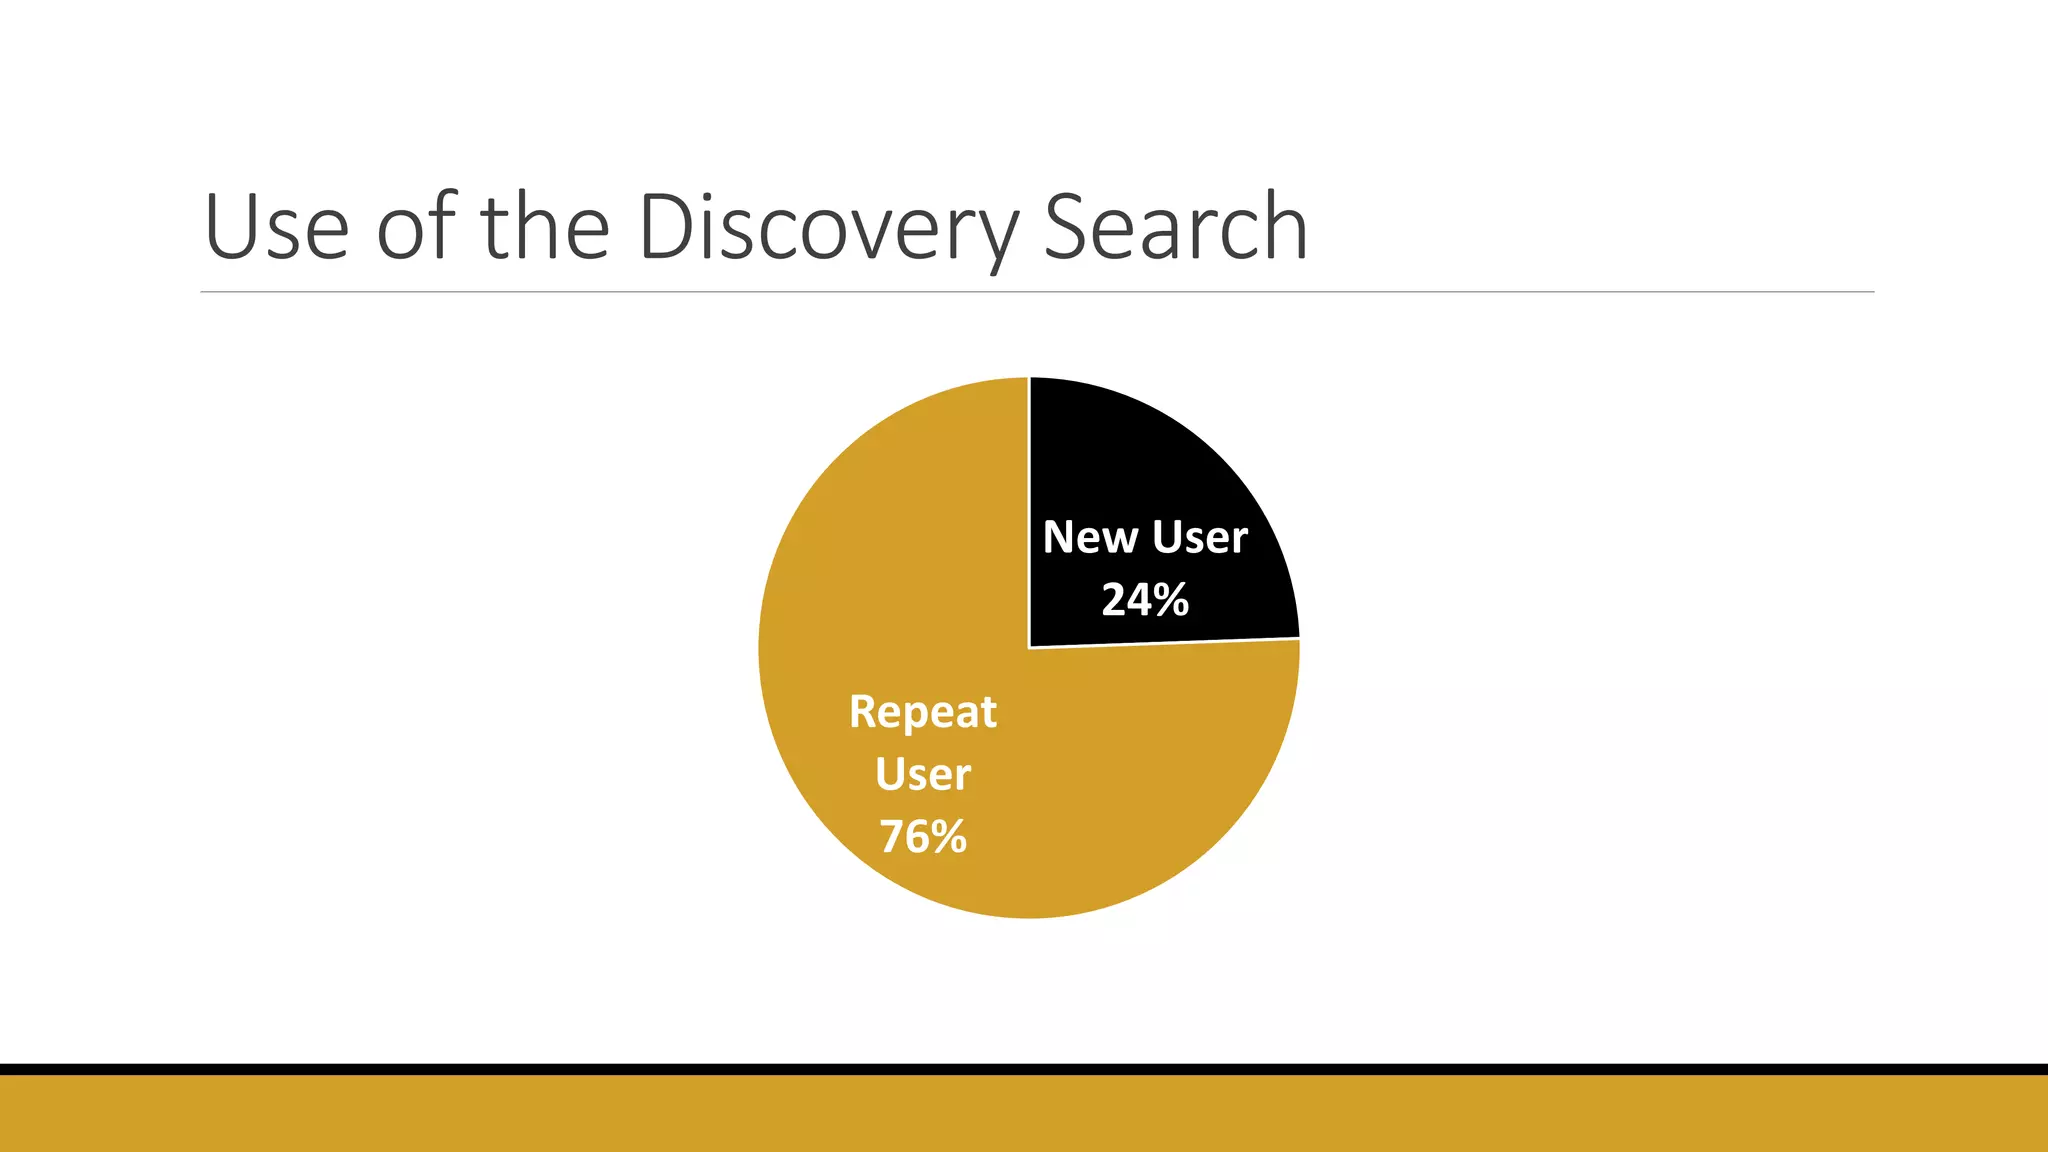
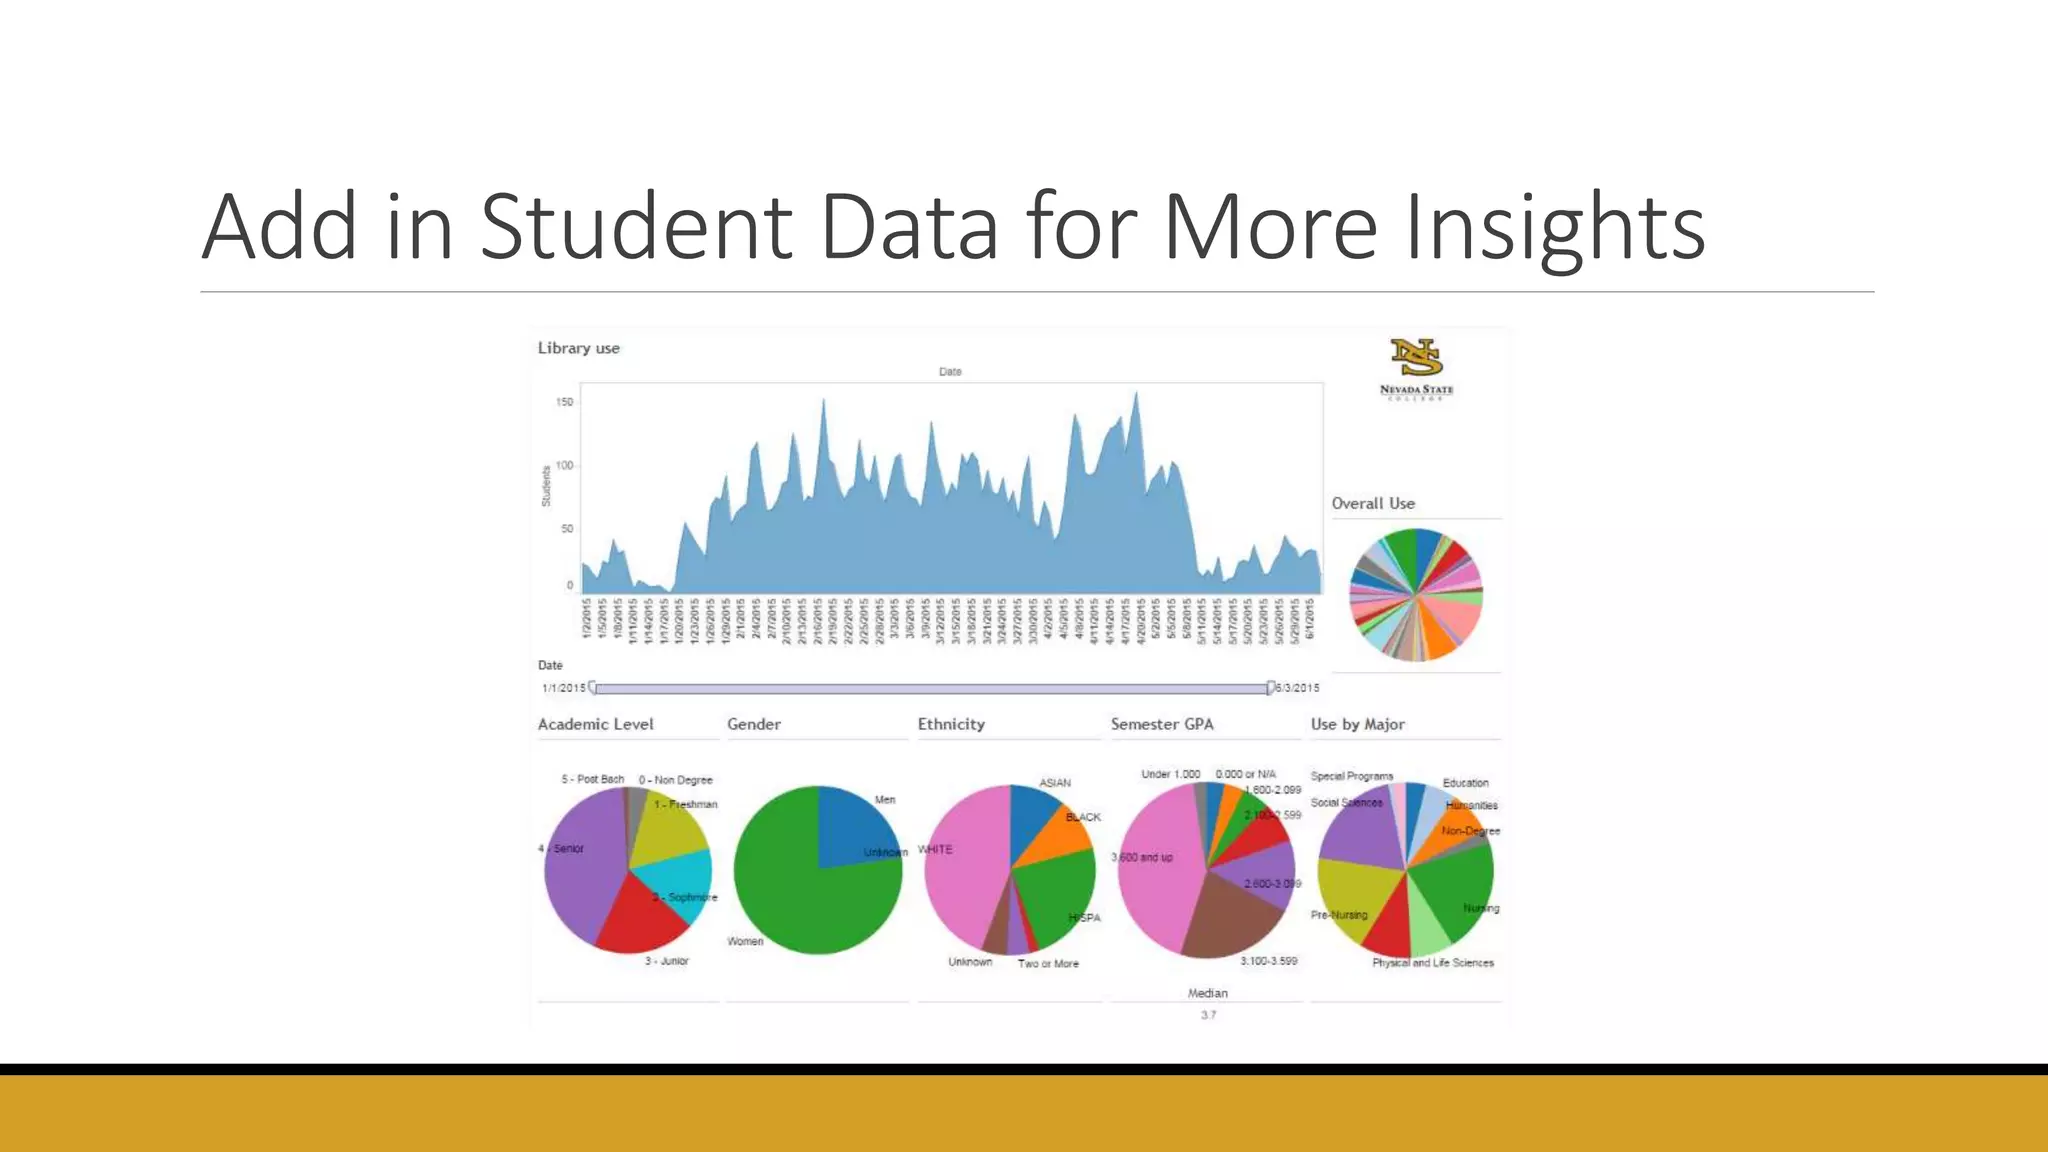
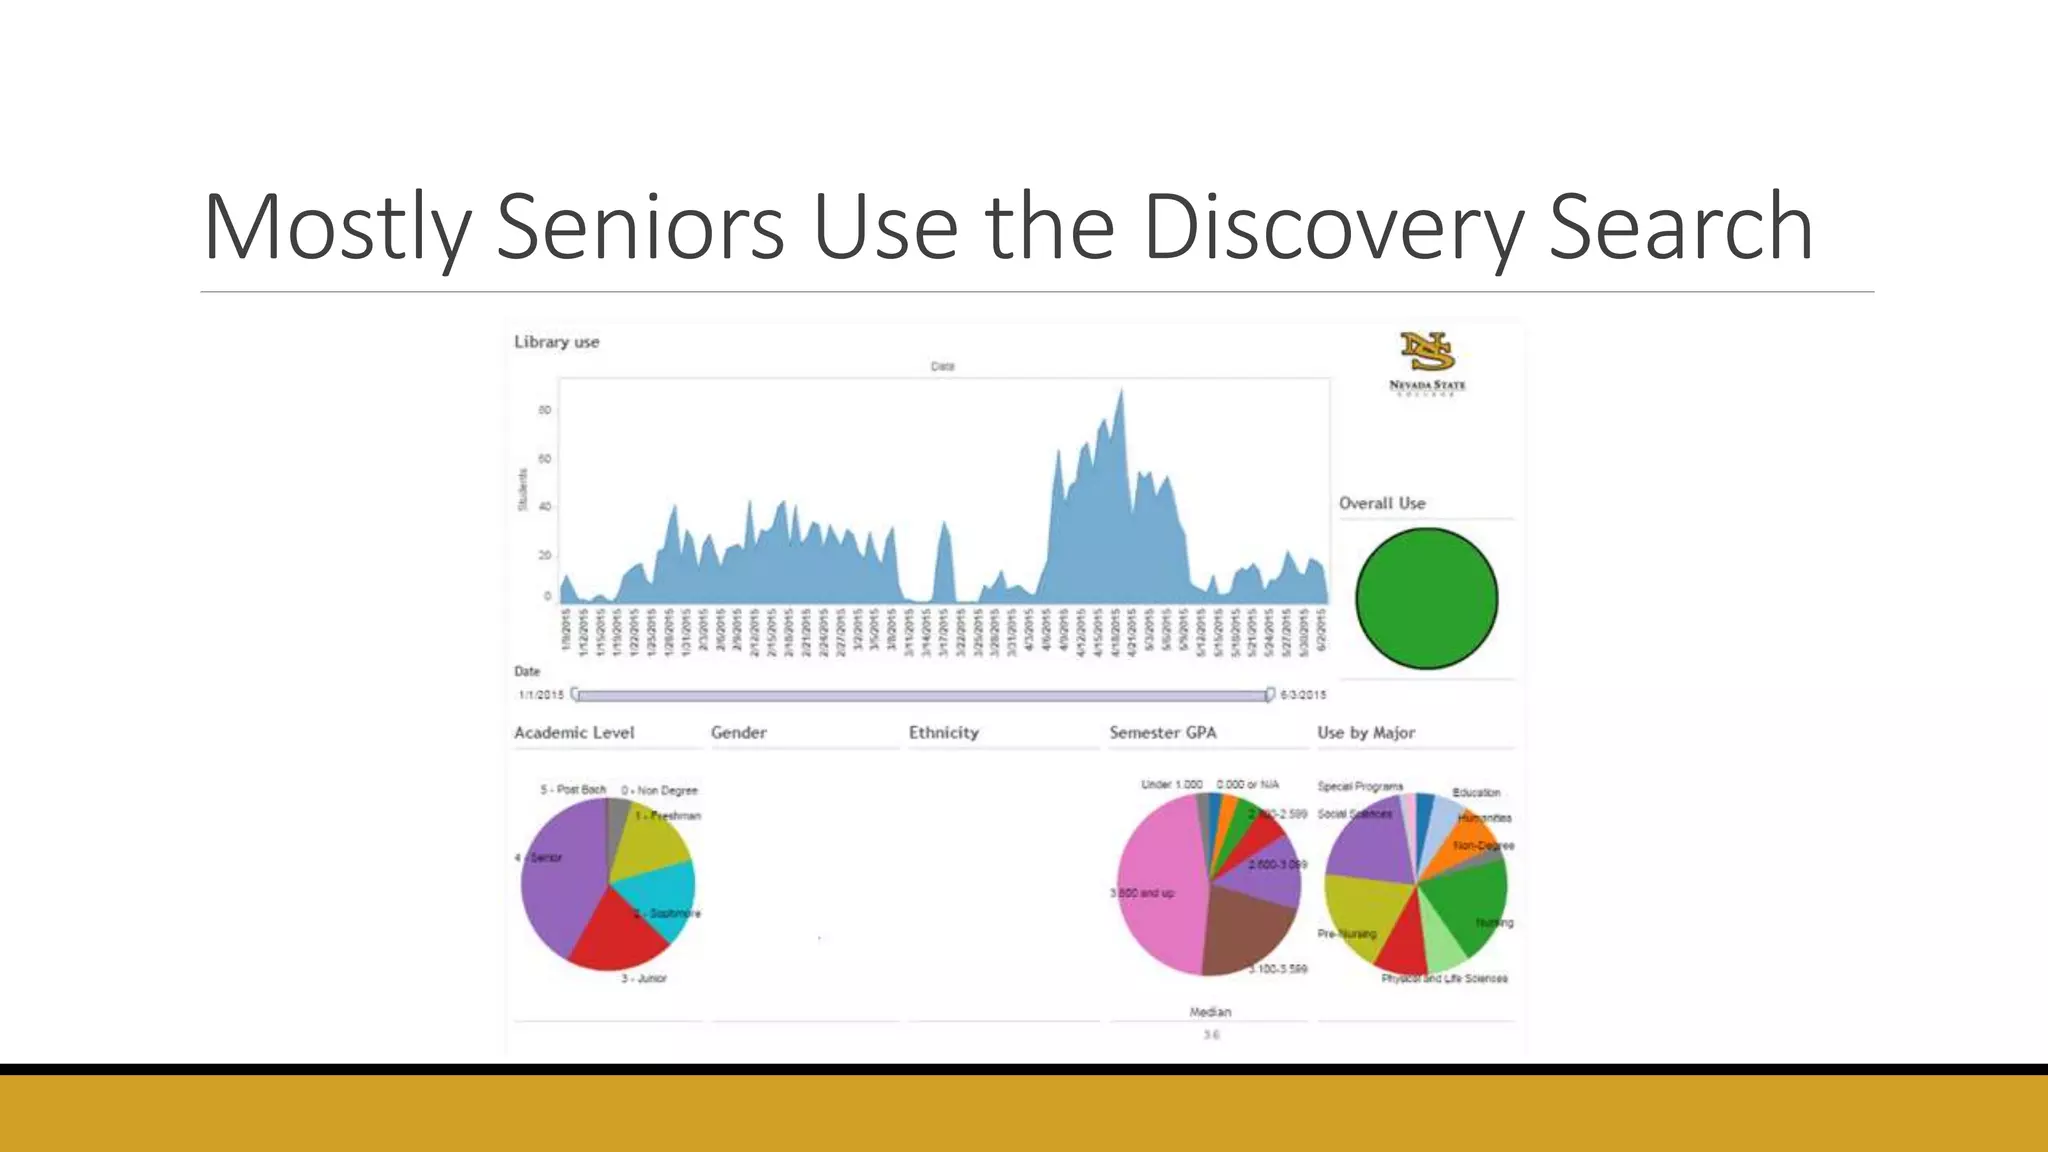
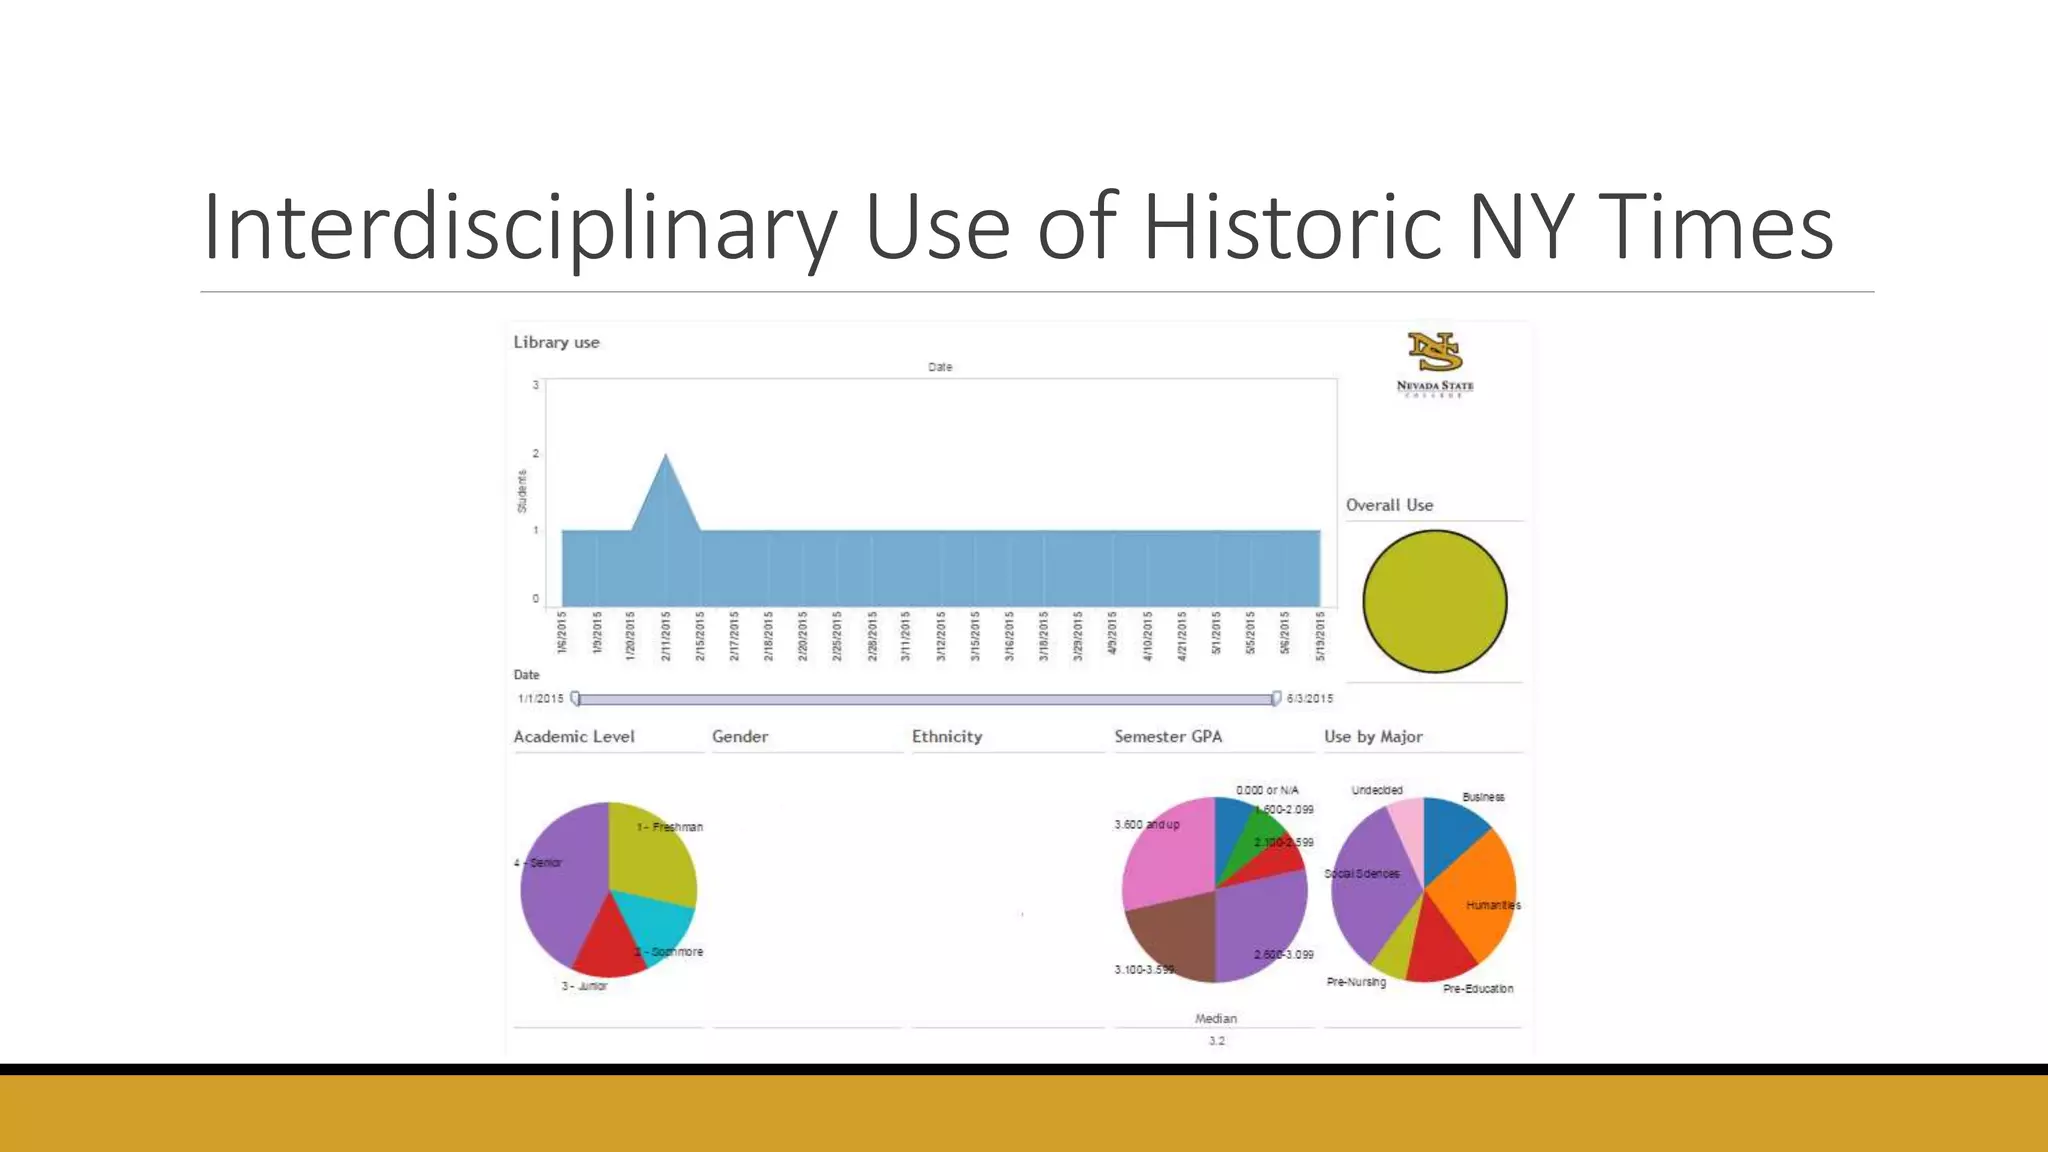
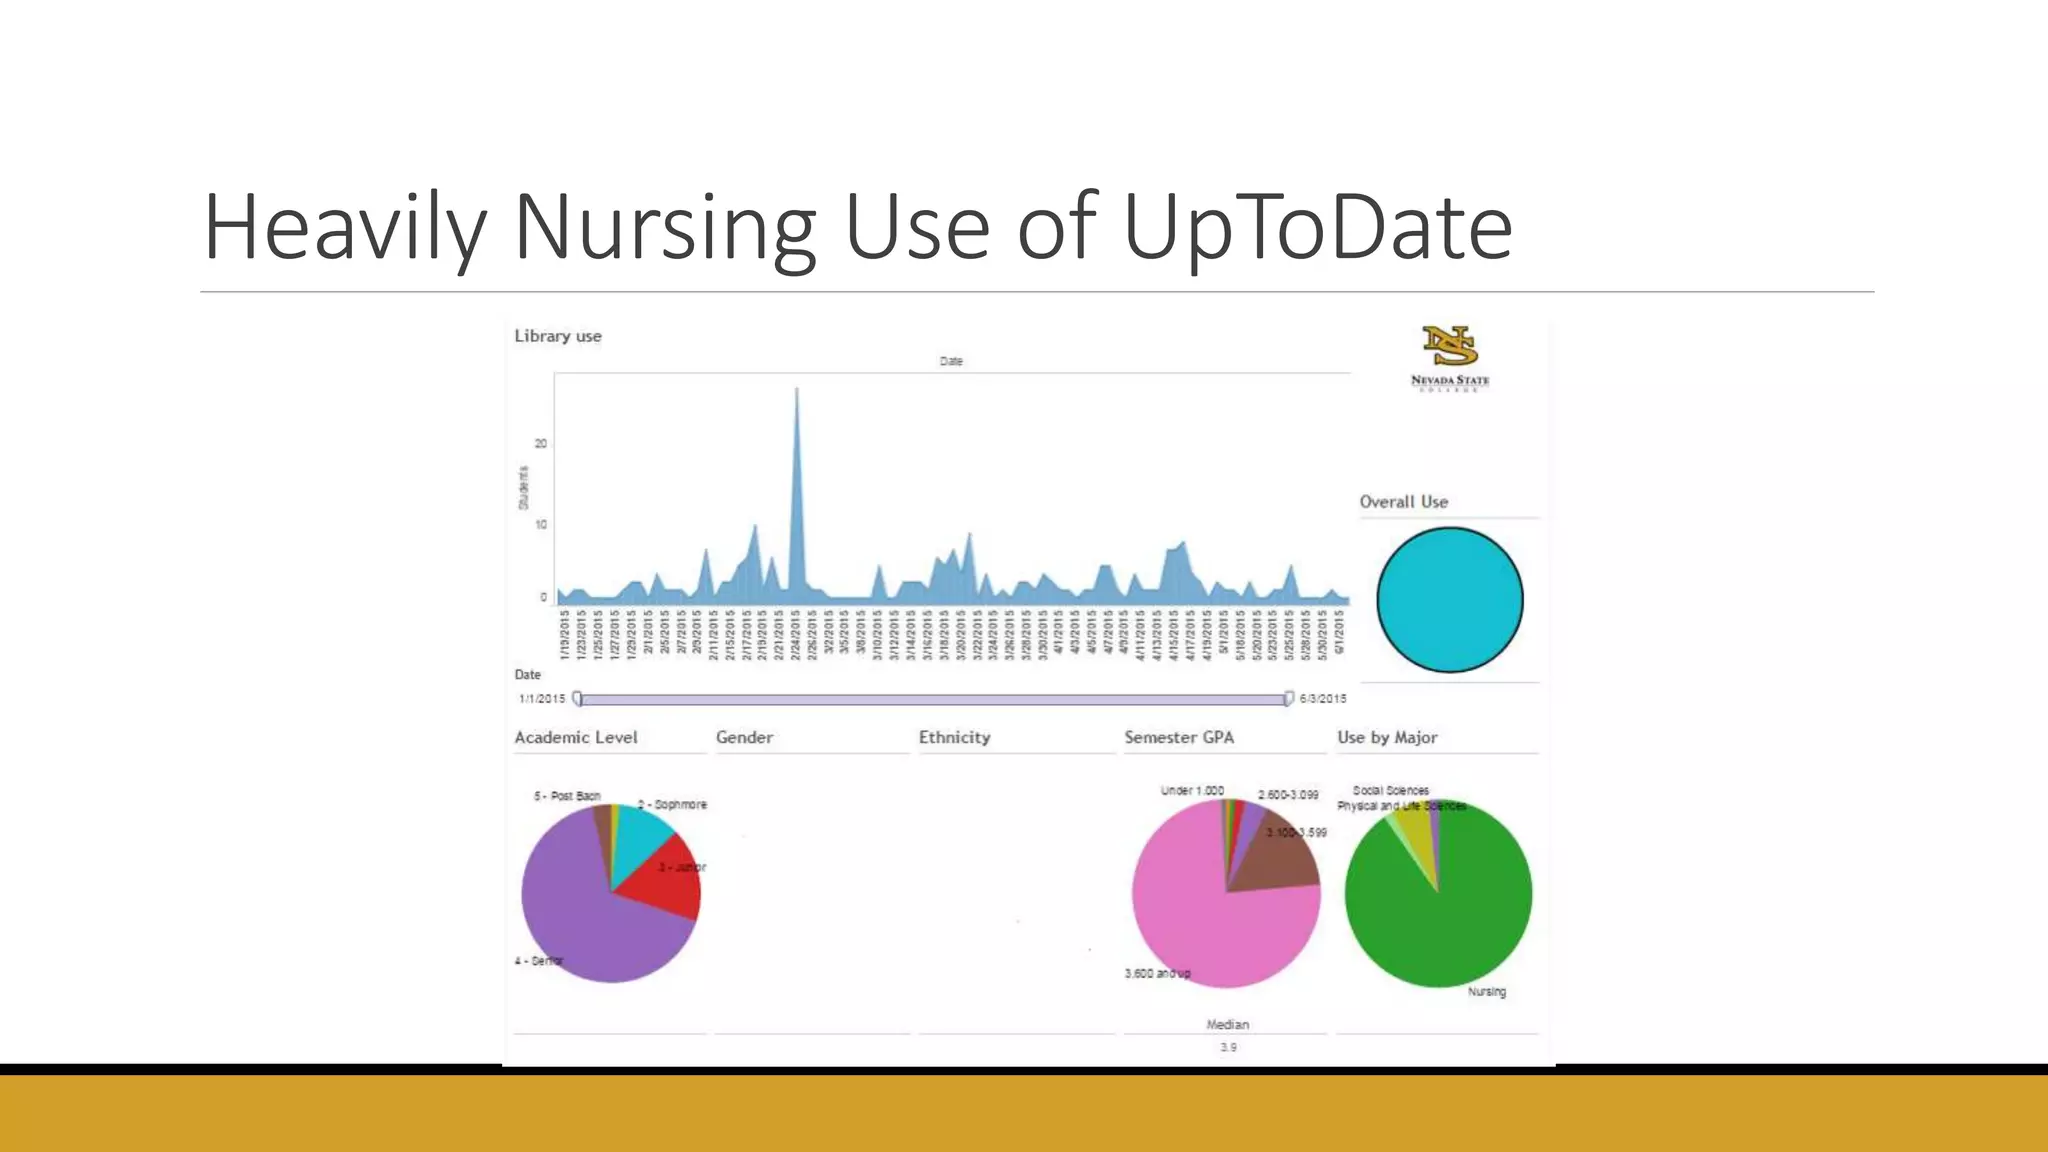
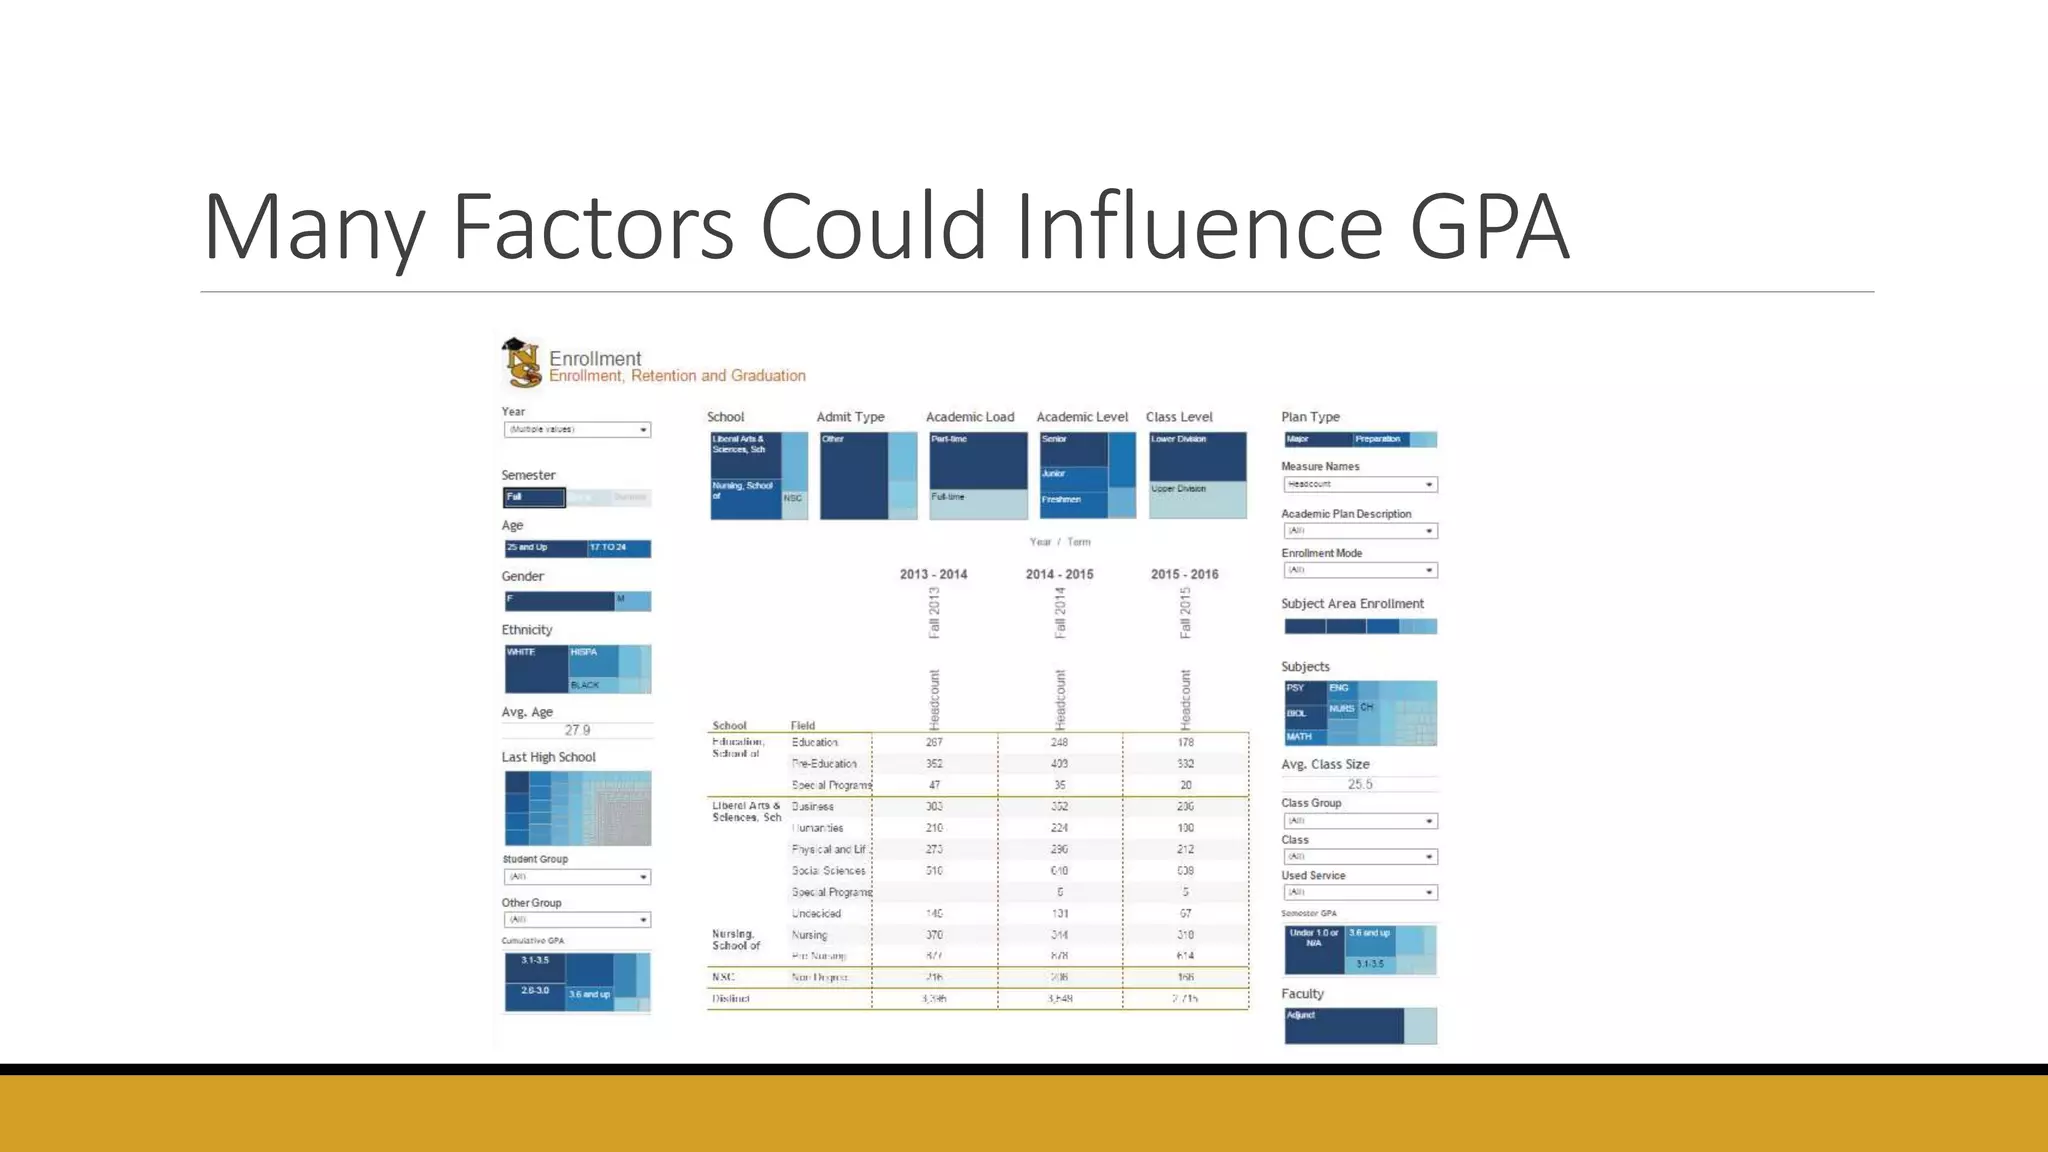
Cost Per User
Analyzing EZProxy Logs For Collection Development
Tiffany LeMaistre
2015 Charleston Conference
About Nevada State College
First
Generation
Proxy What?
WHAT IT MEANS AND HOW WE DO IT
Proxy What?
• EZProxy is OCLC’s authentication system for
library resources
• EZProxy logs are web logs that can be setup to
store and save usage data
• Those log files can be compared with student
data using the username as a match point
Library
Information &
Technology Services
Institutional
Research
Why Cost Per User?
THAT SEEMS LIKE A LOT OF WORK FOR ANOTHER CPU SPREADSHEET
Why Cost Per User?
• True comparison
• Available for every resource
• No concerns about:
• Missing data
• Unclear standards of measurement
• Estimates based on incomplete information
Live Data Demo
HTTP://BIT.LY/NSCLIBUSE
Online Resource Use in Tableau
Select Filters to Change Display
Collect Use That Vendors Don’t Provide
Collect Use of Open Access Resources
Compare Non-COUNTER Resources
Why Cost Per User?
• Is the library achieving economies of scale?
• Is the resource core or supplemental?
• What are the characteristics of users?
• Interdisciplinary or discipline-specific
• Students or faculty
• Freshman or seniors
• GPA, grades on research assignments
Users
Value
Cost
ROI with Individual Subscriptions
Why Cost Per User?
• Is the library achieving economies of scale?
• Is the resource core or supplemental?
• What are the characteristics of users?
• Interdisciplinary or discipline-specific
• Students or faculty
• Freshman or seniors
• GPA, grades on research assignments
Users
Value
Cost
Access Time Is Inconsistent
Compare New to Repeat Users Instead
Use of the Discovery Search
New User
24%
Repeat
User
76%
Why Cost Per User?
• Is the library achieving economies of scale?
• Is the resource core or supplemental?
• What are the characteristics of users?
• Interdisciplinary or discipline-specific
• Students or faculty
• Freshman or seniors
• GPA, grades on research assignments
Users
Value
Cost
Add in Student Data for More Insights
Mostly Seniors Use the Discovery Search
Interdisciplinary Use of Historic NY Times
Heavily Nursing Use of UpToDate
Many Factors Could Influence GPA
Learn More
University of Minnesota
Citations
Collins, E., & Stone, G. (2014). Understanding patterns of library use among undergraduate students from different disciplines. Evidence
Based Library and Information Practice, 9(3), 51–67.
Cox, B., & Jantti, M. (2012a). Capturing business intelligence required for targeted marketing, demonstrating value, and driving process
improvement. Deputy Vice-Chancellor (Education) - Papers. http://doi.org/10.1016/j.lisr.2012.06.002
Cox, B., & Jantti, M. (2012b, July 18). Discovering the Impact of Library Use and Student Performance. Retrieved from
http://www.educause.edu/ero/article/discovering-impact-library-use-and-student-performance
Fransen, J. (2013). How do Engineering Students and Faculty use Library Resources? American Society for Engineering Education.
Retrieved from http://conservancy.umn.edu/handle/11299/151819
Haddow, G., & Joseph, J. (2010). Loans, Logins, and Lasting the Course: Academic Library Use and Student Retention. Australian Academic
& Research Libraries, 41(4), 233–244.
Jantti, M., & Cox, B. (2011). Measuring the value of library resources and student academic performance through relational datasets.
Deputy Vice-Chancellor (Education) - Papers. Retrieved from http://ro.uow.edu.au/asdpapers/121
JISC. (2015). Library Analytics and Metrics Project. Retrieved February 9, 2015, from http://jisclamp.mimas.ac.uk/
JISC, & University of Huddersfield. (n.d.). Library Impact Data Project. Retrieved February 7, 2015, from
https://library3.hud.ac.uk/blogs/lidp/
Citations
Magnuson, L., & Davis, R. C. (2014, October 29). Analyzing EZProxy Logs. Retrieved from http://acrl.ala.org/techconnect/?p=4684
Nackerud, S., Fransen, J., Peterson, K., & Mastel, K. (2013). Analyzing Demographics: Assessing Library Use Across the Institution. Portal:
Libraries and the Academy, 13(2). Retrieved from
http://muse.jhu.edu/journals/portal_libraries_and_the_academy/v013/13.2.nackerud.html
Nevada State College. (2014). Nevada State College: Facts & Figures. Retrieved February 13, 2015, from http://nsc.nevada.edu/2069.asp
Oakleaf, M. (2010). The Value of Academic Libraries: A Comprehensive Research Review and Report. Chicago, IL: Association of College and
Research Libraries. Retrieved from http://www.ala.org/acrl/sites/ala.org.acrl/files/content/issues/value/val_report.pdf
OCLC. (2015). Log File Analysis. Retrieved February 13, 2015, from
http://www.oclc.org/support/services/ezproxy/documentation/loganalysis.en.html
Sharkey, M., & Thanki, S. (2014, November). How It’s Made: Predictive Analytics. Panel Presentation presented at the WCET 2014 Annual
Conference, Portland, Oregon. Retrieved from http://wcetconference.wiche.edu/session/how-it%E2%80%99s-made-predictive-analytics
Soria, K., Fransen, J., & Nackerud, S. (2013). Library Use and Undergraduate Student Outcomes: New Evidence for Students’ Retention and
Academic Success. Portal, 13(2), 147–164.
Soria, K. M. (2013). Factors Predicting the Importance of Libraries and Research Activities for Undergraduates. The Journal of Academic
Librarianship, 39(6), 464–470. http://doi.org/10.1016/j.acalib.2013.08.017
Citations
Stone, G., & Collins, E. (2013). Library usage and demographic characteristics of undergraduate students in a UK university. Performance
Measurement and Metrics, 14(1), 25–35. http://doi.org/10.1108/14678041311316112
Stone, G., Ramsden, B., & Pattern, D. (2011a). Library Impact Data Project Toolkit (p. 15). University of Huddersfield. Retrieved from
http://eprints.hud.ac.uk/11571/1/Toolkit_final.pdf
Stone, G., Ramsden, B., & Pattern, D. (2011b). Looking for the Link Between Library Usage and Student Attainment. Ariadne, (67).
Retrieved from http://www.ariadne.ac.uk/issue67/stone-et-al
The Chronicle of Higher Education. (n.d.). Retrieved November 3, 2015, from https://chronicle.com/subscribe/?PK=M1224
University of Minnesota Libraries. (n.d.). Library Data and Student Success. Retrieved February 7, 2015, from
http://blog.lib.umn.edu/ldss/
White, S., & Stone, G. (2010). Maximizing use of library resources at the University of Huddersfield: Based on a breakout session held at
the 33rd UKSG Conference, Edinburgh, April 2010. Serials: The Journal for the Serials Community, 23(2), 83–90.
http://doi.org/10.1629/2383
Whitmire, E. (2003). Cultural diversity and undergraduates’ academic library use. The Journal of Academic Librarianship, 29(3), 148–161.
http://doi.org/10.1016/S0099-1333(03)00019-3
Wong, S. H. R., & Webb, T. D. (2011). Uncovering Meaningful Correlation between Student Academic Performance and Library Material
Usage. College & Research Libraries, 72(4), 361–370. http://doi.org/10.5860/crl-129
Tiffany LeMaistre
Electronic Resources and Discovery Librarian
Nevada State College
Marydean Martin Library
E-mail: tiffany.lemaistre@nsc.edu
Phone: (702) 992-2807

Cost Per User

  • 1.
    Cost Per User AnalyzingEZProxy Logs For Collection Development Tiffany LeMaistre 2015 Charleston Conference
  • 2.
    About Nevada StateCollege First Generation
  • 3.
    Proxy What? WHAT ITMEANS AND HOW WE DO IT
  • 4.
    Proxy What? • EZProxyis OCLC’s authentication system for library resources • EZProxy logs are web logs that can be setup to store and save usage data • Those log files can be compared with student data using the username as a match point Library Information & Technology Services Institutional Research
  • 5.
    Why Cost PerUser? THAT SEEMS LIKE A LOT OF WORK FOR ANOTHER CPU SPREADSHEET
  • 6.
    Why Cost PerUser? • True comparison • Available for every resource • No concerns about: • Missing data • Unclear standards of measurement • Estimates based on incomplete information
  • 7.
  • 8.
  • 9.
    Select Filters toChange Display
  • 10.
    Collect Use ThatVendors Don’t Provide
  • 11.
    Collect Use ofOpen Access Resources
  • 12.
  • 13.
    Why Cost PerUser? • Is the library achieving economies of scale? • Is the resource core or supplemental? • What are the characteristics of users? • Interdisciplinary or discipline-specific • Students or faculty • Freshman or seniors • GPA, grades on research assignments Users Value Cost
  • 14.
    ROI with IndividualSubscriptions
  • 15.
    Why Cost PerUser? • Is the library achieving economies of scale? • Is the resource core or supplemental? • What are the characteristics of users? • Interdisciplinary or discipline-specific • Students or faculty • Freshman or seniors • GPA, grades on research assignments Users Value Cost
  • 16.
    Access Time IsInconsistent
  • 17.
    Compare New toRepeat Users Instead
  • 18.
    Use of theDiscovery Search New User 24% Repeat User 76%
  • 19.
    Why Cost PerUser? • Is the library achieving economies of scale? • Is the resource core or supplemental? • What are the characteristics of users? • Interdisciplinary or discipline-specific • Students or faculty • Freshman or seniors • GPA, grades on research assignments Users Value Cost
  • 20.
    Add in StudentData for More Insights
  • 21.
    Mostly Seniors Usethe Discovery Search
  • 22.
    Interdisciplinary Use ofHistoric NY Times
  • 23.
  • 24.
    Many Factors CouldInfluence GPA
  • 25.
  • 26.
    Citations Collins, E., &Stone, G. (2014). Understanding patterns of library use among undergraduate students from different disciplines. Evidence Based Library and Information Practice, 9(3), 51–67. Cox, B., & Jantti, M. (2012a). Capturing business intelligence required for targeted marketing, demonstrating value, and driving process improvement. Deputy Vice-Chancellor (Education) - Papers. http://doi.org/10.1016/j.lisr.2012.06.002 Cox, B., & Jantti, M. (2012b, July 18). Discovering the Impact of Library Use and Student Performance. Retrieved from http://www.educause.edu/ero/article/discovering-impact-library-use-and-student-performance Fransen, J. (2013). How do Engineering Students and Faculty use Library Resources? American Society for Engineering Education. Retrieved from http://conservancy.umn.edu/handle/11299/151819 Haddow, G., & Joseph, J. (2010). Loans, Logins, and Lasting the Course: Academic Library Use and Student Retention. Australian Academic & Research Libraries, 41(4), 233–244. Jantti, M., & Cox, B. (2011). Measuring the value of library resources and student academic performance through relational datasets. Deputy Vice-Chancellor (Education) - Papers. Retrieved from http://ro.uow.edu.au/asdpapers/121 JISC. (2015). Library Analytics and Metrics Project. Retrieved February 9, 2015, from http://jisclamp.mimas.ac.uk/ JISC, & University of Huddersfield. (n.d.). Library Impact Data Project. Retrieved February 7, 2015, from https://library3.hud.ac.uk/blogs/lidp/
  • 27.
    Citations Magnuson, L., &Davis, R. C. (2014, October 29). Analyzing EZProxy Logs. Retrieved from http://acrl.ala.org/techconnect/?p=4684 Nackerud, S., Fransen, J., Peterson, K., & Mastel, K. (2013). Analyzing Demographics: Assessing Library Use Across the Institution. Portal: Libraries and the Academy, 13(2). Retrieved from http://muse.jhu.edu/journals/portal_libraries_and_the_academy/v013/13.2.nackerud.html Nevada State College. (2014). Nevada State College: Facts & Figures. Retrieved February 13, 2015, from http://nsc.nevada.edu/2069.asp Oakleaf, M. (2010). The Value of Academic Libraries: A Comprehensive Research Review and Report. Chicago, IL: Association of College and Research Libraries. Retrieved from http://www.ala.org/acrl/sites/ala.org.acrl/files/content/issues/value/val_report.pdf OCLC. (2015). Log File Analysis. Retrieved February 13, 2015, from http://www.oclc.org/support/services/ezproxy/documentation/loganalysis.en.html Sharkey, M., & Thanki, S. (2014, November). How It’s Made: Predictive Analytics. Panel Presentation presented at the WCET 2014 Annual Conference, Portland, Oregon. Retrieved from http://wcetconference.wiche.edu/session/how-it%E2%80%99s-made-predictive-analytics Soria, K., Fransen, J., & Nackerud, S. (2013). Library Use and Undergraduate Student Outcomes: New Evidence for Students’ Retention and Academic Success. Portal, 13(2), 147–164. Soria, K. M. (2013). Factors Predicting the Importance of Libraries and Research Activities for Undergraduates. The Journal of Academic Librarianship, 39(6), 464–470. http://doi.org/10.1016/j.acalib.2013.08.017
  • 28.
    Citations Stone, G., &Collins, E. (2013). Library usage and demographic characteristics of undergraduate students in a UK university. Performance Measurement and Metrics, 14(1), 25–35. http://doi.org/10.1108/14678041311316112 Stone, G., Ramsden, B., & Pattern, D. (2011a). Library Impact Data Project Toolkit (p. 15). University of Huddersfield. Retrieved from http://eprints.hud.ac.uk/11571/1/Toolkit_final.pdf Stone, G., Ramsden, B., & Pattern, D. (2011b). Looking for the Link Between Library Usage and Student Attainment. Ariadne, (67). Retrieved from http://www.ariadne.ac.uk/issue67/stone-et-al The Chronicle of Higher Education. (n.d.). Retrieved November 3, 2015, from https://chronicle.com/subscribe/?PK=M1224 University of Minnesota Libraries. (n.d.). Library Data and Student Success. Retrieved February 7, 2015, from http://blog.lib.umn.edu/ldss/ White, S., & Stone, G. (2010). Maximizing use of library resources at the University of Huddersfield: Based on a breakout session held at the 33rd UKSG Conference, Edinburgh, April 2010. Serials: The Journal for the Serials Community, 23(2), 83–90. http://doi.org/10.1629/2383 Whitmire, E. (2003). Cultural diversity and undergraduates’ academic library use. The Journal of Academic Librarianship, 29(3), 148–161. http://doi.org/10.1016/S0099-1333(03)00019-3 Wong, S. H. R., & Webb, T. D. (2011). Uncovering Meaningful Correlation between Student Academic Performance and Library Material Usage. College & Research Libraries, 72(4), 361–370. http://doi.org/10.5860/crl-129
  • 29.
    Tiffany LeMaistre Electronic Resourcesand Discovery Librarian Nevada State College Marydean Martin Library E-mail: tiffany.lemaistre@nsc.edu Phone: (702) 992-2807

Editor's Notes

  • #2 Tiffany LeMaistre – Electronic Resources and Discovery Librarian at Nevada State College
  • #3 Nevada State College founded in 2002 One of the fastest growing higher ed institutions in the country and the fastest growing in the state, currently 3,400 students Diverse and committed to helping traditionally underserved students succeed Strong institutional focus on using data in predictive analytics and proactively recommend services positively correlated with student success – the library wants to be a part of that institutional project The Marydean Martin Library is the first completely digital library in the state of Nevada – 4 librarians and 2 full time staff members
  • #5 NSC Uses EZProxy to mediate on and off-campus access Most libraries collect brief logs for security or troubleshooting. NSC collects a detailed log file with the user id of people accessing library resources, referring URLs, and which resources are being accessed With that data alone you can calculate cost per user, but in order to take it a step further we partnered with IT and IR departments to compare EZProxy log data with student data. IT’s Kat Mulvey created a Powershell Script to parse our logs for SQL Upload. A SQL database with student data is managed by Mick Haney in the Office of Institutional Research and library data is added into it. Sandip Thanki creates a visualization in Tableau that includes student data points. With this workflow the library has access to anonymized data in the aggregate (i.e., 35 nursing students with a GPA above 3.5, NOT Jane Doe with a GPA of 2.8 accessed WorldCat Discovery on October 5th)
  • #6 Many institutions are concerned about the effort/possibility of developing these campus partnerships and the difficulty of analyze the log files. Is it worth it?
  • #7 Even without partnerships proxy log analysis can offer a lot that anonymous usage statistics do not. First – they are a true comparison. Not all resources are COUNTER compliant and even among those that are there are nuances (i.e., BR1 title requests vs BR2 section requests) User and session counts from EZProxy measure all resources on the same standard.
  • #9 This dashboard was created with proxy log data only, it did not require any matching from the process involving IT and IR departments.
  • #10 In the live dashboard you can select filters or dropdown menus to change what data is being displayed
  • #11 You can use proxy data to collect use for resources that don’t provide any statistics from the vendor NSC may have cancelled the NCTE journals package if it weren’t for this evidence of use.
  • #12 You can collect use of open access resources by proxying the links anywhere that the library manages access (i.e., in the library catalog, discovery, knowledgebase, or website listings). This gives a sense of return on investment for the work of managing these resources.
  • #13 You can compare resources that provide statistics but not COUNTER statistics to other resources using the same metric.
  • #14 Beyond the true comparison, there are many other advantages of looking at use from the user rather than the retrieval perspective.
  • #15 Comparing to individual subscription costs rather than ILL costs may be more palatable to administrators when you can say something like the library saved students and faculty more than $5,000 rather than the library was very efficient with subscription budgets.
  • #16 A couple of ways to look at whether a resource is core or supplemental based on the usage patterns of users over time.
  • #17 First attempt was looking at access time, but this statistic can’t be compared consistently because users don’t “log out” of EZProxy and some platforms create more activity in the log file than others. Also it is unclear what a “good” access time is when you consider the high variability in the statistic and the contribution of activities like researching in one database and linking to the full text in another via the link resolver.
  • #18 Comparing user to session counts is more consistent.
  • #19 You can get an idea of repeat vs new users, and may even be able to take it a step further looking at users who used a resource 1, 2-5 times, 5-10, etc.
  • #20 The real power though is in comparing to user data.
  • #21 This dashboard was created by our Director of Institutional Research. It shows the characteristics of library users so we can determine if they are representative of the campus population as whole or if some groups are underrepresented in library users.
  • #22 Limiting on the overall use pie chart can show the characteristics for one database or resource. The Gender and Ethnicity pie charts have been removed from the following screenshots as they are not relevant to the collection development analysis presented.
  • #25 Many other campus dashboards are used to show how different factors influence student success. Ultimately, we want to see if there is a positive correlation between library use and student success. In the spring we plan to run a multiple regression analysis with GPA and 1-year retention and graduation rates that will control for many of the factors you see here such as High School GPA, and Academic Load. We are also in the midst of a pilot study with an English 101 class to see if there is a correlation between library use and grades on a research assignment. Plans to present our findings at conferences and through a publication in 2016.
  • #26 Here are a few other institutions doing similar work.
  • #30 Thank you!