This study analyzes the purchase patterns of cosmetic consumers in Kerala, India. It uses a survey of 300 cosmetic shop customers in three major cities. The majority of respondents live in urban areas and are female. Half are college graduates. The study examines demographic characteristics and explores factors like brand, price, and location that influence cosmetic purchases. It aims to understand consumer segments and spending to help cosmetic companies market more effectively to consumers in Kerala.
The Indian Cosmetics Industry is defined as skin care, hair care, color cosmetics, fragrances and oral care segments which stood at an estimated $2.5 billion in 2008 and is expected to grow at 7%, according to an analysis of the sector. Today herbal cosmetics industry is driving growth in the beauty business in India and is expected to grow at a rate of 7% as more people shun chemical products in favor of organic ones.
The Indian Cosmetics Industry is defined as skin care, hair care, color cosmetics, fragrances and oral care segments which stood at an estimated $2.5 billion in 2008 and is expected to grow at 7%, according to an analysis of the sector. Today herbal cosmetics industry is driving growth in the beauty business in India and is expected to grow at a rate of 7% as more people shun chemical products in favor of organic ones.
The word “cosmetics” comes from the Greek word kosmetikos meaning “skilled in adornment/decoration”. The way people wear makeup and the reasons why they wear it have changed dramatically over time and through different cultures.
When a women is buying cosmetic, what all are the points that she keeps in mind?
Read and you will know!
A brief study on the consumer behavior when it comes to cosmetics.
With its evergrowing aspirational consumer base and high awareness of Brands, India is a very lucrative market for the business of beauty and wellness. As Market Entry Consultants for beauty brands, we ensure that you make informed decisions and optimize your investments in this challenging market. We also extend online and offline brand building marketing services through digital presence and activations. Call us now to know more.
This project is made in 2018. I have tried to make it as latest as possible about the product and promotion mix about Lakme. Marketing assignment. You can find its all product and services and how marketing tools are used in it.
SUPPLY CHAIN MANAGEMENT AND CONSUMER BEHAVIOUR FOR KARA FACE WIPES, BABY WIPE...SHAHRUKH HAMEED
This study enlightens the supply chain and consumer behaviour. It encompasses intricacies of marketing and supply chain, order booking and supply done by the distributor.
Consumer behaviour and buyer pattern of different product would be examined
Beauty and Cosmetics Products Business OpportunityVenture Advisors
GCC is one of best selling market for Beauty Products. The sales are driven by high per capital income. GCC has very high disposable income. This is prime reason for growth of beauty and cosmetics products in GCC.
This presentation will give you an insight into the great organization "PATANJALI" which is competing with great giants in the FMCG sector and taking a credible amount of their share in the product category in which they are also present.
A STUDY ON CONSUMERS’ PREFERENCE TOWARDS BEAUTY SERVICES IN TIRUCHIRAPALLIIAEME Publication
Earlier days women have been very conscious of their appearance since their existence of youth. Most of them give much importance to their external appearance. They can change their look in various numbers of ways. But today it has changed. Men parlors have overcome women’s parlors. Because of booming beauty conscious among men has increased. However both men and women are always concentrated on their external beauty. In conventional times people used orthodox ways to beautify themselves. Even now the wish is the same, but with different and better tools. Thus, a beauty parlor or salon is a business that deals with the beauty treatment for women and men. This study have accentuated that there are many beauty parlors are available in Trichy but why people prefer particular brand.
A Study on Consumer Behaviour towards Branded Garments am ong Male Shoppersinventionjournals
In the age of identity crisis and need for differentiation, everyone is after uniqueness; particularly h ow one wishes to appear. India is a global market for fashion garments and there is a cut throat competition exi sting among brands. Companies are rigorously working on identifying consumer buying behaviour, preferences, creating awareness, and a positive attitude towards their brands in order to grab larger portion of the market. Therefore, it is become necessary to study the consumer behaviour towards various branded men`s garments. T he study emphasis on how consumer evaluate branded garments on the basis of style, texture, price, colour, adv ertisement and celebrity endorsements, preferences towards branded garments and reasons for purchasing bran ded garments. The researcher has used descriptive research design, conducted study only with 150 respondents from two Engineering college, Bangalore. Statistical tools like measurement of central tendency, Chi-Square ar e used to test and analyse the collected data. Finally, it is revealed that irrespective of age and education levels respondents are buying branded garments to enhance their style, ant to protect their self-respect.
International Journal of Business and Management Invention (IJBMI) is an international journal intended for professionals and researchers in all fields of Business and Management. IJBMI publishes research articles and reviews within the whole field Business and Management, new teaching methods, assessment, validation and the impact of new technologies and it will continue to provide information on the latest trends and developments in this ever-expanding subject. The publications of papers are selected through double peer reviewed to ensure originality, relevance, and readability. The articles published in our journal can be accessed online.
Changing Dynamics of IT and Marketing Teams in the Procurement of Marketing T...Anurag Anwariya
With the increase of digitization in marketing, marketers are steering towards the purchase of technologies which enables them to make informed decisions. Initially marketers in association with their agencies were making the purchase decision of these marketing technologies without defining technical specifications. This ultimately led to the role conflict between IT and Marketing due to implementation challenges and lack of IT compliance. This white paper tries to bring forth the necessary viewpoints on how IT can play a vital role in executing marketing strategies and be the revenue generator of the organization. By collaborating both IT and Marketing teams can define each other’s responsibilities, draw a strategy road map and work towards the shared goal of the organization.
This paper presents an understanding of Personal Care Industry in India. The formal definition of personal care products is presented along with the categorization of personal care products. The paper highlights the consumer’s brand preferences of the Five Personal Care Products ( shaving creams, shaving blades, face cream, hair dye and deodorants). The present study is a sample study based on empirical data. The study is carried out by applying a focus group and survey method. Data for the study was collected from male visitors of different super markets, malls and specialty stores from twin cities of Hyderabad & Secunderabad. The primary data was collected from 1062 male respondents: Out of these 1062 responses, only 916 were considered for the purpose of analysis as these were complete and usable in all respects. An Empirical Study of Brand Consciousness prevalent among males is presented in this paper. Males who are generally considered as not being very particular about the brand they use in case of personal care products have proved to be otherwise.
A Study on Buying Behavior of Indian Consumers: A Dynamic ViewRHIMRJ Journal
In this dynamic world the behavior of consumers varying day to day. This research study is based on the consumer’s
perceptions, buying behaviour and satisfaction of the consumers in Indian market. The Indian consumers are known for the
high degree of value orientation. India is an attractive market however, the per capita income in India is low and it remains a
huge market, even for luxurious products. Consumer behaviour is difficult and very often not considered rational. The recent
trends which are found in the Indian market are celebrity influence, online shopping, free gifts and discounts and also for
popularity of eco-friendly products.
Enterprise Excellence is Inclusive Excellence.pdfKaiNexus
Enterprise excellence and inclusive excellence are closely linked, and real-world challenges have shown that both are essential to the success of any organization. To achieve enterprise excellence, organizations must focus on improving their operations and processes while creating an inclusive environment that engages everyone. In this interactive session, the facilitator will highlight commonly established business practices and how they limit our ability to engage everyone every day. More importantly, though, participants will likely gain increased awareness of what we can do differently to maximize enterprise excellence through deliberate inclusion.
What is Enterprise Excellence?
Enterprise Excellence is a holistic approach that's aimed at achieving world-class performance across all aspects of the organization.
What might I learn?
A way to engage all in creating Inclusive Excellence. Lessons from the US military and their parallels to the story of Harry Potter. How belt systems and CI teams can destroy inclusive practices. How leadership language invites people to the party. There are three things leaders can do to engage everyone every day: maximizing psychological safety to create environments where folks learn, contribute, and challenge the status quo.
Who might benefit? Anyone and everyone leading folks from the shop floor to top floor.
Dr. William Harvey is a seasoned Operations Leader with extensive experience in chemical processing, manufacturing, and operations management. At Michelman, he currently oversees multiple sites, leading teams in strategic planning and coaching/practicing continuous improvement. William is set to start his eighth year of teaching at the University of Cincinnati where he teaches marketing, finance, and management. William holds various certifications in change management, quality, leadership, operational excellence, team building, and DiSC, among others.
Cracking the Workplace Discipline Code Main.pptxWorkforce Group
Cultivating and maintaining discipline within teams is a critical differentiator for successful organisations.
Forward-thinking leaders and business managers understand the impact that discipline has on organisational success. A disciplined workforce operates with clarity, focus, and a shared understanding of expectations, ultimately driving better results, optimising productivity, and facilitating seamless collaboration.
Although discipline is not a one-size-fits-all approach, it can help create a work environment that encourages personal growth and accountability rather than solely relying on punitive measures.
In this deck, you will learn the significance of workplace discipline for organisational success. You’ll also learn
• Four (4) workplace discipline methods you should consider
• The best and most practical approach to implementing workplace discipline.
• Three (3) key tips to maintain a disciplined workplace.
Buy Verified PayPal Account | Buy Google 5 Star Reviewsusawebmarket
Buy Verified PayPal Account
Looking to buy verified PayPal accounts? Discover 7 expert tips for safely purchasing a verified PayPal account in 2024. Ensure security and reliability for your transactions.
PayPal Services Features-
🟢 Email Access
🟢 Bank Added
🟢 Card Verified
🟢 Full SSN Provided
🟢 Phone Number Access
🟢 Driving License Copy
🟢 Fasted Delivery
Client Satisfaction is Our First priority. Our services is very appropriate to buy. We assume that the first-rate way to purchase our offerings is to order on the website. If you have any worry in our cooperation usually You can order us on Skype or Telegram.
24/7 Hours Reply/Please Contact
usawebmarketEmail: support@usawebmarket.com
Skype: usawebmarket
Telegram: @usawebmarket
WhatsApp: +1(218) 203-5951
USA WEB MARKET is the Best Verified PayPal, Payoneer, Cash App, Skrill, Neteller, Stripe Account and SEO, SMM Service provider.100%Satisfection granted.100% replacement Granted.
RMD24 | Debunking the non-endemic revenue myth Marvin Vacquier Droop | First ...BBPMedia1
Marvin neemt je in deze presentatie mee in de voordelen van non-endemic advertising op retail media netwerken. Hij brengt ook de uitdagingen in beeld die de markt op dit moment heeft op het gebied van retail media voor niet-leveranciers.
Retail media wordt gezien als het nieuwe advertising-medium en ook mediabureaus richten massaal retail media-afdelingen op. Merken die niet in de betreffende winkel liggen staan ook nog niet in de rij om op de retail media netwerken te adverteren. Marvin belicht de uitdagingen die er zijn om echt aansluiting te vinden op die markt van non-endemic advertising.
Improving profitability for small businessBen Wann
In this comprehensive presentation, we will explore strategies and practical tips for enhancing profitability in small businesses. Tailored to meet the unique challenges faced by small enterprises, this session covers various aspects that directly impact the bottom line. Attendees will learn how to optimize operational efficiency, manage expenses, and increase revenue through innovative marketing and customer engagement techniques.
Tata Group Dials Taiwan for Its Chipmaking Ambition in Gujarat’s DholeraAvirahi City Dholera
The Tata Group, a titan of Indian industry, is making waves with its advanced talks with Taiwanese chipmakers Powerchip Semiconductor Manufacturing Corporation (PSMC) and UMC Group. The goal? Establishing a cutting-edge semiconductor fabrication unit (fab) in Dholera, Gujarat. This isn’t just any project; it’s a potential game changer for India’s chipmaking aspirations and a boon for investors seeking promising residential projects in dholera sir.
Visit : https://www.avirahi.com/blog/tata-group-dials-taiwan-for-its-chipmaking-ambition-in-gujarats-dholera/
VAT Registration Outlined In UAE: Benefits and Requirementsuae taxgpt
Vat Registration is a legal obligation for businesses meeting the threshold requirement, helping companies avoid fines and ramifications. Contact now!
https://viralsocialtrends.com/vat-registration-outlined-in-uae/
Memorandum Of Association Constitution of Company.pptseri bangash
www.seribangash.com
A Memorandum of Association (MOA) is a legal document that outlines the fundamental principles and objectives upon which a company operates. It serves as the company's charter or constitution and defines the scope of its activities. Here's a detailed note on the MOA:
Contents of Memorandum of Association:
Name Clause: This clause states the name of the company, which should end with words like "Limited" or "Ltd." for a public limited company and "Private Limited" or "Pvt. Ltd." for a private limited company.
https://seribangash.com/article-of-association-is-legal-doc-of-company/
Registered Office Clause: It specifies the location where the company's registered office is situated. This office is where all official communications and notices are sent.
Objective Clause: This clause delineates the main objectives for which the company is formed. It's important to define these objectives clearly, as the company cannot undertake activities beyond those mentioned in this clause.
www.seribangash.com
Liability Clause: It outlines the extent of liability of the company's members. In the case of companies limited by shares, the liability of members is limited to the amount unpaid on their shares. For companies limited by guarantee, members' liability is limited to the amount they undertake to contribute if the company is wound up.
https://seribangash.com/promotors-is-person-conceived-formation-company/
Capital Clause: This clause specifies the authorized capital of the company, i.e., the maximum amount of share capital the company is authorized to issue. It also mentions the division of this capital into shares and their respective nominal value.
Association Clause: It simply states that the subscribers wish to form a company and agree to become members of it, in accordance with the terms of the MOA.
Importance of Memorandum of Association:
Legal Requirement: The MOA is a legal requirement for the formation of a company. It must be filed with the Registrar of Companies during the incorporation process.
Constitutional Document: It serves as the company's constitutional document, defining its scope, powers, and limitations.
Protection of Members: It protects the interests of the company's members by clearly defining the objectives and limiting their liability.
External Communication: It provides clarity to external parties, such as investors, creditors, and regulatory authorities, regarding the company's objectives and powers.
https://seribangash.com/difference-public-and-private-company-law/
Binding Authority: The company and its members are bound by the provisions of the MOA. Any action taken beyond its scope may be considered ultra vires (beyond the powers) of the company and therefore void.
Amendment of MOA:
While the MOA lays down the company's fundamental principles, it is not entirely immutable. It can be amended, but only under specific circumstances and in compliance with legal procedures. Amendments typically require shareholder
What is the TDS Return Filing Due Date for FY 2024-25.pdfseoforlegalpillers
It is crucial for the taxpayers to understand about the TDS Return Filing Due Date, so that they can fulfill your TDS obligations efficiently. Taxpayers can avoid penalties by sticking to the deadlines and by accurate filing of TDS. Timely filing of TDS will make sure about the availability of tax credits. You can also seek the professional guidance of experts like Legal Pillers for timely filing of the TDS Return.
[Note: This is a partial preview. To download this presentation, visit:
https://www.oeconsulting.com.sg/training-presentations]
Sustainability has become an increasingly critical topic as the world recognizes the need to protect our planet and its resources for future generations. Sustainability means meeting our current needs without compromising the ability of future generations to meet theirs. It involves long-term planning and consideration of the consequences of our actions. The goal is to create strategies that ensure the long-term viability of People, Planet, and Profit.
Leading companies such as Nike, Toyota, and Siemens are prioritizing sustainable innovation in their business models, setting an example for others to follow. In this Sustainability training presentation, you will learn key concepts, principles, and practices of sustainability applicable across industries. This training aims to create awareness and educate employees, senior executives, consultants, and other key stakeholders, including investors, policymakers, and supply chain partners, on the importance and implementation of sustainability.
LEARNING OBJECTIVES
1. Develop a comprehensive understanding of the fundamental principles and concepts that form the foundation of sustainability within corporate environments.
2. Explore the sustainability implementation model, focusing on effective measures and reporting strategies to track and communicate sustainability efforts.
3. Identify and define best practices and critical success factors essential for achieving sustainability goals within organizations.
CONTENTS
1. Introduction and Key Concepts of Sustainability
2. Principles and Practices of Sustainability
3. Measures and Reporting in Sustainability
4. Sustainability Implementation & Best Practices
To download the complete presentation, visit: https://www.oeconsulting.com.sg/training-presentations
Affordable Stationery Printing Services in Jaipur | Navpack n PrintNavpack & Print
Looking for professional printing services in Jaipur? Navpack n Print offers high-quality and affordable stationery printing for all your business needs. Stand out with custom stationery designs and fast turnaround times. Contact us today for a quote!
Skye Residences | Extended Stay Residences Near Toronto Airportmarketingjdass
Experience unparalleled EXTENDED STAY and comfort at Skye Residences located just minutes from Toronto Airport. Discover sophisticated accommodations tailored for discerning travelers.
Website Link :
https://skyeresidences.com/
https://skyeresidences.com/about-us/
https://skyeresidences.com/gallery/
https://skyeresidences.com/rooms/
https://skyeresidences.com/near-by-attractions/
https://skyeresidences.com/commute/
https://skyeresidences.com/contact/
https://skyeresidences.com/queen-suite-with-sofa-bed/
https://skyeresidences.com/queen-suite-with-sofa-bed-and-balcony/
https://skyeresidences.com/queen-suite-with-sofa-bed-accessible/
https://skyeresidences.com/2-bedroom-deluxe-queen-suite-with-sofa-bed/
https://skyeresidences.com/2-bedroom-deluxe-king-queen-suite-with-sofa-bed/
https://skyeresidences.com/2-bedroom-deluxe-queen-suite-with-sofa-bed-accessible/
#Skye Residences Etobicoke, #Skye Residences Near Toronto Airport, #Skye Residences Toronto, #Skye Hotel Toronto, #Skye Hotel Near Toronto Airport, #Hotel Near Toronto Airport, #Near Toronto Airport Accommodation, #Suites Near Toronto Airport, #Etobicoke Suites Near Airport, #Hotel Near Toronto Pearson International Airport, #Toronto Airport Suite Rentals, #Pearson Airport Hotel Suites
Attending a job Interview for B1 and B2 Englsih learnersErika906060
It is a sample of an interview for a business english class for pre-intermediate and intermediate english students with emphasis on the speking ability.
LA HUG - Video Testimonials with Chynna Morgan - June 2024Lital Barkan
Have you ever heard that user-generated content or video testimonials can take your brand to the next level? We will explore how you can effectively use video testimonials to leverage and boost your sales, content strategy, and increase your CRM data.🤯
We will dig deeper into:
1. How to capture video testimonials that convert from your audience 🎥
2. How to leverage your testimonials to boost your sales 💲
3. How you can capture more CRM data to understand your audience better through video testimonials. 📊
1. A Study on Purchase Pattern of Cosmetics among Consumers in Kerala
Dr. Vinith Kumar Nair*
Dr. Prakash Pillai R*
Introduction
Understanding behaviour of consumers is a key to the success of business organizations.
Marketing personnel are constantly analyzing the patterns of buying behaviour and purchase
decisions to predict the future trends. Consumer behaviour can be explained as the analysis of
how, when, what and why people buy. Consumer behavior can be understood as: "The decision
process and physical activity individuals engage in when evaluating, acquiring, using, or
disposing of goods and services." (Loudon and Della Bitta, 1980). Nowadays, this phenomenon,
can also be illustrated in the following way: "activities people undertake when obtaining,
consuming, and disposing of products and services" (Blakwell, Minard and Engel, 2001).
A study by Voss and Parasuraman (2003) suggests that the purchase preference is primarily
determined by price than quality during pre-purchase evaluation. Given explicit quality
information, price had no effect on pre-purchase or post-consumption quality perceptions.
Instead, post consumption quality evaluations had a favorable impact on price evaluations.
Another study by Chernev (1997) analyzed the effect of common features on brand choice and
the moderating role of attribute importance. It is argued that when brand attributes differ in
importance, with the best value on the most important attribute, thus further polarizing brands’
choice shares. In contrast, when attributes are similar in their importance, common features are
likely to have an opposite effect, equalizing brands share.
Russo and France (1994), studied the nature of the choice process for commonly purchased non-
durables by tracking eye fixations in a laboratory simulation of supermarket shelves. The findings
are fully compatible with the general view that the choice process is constructed to adapt to the
immediate purchase environment.
While describing about shopping orientation, Sinha (2003) reports that Indian Shoppers seek
emotional value more than the functional value of shopping. Their orientation is based more on
the entertainment value than on the functional value. The orientation is found to be affected
primarily by the type of store, the frequency of buying and to some extent by the socio-economic
classification. The retailers need to experiment with a format that attracts both types of shoppers.
Research suggests that beauty consciousness among people in general is changing. Vigneron and
Johnson (1999) reported that people's needs for appearances and materialism were increasing.
That is human beings wanted to satisfy the need to look and feel good. This created a boom in the
cosmetic and toiletries sector across the world. Chambers Encyclopedia defines cosmetics as (a)
articles intended to be rubbed, poured, sprinkled or sprayed on, introduced into or otherwise
applied to the human body or any part thereof for cleaning, beautifying, promoting attractiveness
or altering the appearance and (b) articles intended for use as a component of such articles. Now a
variety of cosmetic and toiletries ranging from natural to sophisticated items are available in the
market. The pattern and preference of use of these items vary according to different segments of
gender, age and socio-economic class. When we review the literature on the cosmetic and toiletry
industry, not many studies are available especially about Indian scenario. The present study is an
attempt to analyse the purchasing pattern of cosmetic consumers in Kerala.
Cosmetics and Toiletries: Global Scenario
In 2003, the world market for cosmetics and toiletries (C&T) was valued at US$201 billion, up
4.8% from 2002 (in fixed exchange rate terms). Though mature, hair care maintains its position as
the most valuable sector in global cosmetics and toiletries, with global sales amounting to
US$42.4 billion in 2003. (Briney, 2004b). According to Global Cosmetic Industry report
(August, 2004) the advanced education provided by brands about the products' ingredients and
*DC School of Management & Technology, Pullikkanam, Idukki - 685 503. E-Mail:- vinith79@yahoo.com, prakash@dcschool.net
2. Part VI – Consumer Markets & Marketing
benefits have made today's consumer more aware of what they're putting on their bodies, and
making them more willing to pay.
Indian Cosmetic Industry
The Indian cosmetics industry is growing in terms of product development and marketing. The
preference of Indian consumers is changing from the ‘merely functional’ products to more
‘advanced and specialized’ cosmetic items. In 2005, sales of cosmetics and toiletries rose by 6%
in current value terms in India. Monteiro (2003) also predicts the huge potential for cosmetics in
India. The average annual spending of Indian consumers on cosmetics and toiletries in 2005 is
just over US$3. India in cosmetics and toiletries, which saw its value share rising from 27% in
1999 to 31% in 2005 and is likely to continue to surge ahead over the forecast period.
The entry of many multinationals into the Indian cosmetics and toiletries industry in 2005 has
made it an extremely challenging and dynamic market. Foreign players have focused more on
product innovation; re-launches and brand extensions spread across multiple price points, and
enhanced product penetration by extending their distribution networks. The leading players have
streamlined their ad spend to effect savings that has allowed them revamp their pricing strategies
as well as offer free gifts to retain consumers. Briney ( 2004a) describes an interesting trend
among Indian cosmetic consumers, while other global countries are taking to the traditional
Indian herbal and ayurvedic applications for beauty solutions, Indian consumers are increasingly
looking to international personal care brands as lifestyle enhancement products, in the belief that
the association with and use of an international brand confers one with a sophisticated and upper
class image.
The projected sales in 2010 at constant 2005 prices is Rs. 195.6 billion, the main reasons being a
greater ability to purchase personal grooming products among a larger base of financially
independent women, frequent relevant product launches and growing beauty consciousness and
awareness, especially among the younger population. Despite the huge nascent potential in India,
cosmetics and toiletries is expected to grow at a relatively slow pace in constant value terms over
the 2005-2010 forecast periods. The probable reason being lackluster performance of products
which have already thorough household penetration, such as bath and shower products and oral
hygiene, which represent together over half of the value sales of cosmetics and toiletries in India.
However the Growth was affected by low product awareness or lack of inclination to spend on
cosmetics and toiletries especially in rural areas. The aggressive price competitions from local
and regional players, which seized volumes with better trade margins and heavily discounted
offerings, have also contributed to the same.
Malhotra (2003) describes the main reasons for boom in cosmetic industry as increasing fashion
and beauty consciousness coupled with rising incomes and focus on health and fitness. To
complement this, beauty culture or cosmetology has emerged as a major occupational avenue
with significant commercial potential. New scientific developments, techniques, products and
media hype, has contributed the Indian fashion industry in generating mega revenues and this has
in turn added to the growth of cosmetic industry. Rising hygiene and beauty consciousness due to
changing demographics and lifestyles, deeper consumer pockets, rising media exposure, greater
product choice, growth in retail segment and wider availability are the reasons reported by
(Euromonitor International, 2006). Over recent years, India has seen increasing literacy levels,
penetration of satellite television, growing urbanization and greater beauty awareness among
women, which has resulted in rewarding growth opportunities to cosmetics and toiletries
manufacturers.
Around 44% of value sales (2005) of cosmetics & toiletries market in India are with two market
leaders i.e. Hindustan Lever & Colgate Palmolive. The rest is very fragmented with hundreds of
companies trying to get into the market. The presence of a large grey market and many
counterfeits also enhanced this trend.
International Marketing Conference on Marketing & Society, 8-10 April, 2007, IIMK 582
3. Part VI – Consumer Markets & Marketing
Price & Indian Cosmetic Consumers
There is high maturity and price competition in established mass market toiletries such as bar
soap and toothpaste. Since the average Indian household continues to be highly price sensitive,
these popular mass-market products will have the lion’s share of cosmetics and toiletries sales.
This will offer high growth prospects of the overall market over the coming years. The cosmetics
and toiletries market are also facing competition from other consumer durables (computers,
mobile phones, home theatres and automobiles) as well as the housing sector. The drop in interest
rates has led to a boom in housing loans and real estate purchases. Being value conscious, there is
a limit to the amount that the average consumer will spend on luxury items such as fragrances.
Urban & Rural Cosmetic Consumers
India's spending on cosmetics and toiletries is relatively small, with rural and suburban areas
concentrating on basic toiletries and cosmetics. The purchasing power of Indian consumers is
increasing thereby shaping the aspirations and lifestyles of consumers, who are upgrading to good
value products at affordable prices. The Cosmetic Companies have invested heavily on promoting
product visibility among rural folk, which has increased the demand for bar soap, talcum powder,
lipstick, tooth powder and hair oil in these areas. This has also increased the demand for essential
everyday items like bath and shower products, hair care, oral hygiene and skin care. Another
strategy followed by companies to promote cosmetics in rural areas was sachets’ approach.
While rural India contributed to growth in volume terms, the urban population contributed 69 %
of value sales in 2005 especially for sophisticated products. These high-quality added-value niche
products include mascara, toners, body wash/shower gel, depilatories, sun care and deodorants,
amongst others which are unaware to the rural users. Sales are almost completely generated from
the urban pockets, concentrated within the key metropolitan areas of New Delhi, Chennai,
Mumbai and Calcutta. Due to Western influences, men's grooming products are used more
predominantly in urban population compared to their counterparts in rural areas.
Income Households
Cosmetics and toiletries have witnessed a growing demand from the low and lower middle-
income households. The premium labels are being used in urban areas, whereas regional and
national brands in the rural areas, where close to 70% of the Indian population resides and price
determines purchasing decisions.
Indian Men & Women Cosmetic Users
Both male and female consumers form a major segment of buyers of beauty products in India.
(Monteiro, 2003). Indian women are becoming increasingly more beauty conscious. Reports of
Consumer Graphics revealed that in 2003, Indian women aged 15-24 years accounted for 29.8%
of all Indian makeup sales
(http://www.cosmeticsandtoiletries.com/onlineexclusives/1689497.html). The increased
purchasing ability of women households helped them to spend more on personal grooming.
Colour cosmetics emerged as the fastest growing area of the cosmetics and toiletries market over
the review period. Experimentation among teen and young adult Indian women was one reason
cited for the increase in makeup use. According to Monteiro (2003), there is a tremendous
increase in the female cosmetic consumers. This is due to increasing number of women becoming
the earning members of the family due to their increased level of literacy and growing influence
of the media
More males in India are becoming conscious about the way they look and are increasingly
looking to grooming products to spruce up their physical appearance. This newfound male
grooming consciousness was encouraged by men's active participation in prominent fashion
shows, such as the popular Fashion TV channel, and in beauty pageants exclusively for men
International Marketing Conference on Marketing & Society, 8-10 April, 2007, IIMK 583
4. Part VI – Consumer Markets & Marketing
especially in the forward-looking and cosmopolitan cities of Mumbai, Bangalore and New Delhi.
The demand for men’s hair care and deodorants has gone up and razors and blades have
contributed to the men’s grooming value sales. This particular segment which is at its early stage
of its development with a growth of only 6% remains a nascent niche. Barson, (2004) suggests
that men cannot simply be classified as metro-sexuals or non-metrosexuals. There are other
categories in between those two ends of the spectrum. Motivations and type of products
purchased should be different depending upon the segment of guys targeted.
Cosmetic Industry in South India
The demand for cosmetics and toiletries in South India is expected to remain concentrated mainly
on essential items where 80% of the population belongs to the lower- and lower middle- income
groups. Consumers in this region expect good quality products. The urban population in South
India is expected to witness rapidly changing aspirations and lifestyles, which will result in
increase in demand for cosmetics and toiletries. South Indian market is dominated by sale of baby
care products. In 2005, South India was accounted for over 27% value share within cosmetics and
toiletries in India.
The Consumption pattern of consumers in Kerala is changing (The Hindu dated 5th July 2005,
Mangalore Edition). The probable reasons being more spending power, better education and
access to various brands and products, due to migration abroad and the TV boom. The readiness
to experiment is reported to be growing among the consumers in Kerala. The consumers have
also become globalized in their thinking and are ready to indulge in some impulsive shopping.
General Objective of the study
The main objective of the study is to analyze the purchase pattern of cosmetic consumers in
Kerala.
Specific Objectives
1) To describe the demographic profile of cosmetic consumers.
2) To study the style of purchase of cosmetics.
3) To assess how brand influences the purchasing pattern.
4) To analyze the different factors involved in purchase decision of cosmetics.
5) To study the spending pattern of cosmetic consumers and its influence on society.
Scope of the Study
The study analyses the purchase patterns and spending styles of people belonging to different
segments of Cosmetic consumers in Kerala. The major variables selected for the study are as
follows:
Demographic Profile of Consumers
Area- Wise (Urban & Sub Urban), Gender Wise (Male & Female), Age Wise, Monthly Income
Education, Qualification and Occupational status.
Major Factors identified for detailed study includes
Purchase Style, Brand Selection, Point of Purchase, Location Preference
Brand Loyalty, Brand Awareness, Factors in Purchase Decision, and Spending Pattern.
Relevance of the Study
The state of Kerala is known for its consumerism. The present study will be helpful in
understanding the customer attitude of the different strata of people in the Kerala society. The
classification of the different strata of the people are area wise, gender wise, occupational, income
wise etc. The study will also be helpful in analyzing the customer attitude towards the different
factors identified after the focus group discussions. It will also help in studying the effect of
cosmetic purchase on the society specifically among the segments under consideration.
International Marketing Conference on Marketing & Society, 8-10 April, 2007, IIMK 584
5. Part VI – Consumer Markets & Marketing
Research Methodology
This study was carried out in two stages.
Stage 1: This stage of the research was exploratory in nature. This was done in two phases. The
initial phase was to undertake detailed secondary search about cosmetic industry in India,
its characteristics, major players in the market, market segmentation and purchase
patterns. It was followed by a set of focus group discussions among cosmetic costumers
to assess the consumer preferences, perceptions, cosmetic use and purchase patterns. The
from this exploratory search was the basis for preparing the interview schedule for the
next stage.
Stage 2: A descriptive research was carried out at the second stage by applying a survey method.
Data for the study were collected from cosmetic shops belonging to the three main cities
in Kerala viz. Thiruvananthapuram, Ernakulam and Kozhikode. The tool used for data
collection is an interview schedule, which covered the demographic profile of consumers,
details about purchase patterns, and various factors considered for buying cosmetics. The
consumers were interviewed at the leading cosmetic shops and convenient sampling was
applied to select samples. The sample size for the study is 300.
Primary Data Analysis
Profile of the Respondents
Around 68 per cent of the respondents of the study were residents within the town (urban) while
the remaining belongs to the outskirts (suburban areas) of towns.
250
200
150
205
100
95
50
0
Urban Sub-urban
The percentage of males in the sample is slightly high (59%).
International Marketing Conference on Marketing & Society, 8-10 April, 2007, IIMK 585
6. Part VI – Consumer Markets & Marketing
180
160
140
120
100 177
80
123
60
40
20
0
male female
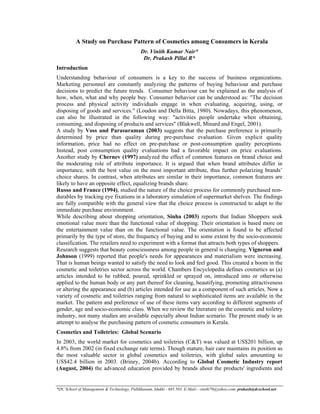
About half of (47%) the respondents were graduates. The percentage of post graduates is 22 while
12 per cent are 12th pass. Eleven per cent of the respondents are professionals.
11%
1% 22%
7% PG
Graduates
Pre degree
12%
10th Class
Below 10
Professional
47%
Age wise, the respondents were classified as teenagers, youth, middle aged and upper middle
aged. About 47 per cent of the total respondents were youth, 29 per cent middle aged and 18 per
cent belonged to the upper middle aged category. Only 5.78 per cent were teenagers. Minimum
age is 15 and maximum 68. Mean age of the respondents in the sample is 36.
International Marketing Conference on Marketing & Society, 8-10 April, 2007, IIMK 586
7. Part VI – Consumer Markets & Marketing
160
140 143
120
100
Frequency
80 86
60
54
40
20
17
0
tennagers middleaged
youth upper middle aged
age group
Around 41 per cent of the respondents belong to lower income category, another 37% are in the
middle income and 21.55 per cent are upper income group. The median income of the sample is
Rs.15, 000. Based on the medium income, the total respondents were classified as lower, middle
and upper income category.
80
70
60
50
40
30
20
10
0
lower middle upper
Largest single occupational category among the respondents is businessmen (15%). Around 14
per cent were teachers and 12 per cent were government employees. About 11 per cent of the
respondents were students. Nearly 10 per cent each of the respondents were professionals (like
doctors, engineers, and lawyers), executives and .housewives.
International Marketing Conference on Marketing & Society, 8-10 April, 2007, IIMK 587
8. Part VI – Consumer Markets & Marketing
House wive
13% 10%
Farmer
3% Student
10% 11% Business
Teacher
2%
Govt. employee
10% Professionals
15%
Technical
Executives
12%
14% Others
The following session covers a detailed analysis of the main variables namely Mode of Purchase,
Brand Selection, Point of Purchase, Shop Preference, Brand Preference, Brand Awareness,
Factors in Purchase Decision, and Spending Pattern. These factors are analyzed across the
demographic variable viz. Gender, Occupation, Income, Place of Residence, Qualification and
Age respectively.
1. Mode of Purchase
Around 51 per cent of the respondents have purchased cosmetics individually. About a third of
the consumers purchased cosmetics with their spouses. Percentage of respondents who purchased
cosmetics with friends comes to 12. Seven per cent of the respondents purchased it with their
children.
1.1 Purchasing cosmetics individually seems to be the prevailing practice among both males
(54%) and females (47%). The practice of purchasing cosmetics with their friends seems to be
more prevalent (10.7) among females compared to their counter parts (4.7%).
1.2 A good number of respondents belonging to all occupational groups except housewives
purchased cosmetics individually. Among the housewives (43%) there was a customary practice
of purchasing cosmetics with the help of their spouses. Forty six per cent of the professionals had
to take the help of either their children or spouses for purchasing cosmetics. Among the
executives 32 per cent purchased cosmetics with the help of spouses. Another 24 per cent of them
had to depend on their children for purchasing cosmetics.
1.3 Around 57 per cent each of the respondents belonging to the lower income category, 46 per
cent each of those in the middle and upper income groups purchased cosmetics individually.
Spouses were involved in the purchasing of cosmetics in the case of about a third each of the
respondents belonging to all the three income categories. Percentage of people who purchase
cosmetics individually is bit high in the case respondents belonging to the lower income group.
1.4 It can be observed that around 50% of the urban respondents and 53.3% of those belonging to
the sub urban areas made their purchases individually. While 32 per cent of urban consumers
purchased cosmetics with their spouses, the corresponding percentage among sub-urban category
came to 27.
1.5 A reasonably large number of respondents irrespective of their qualifications did their
shopping individually. About 38 per cent of post graduates, 34 per cent of the graduates, and a
third of the pre degree qualified respondents purchased cosmetics with their spouses.
International Marketing Conference on Marketing & Society, 8-10 April, 2007, IIMK 588
9. Part VI – Consumer Markets & Marketing
1.6 About 83 per cent of the teenagers, 55 per cent each of youth and upper middle aged
consumers purchased cosmetics individually. Forty per cent of the middle aged respondents did
their cosmetic purchase with the help of their spouses. The results of the Chi-square test (at 1 per
cent level of significance) substantiates that there is a significant association between mode of
purchase and age of the respondents. Pearson’s Chi-square value is 32.04 for 9 degrees of
freedom.
2. Brand Selection
Fifty eight per cent of the respondents selected the specific brands of cosmetics individually by
themselves. Around 22 per cent of the respondents entrusted the brand selection to their spouse.
About 18 per cent of the respondents did the brand selection together with their spouses.
2.1 The percentage of respondents who selected the brands by themselves is slightly high among
females (61.3) compared to those among the males (56). Selecting the brand exclusively by the
spouses or together by both the spouses seems to be enjoyed by the men compared to women.
2.2 A good number of respondents belonging to all occupational categories purchased cosmetics
individually. Spouses were involved in the purchase for 37 per cent of the teachers, 30 per cent of
executives, 29 per cent of housewives, and 23 per cent of businessmen. Both the spouses together
did the cosmetic purchase in the case of 30 per cent of government employees and 23 per cent of
the professionals.
2.3 About 64 per cent of respondents belongs to the upper income group, 60 per cent of those in
the lower income group and 52 per cent in the middle income group selected their brands of
cosmetics individually by themselves. More than a quarter of those in the middle income group
respondents involved their spouses for selecting the brands while only a smaller percentage (less
than 15) among other income categories did so.
2.4 Around 58.3% of the respondents living in urban areas and 58.6% of the respondents who live
in the sub-urban regions select their brand themselves.
2.5 All the respondents irrespective of their qualifications select the brand of products themselves
when they go for shopping cosmetic products
2.6 Eighty eight per cent of the teenagers did their brand selection individually. The
corresponding percentages among other age groups are youth (63.8 %), upper middle aged (52%)
and middle aged (46%). Spouses were involved in the brand selection for 36 per cent of those in
the upper middle aged category, 26 per cent of the middle aged group. Both the spouses were
involved in the case of 28 per cent of the middle aged respondents. Chi-square test substantiates
that there is significant association between brand selection and age of the respondents at 1 per
cent level of significance. Pearson chi-square value is 41.709 for 9 degrees of freedom.
3. Point of Purchase
There is no specific shop of preference for 62 per cent of the respondents in purchasing
cosmetics. But 38 per cent of the total respondents purchased it from a particular shop.
3.1 Women consumers preferred to purchase from any shop compared to their counterparts (men
enjoyed shopping from a particular shop). The relationship between shop preference and gender
is not statistically significant at 5 per cent level. Pearson chi-square value is 1.0899 and p value is
0.297
3.2 More than three fourth each of professionals and students, 71 per cent of the government
employees, 61 per cent of housewives, 58 per cent of the farmers and 68 per cent of the other
category employees purchased from any shop of convenience. Around 56 per cent of
businessmen and 52 per cent of teachers shopped cosmetics from specific shop. The tendency of
shopping from any shop is more prevalent among professionals, students, government employees
and farmers while businessmen and teachers preferred to shop from specific shop.
International Marketing Conference on Marketing & Society, 8-10 April, 2007, IIMK 589
10. Part VI – Consumer Markets & Marketing
3.3 Sixty three per cent of the respondents in the middle income group, 59 per cent each of those
in the lower and upper income categories purchased cosmetics from any shop of their
convenience. That is, only 37 per cent in the middle income, 41 per cent each in the upper and
lower income categories purchased cosmetics from a specific shop.
3.4 About 61 % of the respondents who live within the town and 64.4% of the respondents who
live in sub-urban areas make their purchase from any convenient shop and not from any particular
shop.
3.5 All the respondents, except the people who have SSLC as their qualification irrespective of
their qualifications purchase cosmetic products from any convenient shop and do not depend on a
particular shop. It has been observed that people who have SSLC as their qualification tend to
purchase cosmetic products from a particular shop.
3.6 Seventy one per cent of the teenagers, 67 per cent of the youth, 56 per cent of the middle aged
and 52 per cent of the upper middle aged respondents prefer to purchase from any shop of their
convenience. Percentage of people purchasing from a particular shop is relatively high among
those in the middle aged (44%) and upper middle aged (48%) group. But the relationship between
point of purchase and age is not statistically significant at 5 per cent level.
4. Shop Preference
About two thirds of the respondents purchased the variety cosmetics from different shops
whereas a third did it from a single shop.
4.1 The percentage of female consumers is high among those who purchase it from variety shops
compared to males. But men preferred to purchase it from a single shop. That means male
consumers enjoyed purchase of all their cosmetic requirements from a single shop. This may be
because the variety and types of cosmetics available for men are less compared to women.
4.2 Around 82 per cent of students, 73 per cent of government employees, 77 per cent of the other
categories, around 60 per cent each of housewives, professionals, technical employees and
executives shopped from the variety shops. Fifty seven per cent of the farmers, 62 per cent of
teachers were so particular about shopping from the single shop. That is farmers and teachers
restricted their shopping of cosmetics from a single shop while majority among all other
occupational groups did it from different shops. The results of Chi-square test substantiates that
there is a significant relationship (at 5 per cent level of significance) between occupation of the
respondents and shop preference. Pearson chi-square value is 20.934 and p value 0.013.
4.3 Around three fourths of the respondents belonging to the middle income group, 68 per cent in
the upper income category and 59 per cent in the lower income group had the habit of purchasing
from multiple shops. Compared to the upper and middle income groups, respondents in the lower
income category preferred to purchase from a single shop.
4.4 Around 63 per cent of the respondents living within the town and 69.2% of the sub-urban
respondents do not make all their purchase from a single shop. While 34 per cent of those
residing within the town did shopping from a single shop, only 31 per cent of those in the
outskirts did so.
4.5 All the respondents, except the people who have 10th standard as their qualification
irrespective of their qualifications purchase cosmetic products from a single shop. It has been
observed that people who have 10th as their qualification tend to purchase cosmetic products from
multiple shops
4.6 Around 82 percent of the teenagers, 64 per cent each among the youth, middle aged and upper
middle aged category purchased cosmetic products from a multiple shop. The difference in shop
preference is not statistically significant at 5 per cent level.
5. Brand Preference
Among the total, 60 per cent of the respondents were very strict about their specific brand.
International Marketing Conference on Marketing & Society, 8-10 April, 2007, IIMK 590
11. Part VI – Consumer Markets & Marketing
5.1 Male respondents purchase some other brands if they do not get the specific brand of
cosmetics but the percentage of females doing same is less. Restricting to a single brand has been
more prevalent among females compared to male consumers (brand loyalty high among the
females compared to males).
5.2 About two thirds of the executives and 56 per cent of the professionals were not very keen
about the brands they purchase. But three fourths of the housewives, 71 per cent of the
government employees, 70 per cent of the businessmen, and 60 per cent of the teachers stick to
their specific brands. That is professionals and executives dominantly were not very strict to the
brands while respondent belonging to all other occupational groups restricted themselves to
specific brands.
5.3 Around 59 per cent of the respondents in the middle income category, 57 per cent in the lower
income category and 51 per cent in the upper income groups were brand specific in selecting
cosmetics. The remaining respondents had the habit of purchasing any brand.
5.4 About 62.8% of the respondents who live within the town and 52.9% of the respondents who
live in the sub-urban areas do not purchase some other brand if they don’t get their brand.
5.5 All the respondents, except the people who have qualification less than 10th Class do not
purchase some other brand if they don’t get their brand. It has been observed that people who
have qualification less than 10th Class tend to purchase other brand of cosmetics if they are not
able to get a particular brand.
5.6 Sixty two per cent of the youth, 60 per cent of the middle aged and 56 per cent of the upper
middle aged do not purchase some other brand if they don’t get their brand. Half of the teenagers
and 44 per cent of the upper middle aged consumers were willing to purchase some other brand if
they are not able to get a particular brand. The corresponding percentage among youth and middle
aged are 38 and 40 respectively.
6. Brand Information
Advertisement serves as the major source in providing information about brands of cosmetics to
the respondents. Another major source of information was friends group.
6.1 Percentage of females consumers are high in the category of those who received the
information from family and friends compared to their male counterparts. But more men
consumers depended on advertisement compared to women.
6.2 The source of information of brands for 44 per cent of the housewives was advertisement, 28
per cent got it through friends and another 20 per cent through family members. The main source
of information of brands among the student groups was friends when 30 per cent got it through
advertisement. Around 60 per cent of businessmen, 50 per cent of professionals and 57 per cent
of executives got information about new brands though advertisement.
6.3 A half of the respondents belonging to the lower income category and 45 per cent in the upper
income category got the information about the brands through advertisement. The corresponding
percentage among the middle income group was only 34. Friends groups served as the sources of
brand information in the case of 36 per cent of the respondents in the middle income, a third of
the upper income group and more than a quarter of those in the lower income groups.
6.4 About 47% of the respondents living within the town and 50.6% of the respondents living in
the sub-urban get the information about new brands from the advertisements. Friends group
served as the main source of information about a new brand for 32 per cent of the respondents
living within town whereas the corresponding percentage among those living it the sub-urban
region came to only 24.
6.5 Majority of the respondents except for people who have qualification less than 10th Class,
when they purchase a new brand get the information from the advertisements. Family members
are the major source of information for the respondents who have qualification less than 10th
Class. Thirty eight per cent of the respondents who have passed 10th class got the information
about a new brand though friends.
International Marketing Conference on Marketing & Society, 8-10 April, 2007, IIMK 591
12. Part VI – Consumer Markets & Marketing
6.6 Advertisement was the main source of information about brands among 57 per cent of the
middle aged and a half of the youth. Among teenagers, 53.3 per cent came to know about the
different brands of cosmetics through their friends. Forty two per cent of the upper middle aged
consumers came to know about the brands through friends.
7. Criteria for Purchase
Around 53 per cent of the respondents considered quality as the most important criteria for
selection of purchase of cosmetics. About a quarter each of the respondents considered the factors
like price (23.7%) and brand (23%) for determining the purchase of cosmetics.
7.1 About 49 per cent of males and 59 per cent of the female respondents considered quality as
the main criterion for purchase of cosmetics. Price seems to be a concern for men (27%) for
selecting cosmetics compared to their women counterparts (19%). There is no substantial gender
difference among the respondents considered brand as the main criterion (males 24% and females
22%).
7.2 Quality was considered as the major criterion for brand selection among the students (71 %),
teachers (67 %), businessmen (58%), housewives (52 %), professionals (50 %), and executives
(43 %). Price was the main concern while purchasing cosmetics among government employees
(45%). This may be because of the limited source of income available to these people to purchase
cosmetics.
7.3 Sixty per cent of the respondents in the lower income group, 55 per cent in the upper income
group and 48 per cent in the middle income category were quality conscious while selecting the
cosmetics items. Brand was considered to be a main concern among a third of the respondents
belonging to the middle income group. That, is relatively a larger per cent in the middle income
respondents were brand conscious compared to lower and upper income categories.
7.4 Quality was considered as the most important criterion for selection of purchase of cosmetics
by respondents than price and brand by the people who live within the town and also by the
people who live in the sub-urban areas.
7.5 Quality was considered as a more important criterion for purchase of cosmetics by
respondents than price and brand by the people across all the qualifications. Respondents who
possess SSLC consider Price also as one of the important criterions. Whereas 35 percent of the
PDC qualified respondents thought of brand as a criterion for purchase the corresponding
percentages among other educational groups found to be relatively less. The criterion for
purchase is significantly different among respondents having different qualifications. Pearson
Chi-square value is 20.150 for 10 degrees of freedom at 5 per cent level of significance.
7.6 Quality was considered as a more important criterion for purchase of cosmetics by 60 per cent
of the youth, 5 6per cent of the teenagers, 49 per cent of upper middle aged and 45 per cent of
middle aged respondents. Around 29 per cent of the middle aged consumers were brand
conscious. About a third of the teenagers, 29 per cent of the upper middle aged and 26 per cent of
the middle aged people were price conscious in selecting cosmetics.
8. Spending Patterns
About 57.6 per cent of the respondents spend about Rs.101 to 300 for purchasing cosmetics. The
rest of the respondents spent an amount in the range of 301-500.
8.1 Percentages of females are high in the categories of consumers who spent an amount in the
range of Rs.101-200 whereas percentages of males are high in the categories of 301-400 and 401-
500.
8.2 A quarter each of the housewives and executives spent more than Rs. 500 per month for
cosmetics. Thirty two per cent of the respondents belonging to the student community had
expenditure in the range of Rs.301-400. Around 35 per cent of the teachers, a quarter of
businessmen, 23 per cent of the govt. employees, more than 20 per cent of the housewives spent
an amount in the range of Rs.201-300 per month for cosmetics. Twenty three percent each of
International Marketing Conference on Marketing & Society, 8-10 April, 2007, IIMK 592
13. Part VI – Consumer Markets & Marketing
businessmen, government employees and teacher used to spend between Rs. 101 and 200. No
substantial variation in spending patterns is found among different occupational groups.
8.3 About 72 per cent of the respondents in the lower income group had an expenditure of less
than Rs.300 per month for their cosmetic purchase while 66 per cent in the middle income and 47
per cent in the upper income respondents spent the same amount. More than half of the
respondents belonging to the upper income group, 43 per cent of those in the middle income
group spent a higher amount (more than Rs.300) for purchasing cosmetics. That is respondents
belonging to the lower income categories spent a lesser amount compared to those in the upper
income group. Chi-square test substantiates the relationship between income and spending pattern
as significant at 1 per cent level of significance. Pearson Chi-square value is 34.822 for 10
degrees of freedom.
8.4 About 46.6 per cent of the respondents living within town spend about Rs.201 to 300 for
purchasing cosmetics and about 45 per cent of the respondents living in the sub-urban spend
between Rs. 101-200. When 21 per cent of those in the sub-urban spend an amount less than 100
for cosmetic purchase, only 8 per cent of those within the town did so. That is the respondents
living within the town had a higher expense for cosmetics compared to those in the sub-urban
areas.
The relationship between place of residence and spending pattern is significantly related at 5%
level for 5 degrees of freedom (Pearson Chi-Square Value is 12.964).
8.5 Spending pattern among all the of respondents having, below 10th class education about half
of those qualified 10th standard and 48 per cent of post graduation seems to be less (up to Rs.300
per month) compared to respondents having other educational qualifications. Around half of the
graduates, and 41 per cent of 12th class spent an amount in the range of Rs.301-500 per month for
cosmetics.
8.6 Seventy per cent of teenagers, 58 per cent of youth, 57 per cent of the upper middle aged, and
56.6 per cent of the middle aged had a monthly expenditure up to Rs.300 for purchasing
cosmetics. Around 45 per cent of middle aged, 43 per cent among the upper middle aged, and 42
per cent of youth spent an amount of more than Rs.300 per month for cosmetics.
Major Findings and Discussions
Gender
Male Consumers
Male consumers generally prefer to purchase and make the brand selection of cosmetics
individually. Quality is the major factor influencing the purchase decision of male consumers.
They tend to buy cosmetic items from a single shop of their convenience. It is also observed that
male consumers buy all their cosmetic items from one shop.
Female Consumers
It has been observed from the study that female cosmetic consumers prefer to purchase cosmetics
individually. It also reveals that one of the main sources of information among the females about
different brands of cosmetics is friends group. Even though friends play a very important role in
women cosmetic purchases, the specific brand selection is most of the times done individually.
Women consumers tend to buy cosmetic items from any shop of their convenience rather than a
single shop. They buy all their cosmetic items from different shops rather than a single shop.
Quality is given utmost preference by the women consumers and they tend to spend Rs.101- 300
per month on cosmetics.
Male consumers tend to spend more on cosmetics i.e. Rs. 301- 500 per month when compared to
females. The findings of Barson (2004) suggest that men’s spending on cosmetics is increasing
and that is mainly due to the demand for men’s hair care, deodorants, razors and blades.
International Marketing Conference on Marketing & Society, 8-10 April, 2007, IIMK 593
14. Part VI – Consumer Markets & Marketing
Selecting the brand exclusively by the spouses or together by both the spouses seems to be
enjoyed by the men compared to women. Women are found to be more, brand specific when
compared to male consumers.
Age
Mode of purchase among teenagers, youth and aged respondents is dominantly individual.
Among the middle aged the practice of purchasing with spouse is prevalent. This difference in
mode of purchase among different age groups is statistically significant. The selection of brand
by the respondents across all the age groups is done individually by themselves. Spouses were
involved in the brand selection among middle aged and upper middle aged cosmetic consumers.
The cosmetic consumers irrespective of their age groups tend to purchase from different shops.
However purchasing all their cosmetics from a particular shop is prevalent among middle aged
and upper middle aged groups compared to youth and teenagers. Youth, middle aged and upper
middle aged respondents do not purchase other brands if they don’t get a specific brand and half
of the teenagers are found to be brand specific. Youth and middle aged dominantly depend on
advertising as a source of brand information. But teenagers and aged people got the information
through friends. Age and source of brand information is statistically significant. Quality is the
main criterion for purchase of cosmetics among all the age groups while some of the teenagers
and upper middle aged were price conscious. When compared to respondents belonging to other
age groups a higher number of middle aged were brand conscious. No substantial difference is
observed in the spending pattern of the respondents belonging to different age groups.
Place of Residence
Urban & Suburban Consumers
Urban & Suburban consumers purchase & select their brands individually. Respondents
belonging to both the categories do not have any specific shop of preference for purchase and
they purchase in multiple shops for their cosmetic needs. Both the types of consumers are found
to be brand specific and Advertisement is the major source of brand information. Quality is the
most important criterion for the purchase of cosmetics for both urban and suburban consumers.
Urban consumers tend to spend more on cosmetics, whereas Suburban consumers tend to spend
less. This might be due to rural and suburban areas concentrating on basic toiletries and cosmetics
(Euromonitor, 2006)
Qualification
Majority of the respondents irrespective of their educational qualification tend to purchase
individually and they consider quality as the most important criterion for purchasing cosmetics.
The main mode of brand selection among the respondents is individual. Respondents with 10th
class education are not so brand specific and tend to purchase all their cosmetics from a single
shop. They also take into consideration the price as one of the factors for purchase of cosmetics.
The study also reveals that respondents with 10th class education tend to spend less on cosmetics
and rest all categories of respondents spend more on the same this can be mainly because it has
been observed from the study that respondents belonging to the lower income categories spent a
lesser amount compared to those in the upper income group.
Occupation
Housewives tend to purchase with their spouse, while most of the respondents in all other
occupational categories purchase cosmetics individually. Respondents belonging to all
occupational groups except teachers and businessmen make their purchase of cosmetics from any
shop of convenience, but these two categories had specific shop for their purchase. Farmers and
teachers were particular in purchasing from a single shop whereas majority of the respondents in
all other occupational groups purchased from multiple shops.
Respondents in all the occupational groups select their brand of cosmetics individually but
Teachers, Government. Employees and Executives make their purchases along with their spouses.
Executives and professionals were not particular about their brands of cosmetics. Rest of the
respondents belonging to other occupational categories was brand specific. The main source of
International Marketing Conference on Marketing & Society, 8-10 April, 2007, IIMK 594
15. Part VI – Consumer Markets & Marketing
brand information among students was friends. Most of the respondents belonging to other
categories got the brand information through advertisements.
A good number of Government Employees were observed to be price conscious and rest of the
respondents considered quality as the main factor for cosmetic purchase. Some of the
housewives, businessmen and executives were reported to be brand conscious. And it was also
found that executives and housewives tend to spend more on cosmetics per month. The monthly
expenditure for cosmetics among students seems to be marginally high. No substantial variation
in spending pattern is found among other occupational groups.
The chi-square test substantiates the relationship between occupation and the shop preference i.e.
shop preference of cosmetic consumers differ according to the occupation.
Income (upper, middle and lower income consumers)
The number of respondents who purchase cosmetics individually is more in the case of
respondents belonging to the lower income group and when compared to the upper and middle
income groups, respondents in the lower income category preferred to purchase all their
cosmetics from a single shop. More than half of the respondents in the upper income, middle
income, and in the lower income category were brand specific in selecting cosmetics. The
remaining respondents had the habit of purchasing any brand.
The main source of information about the brands among the lower and upper income category is
advertisement, whereas advertisement and friends groups were found to be the major sources of
brand information in the case of the respondents in the middle income category. Quality seems to
be the predominant criterion for cosmetic selection among all the three income categories.
However, brand was also considered to be a main concern among a third of the respondents
belonging to the middle income group. Respondents belonging to the lower income categories
spent a lesser amount compared to those in the upper income group. Chi-square test substantiates
the relationship between income and spending pattern as significant at 1 per cent level of
significance.
References
Barson, Donna C. October, 2004
Blackwell, R.D.; Miniard, P.W.; Engel, J.F. (2001). Consumer Behavior (Ninth Edition). Fort Worth:
Hartcourt College Publishers.
Briney, Claire . (2004b). Global Cosmetic Industry, December. .
Briney, Claire. (2004a). Global Cosmetic Industry, August
Chambers Encyclopedia, Volume IV, George Newness Limited, London 1959, p148
Chernev, Alex. (1997). The effect of common features on brand choice: Moderating role of attribute
importance. , Journal of Consumer Research, 23, 304-311.
Euromonitor International: Country Market Insight. (2006). Cosmetics and Toiletries – India, August.
Glenn B. Voss and A. Parasuraman. (2003). Prepurchase Preference and Postconsumption Satisfaction in a
Service Exchange, Marketing Science Institute, Report No. 03-107.
Loudon, D.; Della Bitta. (1986). A. Consumer Behavior. Concepts and Applications, New York: McGraw-
Hill.
Malhotra, Pervin (2003, May 2). The Beauty of Being a Beautician. Chandigarh, The Tribune.
Monteiro, Noella. Report Date: 04/04/2003
Russo, Edward J. and Leclerc, France. (1994 ). An Eye-Fixation Analysis of Choice Processes for
Consumer Non Durables, Journal of Consumer Research, 21, 274-290.
Sinha, P. K. (2003). Shopping Orientation in the Evolving Indian Market, Vikalpa, 28(2), 13-22.
Vigneron, Franck and Johnson, Lester W. (1999). A Review and a Conceptual Framework of Prestige-
Seeking Consumer Behavior. Academy of Marketing Science Review, 1999 (1), 1-15.
International Marketing Conference on Marketing & Society, 8-10 April, 2007, IIMK 595